Nine Engineering Failures and the Controls That Would Have Caught Them
testing-validation
iot
deployment
failure
22.1 Start With the Assumption That Broke
Read each case as a trail from assumption to symptom to control. The useful question is not only what failed, but which belief, measurement, handoff, or recovery plan made the failure possible and how that control should be checked next time.
Chapter Roadmap
First, turn each failure story into an evidence packet: assumption, signal, symptom, causal chain, and prevention control.
Then, compare connectivity and protocol cases where field conditions, roaming, gateways, and fallback plans decide whether the system survives.
Next, inspect power and security failures where datasheet assumptions, credentials, encryption, and audit trails become operational risks.
Finally, use scaling, integration, and the prevention checklist to convert the lessons into deployment gates.
Checkpoint callouts pause after major failure groups; deep-dive sections hold worked detail that supports, but does not replace, the main control story.
22.2 Learning Objectives
After completing this chapter, you will be able to:
Analyze root causes of IoT project failures across connectivity, power, security, scaling, and integration domains
Apply prevention checklists to avoid common deployment mistakes before they occur
Explain why testing in actual deployment conditions is critical for connectivity and power budget validation
Evaluate security design decisions using lessons learned from known breach patterns
22.3 Read Failures as Evidence
A failure case is useful when it shows the chain from assumption to symptom to control. In IoT, that chain often crosses hardware, radio links, firmware, cloud services, mobile apps, support operations, and user behavior. A battery story is not just about a cell. It can include firmware wakeups, retransmission policy, GPS fix timing, sleep current, service outages, and the support plan for replacing devices. A radio story is not just about distance. It can include antenna placement, gateway backhaul, vegetation, duty-cycle policy, downlink scarcity, provisioning errors, and a dashboard that hides missing data behind stale totals.
Read each case as an evidence packet rather than a warning label. Start with the assumption that failed, then identify the first observable signal, the symptom noticed by users or operators, the causal chain between them, the control that would have limited the damage, the owner of that control, and the recheck trigger that would reopen the design decision. This structure keeps the lesson transferable. A LoRaWAN farm case may teach seasonal coverage testing; a Wi-Fi asset-tag case may teach roam testing and AP-channel review; an MQTT broker overload may teach load testing, session-state limits, and queue-depth alerts. The technology names matter, but the repeated discipline is to connect evidence to a design control.
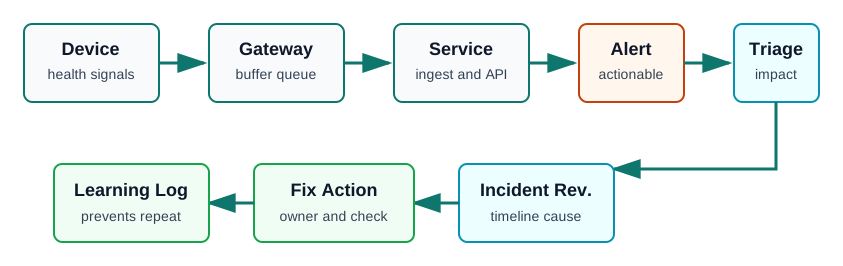
The observability-loop figure shows the loop a case study should close: signals move from the device, gateway, and service into alerting, triage, incident review, corrective action, and a learning record. If a story stops at “the devices failed,” it has not yet become engineering knowledge.
A failure case becomes reusable when signals lead to review, action, and a learning record instead of stopping at the symptom.
Good case reviews avoid simple blame. Mirai is not only a story about malware; it is also a story about weak/default credentials, exposed management services, absent fleet update paths, and the blast radius created when many devices share the same poor assumptions. A battery recall is not only a procurement mistake; it may reveal missing sleep-current measurement, no pilot under production firmware, no threshold alert, and no operational plan for field replacement. The reusable lesson is the relationship between the failed assumption, the missing signal, and the prevention control.
Failure pattern: the repeated shape, such as RF coverage loss, power-budget drift, default credentials, broker overload, or API churn.
Prevention control: field survey, load test, staged rollout, unique credentials, OTA path, rollback plan, capacity model, or vendor-contract check.
22.4 Convert Stories Into Controls
Do not stop at “test more.” Name the concrete boundary. For LoRaWAN, inspect link budget, spreading factor, ADR behavior, duty-cycle limits, gateway placement, antenna height, vegetation, terrain, and backhaul. For Wi-Fi tags, inspect AP density, channel plan, 2.4 GHz interference, roaming behavior, DHCP lease churn, and MQTT reconnect timing. For battery-powered devices, measure current with the production firmware, not just a datasheet estimate. For cloud-connected products, inspect the broker, database, dashboard, mobile application, and support workflow together, because the customer experiences them as one system.
Run the review with a timeline. Mark when the assumption entered the project, when the first weak signal appeared, when the symptom became visible, when the team understood the cause, and when the control was added. Collect signals from the device, gateway, cloud service, application logs, monitoring system, and support channel. A useful packet might include RSSI/SNR by location, MQTT reconnect counts, Mosquitto or EMQX session growth, retained-message behavior, InfluxDB write failures, Grafana panel freshness, TLS certificate age, firmware version distribution, mobile crash logs, and ticket wording from affected users. The goal is to separate cause, contributing factor, detection gap, and recovery gap.
A practical failure review should produce a small control that can be run before the next deployment. Examples include a LoRaWAN coverage walk with packet delivery and SNR logs, a Mosquitto or EMQX load test with retained-message and session-state checks, an InfluxDB write-retention check, a Grafana freshness panel, a credential uniqueness test, and a staged rollout gate that stops a firmware update when error rates rise. For vendor-dependent integrations, add an API contract review, certificate expiry monitor, webhook retry test, and fallback behavior for rate limits or schema changes. For security-sensitive fleets, add unique credentials, disabled debug services, secure update verification, and a documented revocation path.
The output should be reviewable by someone who was not in the incident meeting. Write the assumption, evidence, root cause, rejected alternatives, corrective action, owner, due date, and recheck trigger in one short record. Then convert it into a gate, checklist item, simulation input, lab step, monitoring alert, or architecture decision note. If the review cannot name where the control will live, it will probably be forgotten before the next project pressure arrives.
State the assumption. Example: “The gateway can hear all field nodes during crop growth.”
Name the measured signal. Example: packet delivery ratio, RSSI, SNR, retry count, and join failure rate by field zone.
Choose the control. Example: seasonal RF survey, second gateway, ADR review, antenna repositioning, and an alert when delivery drops below the project threshold.
22.5 Small State Errors Cause Incidents
Large IoT failures rarely come from one isolated bug. They usually appear when several state models disagree: device state, network state, cloud state, user state, and operations state. A device may think it has published a reading, while the broker has dropped the session, the database has rejected a field name, the dashboard is showing stale time windows, and support has no device-version context. The incident is the moment those mismatches become visible to a user, but the conditions often existed earlier.
Trace the state transitions explicitly. A battery sensor wakes, samples, timestamps, encrypts, queues, transmits, waits for acknowledgement, sleeps, and later receives an OTA update. The gateway buffers, forwards, reconnects, and may translate protocols. The MQTT broker tracks client identifiers, session persistence, subscriptions, retained messages, ACLs, Last Will and Testament, and queue limits. The database accepts or rejects schema changes, retention policies, and timestamps. The dashboard aggregates by time window and may silently hide missing devices. A mobile app retries requests and caches stale values. A support tool maps a customer complaint to a device model, firmware version, location, and ownership record. Any unobserved transition can become the place where the failure hides.
Known incidents such as Mirai show why a small device-level choice can become an Internet-scale failure when weak/default credentials, open management ports, exposed services, and absent update paths line up. The same systems thinking applies to less dramatic projects: one hardcoded MQTT topic, one missing TLS certificate renewal path, one unbounded retry loop, or one unsupported vendor API can turn into a fleet problem. Retries can create load, load can delay acknowledgements, delayed acknowledgements can trigger more retries, and a dashboard without freshness checks can make the fleet appear healthier than it is.
The deeper lesson is to review interfaces and state transitions, not just components. Check authentication, authorization, firmware version, certificate expiry, payload schema, timestamp source, retry/backoff policy, data retention, queue depth, dashboard freshness, and rollback readiness as linked parts of one operating system. Also check blast radius. A design with idempotent commands, bounded queues, canary rollout, replay protection, rollback, per-tenant limits, and clear ownership can still fail, but it is less likely to turn a local defect into a fleet-wide incident. The best case study therefore explains not only what broke, but why the break propagated as far as it did.
Checkpoint: Evidence to Control
You now know how to read a case as assumption, signal, symptom, causal chain, and prevention control.
You now know why state transitions across device, gateway, broker, database, dashboard, mobile app, and support tools can hide the real failure.
You now know that a review record needs an owner and recheck trigger so the lesson becomes a gate, checklist item, simulation input, lab step, monitoring alert, or architecture decision note.
For Beginners: IoT Failure Case Studies
Learning from other people’s mistakes is one of the fastest ways to become a better engineer. These case studies combine documented incident patterns and realistic teaching scenarios – from batteries that died in months instead of years, to security breaches caused by default passwords. Each story explains what went wrong, why, and how you can avoid the same mistake. You do not need technical expertise to learn from these; the lessons are practical and widely applicable.
In 60 Seconds
IoT failure patterns explained with root cause analysis and prevention checklists. Covers connectivity failures (LoRaWAN range, Wi-Fi congestion), power miscalculations (10-year batteries lasting months), security breaches (default passwords, unencrypted health data), scaling meltdowns, and integration problems. Learn from expensive mistakes before making your own.
Key Concepts
Root Cause Analysis (RCA): Systematic technique identifying the fundamental cause of an IoT failure rather than just treating symptoms (e.g., root cause = no OTA update mechanism, symptom = 10,000 devices with expired TLS certificates)
Failure Mode: Specific way in which an IoT system can fail — connectivity loss, power exhaustion, security breach, data corruption, scaling overload
Post-Incident Review (PIR): Blameless structured analysis conducted after an IoT system failure to extract learnings and prevent recurrence
Prevention Checklist: Pre-deployment verification list derived from historical failures to catch common issues before they reach production
Design for Failure: Architectural philosophy assuming components will fail and engineering systems to detect, contain, and recover from failures gracefully
Blast Radius: Scope of impact when an IoT failure occurs — how many devices, users, or processes are affected, used to prioritize failure prevention investment
Contributing Factor: Condition that made a failure more likely or severe without being the direct cause (e.g., lack of monitoring that delayed detection)
Lessons Learned Database: Organizational knowledge repository capturing IoT project failure patterns to prevent their recurrence in future deployments
Quick Check: Learning From Failures
22.6 IoT Failure Case Studies
Learn from Failure
The best engineers learn as much from failures as from successes. This chapter explains common IoT project failure patterns, their root causes, and how to avoid them. Unless a named external incident is cited, the dollar amounts, fleet sizes, and timelines in this page are teaching scenario values rather than claims about a specific company.
22.7 Turn Failures Into Controls
Identify the failed assumption. Translate a dramatic symptom into a specific assumption such as “SF7 reaches every sensor,” “sleep current stays near the datasheet value,” “every device has unique credentials,” or “the vendor API will remain compatible.”
Tie it to a signal. Choose a measurable signal such as packet delivery ratio, RSSI/SNR, retry count, sleep current, battery voltage, certificate expiry, broker queue depth, API error rate, or dashboard freshness.
Add a pre-deployment control. Convert the lesson into a field test, load test, credential check, staged rollout gate, rollback plan, or vendor-contract checkpoint that a future team can actually run.
22.8 Failure Analysis Examples
Beginner Example: A classroom LoRaWAN demo works across one hallway but fails behind two concrete walls. The failed assumption is clear line-of-sight. The signal is packet delivery ratio plus RSSI/SNR by location. The control is a site walk before promising coverage.
Intermediate Example: A battery sensor meets the spreadsheet budget but dies early in a pilot. The failed assumption is that production firmware sleeps like the datasheet example. The signal is measured sleep current, wake frequency, transmit current, and retry count. The control is a current trace with the release firmware.
Advanced Example: A building platform works with one vendor but slips when five vendor APIs change independently. The failed assumption is stable integration semantics. The signal is version drift, authentication failures, rate-limit responses, and contract-test failures. The control is a contract-first integration harness plus staged rollout by building.
Capacity: Plan for max 30 IoT devices per AP (not 50+)
Channels: Use 5GHz where possible, non-overlapping channels
Interference Survey: Conduct RF survey BEFORE deployment
Protocol Choice: Consider BLE mesh or Thread for moving assets
Roaming: Use 802.11r/k/v for fast roaming if available
Better Architecture:
ORIGINAL (Failed):
[500 Tags] --Wi-Fi--> [10 APs] --> [Server]

IMPROVED (Successful):
[500 BLE Tags] --> [50 BLE Gateways] --Ethernet--> [Server]
                        |
                   No interference
                   No roaming issues
                   $40 per gateway
The Setup: Retrofit 50 commercial buildings with smart lighting and HVAC using “the latest standard.”
What Went Wrong:
Specified Matter protocol before devices were available
Interim solution used 4 different protocols (Zigbee, Z-Wave, BLE, proprietary)
Integration nightmare with 6 different apps
Firmware updates broke compatibility monthly
Root Cause: Choosing emerging standards without fallback plan
Lessons Learned:
Protocol Selection Rules
Do not depend solely on unreleased standards for production deployments
Have a migration path from current to future protocols
Use protocol gateways to isolate devices from cloud changes
Standardize on ONE protocol per building if possible
Reserve integration test capacity for vendor changes, commissioning, and fallback paths
Checkpoint: Connectivity Controls
You now know that connectivity failures are not only radio problems; they include field conditions, roaming behavior, gateway placement, backhaul, and fallback planning.
You now know to pair each story with a measured signal such as RSSI/SNR, packet delivery, retry count, join failure rate, or reconnect timing.
You now know to turn protocol choices into migration paths, gateway boundaries, and integration test capacity before deployment pressure arrives.
The Setup: 10,000 water meters with “10-year battery life” deployed across a city.
What Went Wrong:
Datasheet claim: 10 years @ 1 msg/day
Reality: 3 months average life

Why?
- Specification: 1 message/day
- Implementation: 1 message/hour (for "better monitoring")
- Plus: 10 retries per failed message
- Plus: GPS fix every message (not needed!)
- Plus: Full power during server maintenance
Power Budget Analysis:
Messages per Day
Telemetry frequency exploded
Specified: 1 message/day
Actual: 24 messages/day
Impact: 24x more energy than planned.
TX Power
Radio configuration drifted upward
Specified: 14 dBm
Actual: 20 dBm
Impact: Roughly 4x the transmission power.
GPS
Location logic consumed the budget
Specified: Never enabled
Actual: GPS fix on every message
Impact: 100 mA for 30 seconds per reading was severe overkill.
Sleep Current
Standby power hid a firmware bug
Specified: 1 µA
Actual: 50 µA because of a bug
Impact: Standby draw was 50x higher than expected.
Putting Numbers to It
The “10-year battery” claim was based on theoretical calculations that ignored real deployment conditions. Let’s see the math that predicted 10 years and the reality that delivered 3 months:
Equipment: Power Profiler Kit (Nordic nRF or Joulescope)
Findings:
Sleep current: 50 µA (NOT 1 µA!) - GPIO leakage, regulator quiescent current
Sensor warmup: 5 mA for 300 ms (NOT 100 ms) - datasheet showed "typical" not max
LoRa TX: 35 mA for 2.5 sec including ACK wait
Firmware bug: ADC left on, consuming 100 µA constantly
ACTUAL TOTAL: 3.8 mAh/day (8.3× higher than theory!)

Real battery life: 2400 ÷ 3.8 = 631 days = 1.7 years
Step 3: Fix Issues
GPIO Leakage
Disable all unused GPIOs
Savings: -30 µA
Regulator Loss
Switch to an ultra-low quiescent regulator (TPS62840)
Savings: -15 µA
Sensor Warmup
Pre-warm once every 10 samples
Savings: -0.5 mAh/day
ADC Bug
Disable the ADC after each read
Savings: -100 µA
LoRa Retries
Implement exponential backoff
Savings: -0.3 mAh/day
New total: 1.2 mAh/day Validated life: 2400 ÷ 1.2 = 2,000 days = 5.5 years
SF7 → SF8 on LoRa (better link margin, fewer retries) → -0.1 mAh/day
Result: 0.7 mAh/day (exceeds 10-year target with margin)
Cost: 2 days of engineering time with power profiler = $1,600 Saved: Avoiding field replacement of 10,000 devices in year 2 = ~$200,000
Key Lesson: ALWAYS measure actual power. Datasheets show “typical” or “minimum” values. Real-world deployments see 5-10× higher consumption due to: 1. Sleep current dominated by leakage, not MCU datasheet 2. Peripheral warmup times longer than advertised 3. Firmware bugs (most common cause!) 4. Environmental factors (cold weather increases battery ESR)
Tool Cost: Joulescope: $500, Nordic PPK2: $90. ROI on first project.
22.11.2 Case 5: The Solar-Powered Failure
Project: Remote Environmental Monitoring
Investment: $50,000 | Duration: 6 months | Outcome: Winter data gap
The Setup: Solar-powered air quality sensors in a northern city (52°N latitude).
What Went Wrong:
Summer: Perfect operation ✓
Fall: Intermittent outages
Winter: 3 months of no data
Spring: Sensors damaged by deep discharge
Root Cause:
Summer
Comfortable positive energy balance
Solar hours: 16 h
Panel output: 5 W average
Consumption: 1 W
Balance: +64 Wh/day
Winter
Daily deficit drained the battery
Solar hours: 6 h
Panel output: 0.5 W average
Consumption: 1 W
Balance: -21 Wh/day
Battery capacity: 50Wh. Winter deficit accumulated until batteries died.
html`<div class="failure-case-studies-calc-shell failure-case-studies-calc-shell--solar"><h4 class="failure-case-studies-calc-title">Solar Energy Analysis (${season})</h4><div class="failure-case-studies-calc-grid"> <div class="failure-case-studies-calc-card"> <span class="failure-case-studies-calc-label">Daily Generation</span> <span class="failure-case-studies-calc-value">${solar_calc.daily_generation.toFixed(1)} Wh/day</span> </div> <div class="failure-case-studies-calc-card"> <span class="failure-case-studies-calc-label">Daily Consumption</span> <span class="failure-case-studies-calc-value">${solar_calc.daily_consumption.toFixed(1)} Wh/day</span> </div> <div class="failure-case-studies-calc-card"> <span class="failure-case-studies-calc-label">Daily Balance</span> <span class="failure-case-studies-calc-value" style="color: ${solar_calc.daily_balance>=0?'#d5ffe8':'#ffd6d6'};">${solar_calc.daily_balance>=0?'+':''}${solar_calc.daily_balance.toFixed(1)} Wh/day </span> </div> <div class="failure-case-studies-calc-card"> <span class="failure-case-studies-calc-label">Battery Autonomy</span> <span class="failure-case-studies-calc-value" style="color: ${solar_calc.battery_days>= cloudy_days ?'#d5ffe8':'#ffe7b3'};">${solar_calc.battery_days.toFixed(1)} days</span> <span class="failure-case-studies-calc-sub">Target buffer: ${cloudy_days} cloudy days</span> </div> <div class="failure-case-studies-calc-card"> <span class="failure-case-studies-calc-label">System Status</span> <span class="failure-case-studies-calc-value" style="color: ${solar_calc.sustainable?'#d5ffe8':'#ffd6d6'};">${solar_calc.sustainable?'Sustainable':'Insufficient'} </span> </div></div>${!solar_calc.sustainable?`<div class="failure-case-studies-calc-callout failure-case-studies-calc-callout--danger"> <strong>Warning:</strong> ${solar_calc.daily_balance<0?`Daily deficit of ${Math.abs(solar_calc.daily_balance).toFixed(1)} Wh means the battery will drain over time.`:`Battery autonomy (${solar_calc.battery_days.toFixed(1)} days) is below the ${cloudy_days}-day weather buffer.`} </div>`:''}${solar_calc.sustainable?`<div class="failure-case-studies-calc-callout failure-case-studies-calc-callout--success"> <strong>Success:</strong> The system can operate indefinitely with a ${cloudy_days}-day cloudy-weather buffer. </div>`:''}</div>`
Checkpoint: Power Evidence
You now know to distrust a battery-life claim until production firmware, sleep current, wakeups, retransmission policy, and environmental behavior are measured together.
You now know that power cases need both a budget and a field validation plan, because solar input, cloudy-weather buffer, and maintenance access shape the real outcome.
You now know to record the gap between datasheet estimate and deployed behavior as a control, not just as a post-mortem anecdote.
22.12 Security Breaches
22.12.1 Case 6: The Default Password Botnet
Project: Smart Camera Network (Consumer)
Outcome: 100,000 devices compromised
The Setup: Consumer security cameras with “easy setup” shipped with default password admin:admin.
What Went Wrong:
Day 1: Cameras connected to internet
Day 3: Shodan indexed open ports
Day 7: Botnet scanning began
Day 14: 100,000 cameras compromised
Day 30: Used in DDoS attack (Mirai variant)
Root Cause Analysis:
Default Credentials
Authentication was effectively absent
Impact: trivial authentication bypass.
No Forced Change
Operators never rotated the factory secret
Impact: default passwords stayed in production.
UPnP Enabled
Home routers exposed the fleet automatically
Impact: automatic port forwarding widened the attack surface.
Unsigned Firmware
Malware could survive reboots
Impact: persistence after compromise.
Telnet Enabled
Attackers gained a direct remote shell
Impact: easy remote access for botnet operators.
Lessons Learned:
IoT Security Minimums
Unique per-device credentials - printed on device, never defaults
Force password change on first use
Disable UPnP by default - require explicit enable
Signed firmware only - prevent malicious updates
Disable unnecessary services - no telnet, minimal ports
Investment: $500,000 | Outcome: HIPAA violation, $1.5M fine
The Setup: Wearable health monitors transmitting patient vitals to cloud.
What Went Wrong:
Data transmitted over HTTP (not HTTPS)
BLE pairing used “Just Works” (no authentication)
Patient IDs in plaintext in MQTT topic names
No audit logging of data access
Data stored without encryption at rest
Discovery: Security researcher demonstrated interception in conference presentation.
Lessons Learned:
Healthcare IoT Security
TLS everywhere - no exceptions, even “internal” networks
BLE: Use Secure Connections - never Just Works for sensitive data
Anonymize identifiers - hash or encrypt patient IDs
Encryption at rest - database and backup encryption
Audit everything - who accessed what, when
Penetration test - before launch, not after breach
Checkpoint: Security Controls
You now know that default passwords, exposed services, weak pairing, plaintext identifiers, and missing audit logs are design decisions, not cleanup tasks.
You now know to connect credentials, TLS, BLE Secure Connections, encryption at rest, signed firmware, and audit evidence into one launch gate.
You now know why sensitive fleets need a documented revocation path and secure update verification before the first incident.
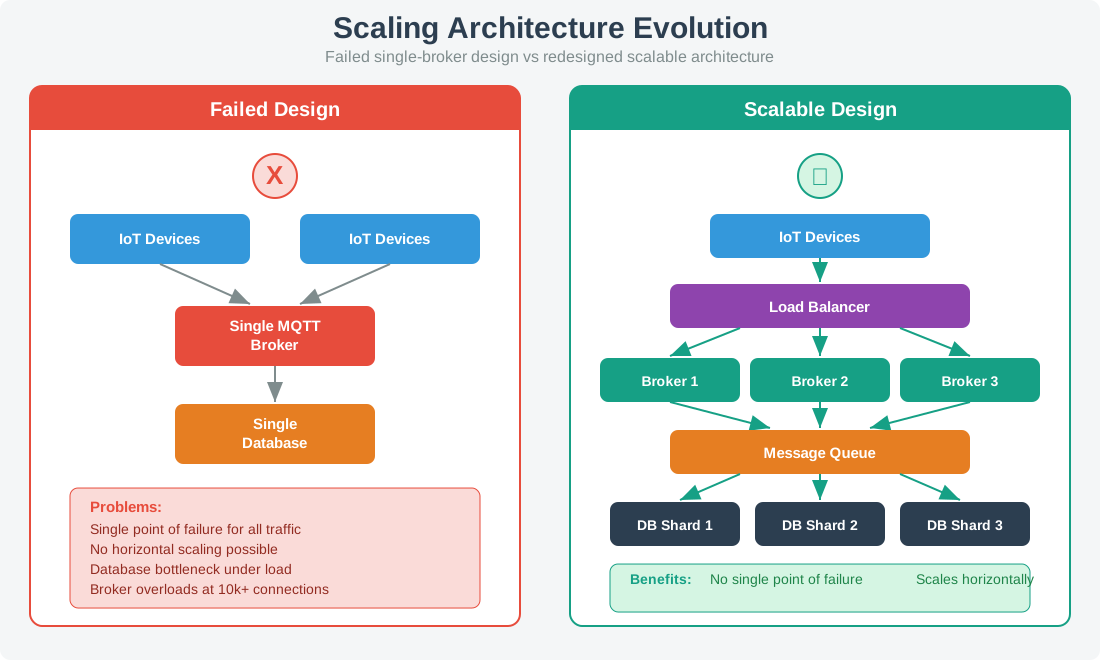
Architecture evolution from single-point-of-failure design to horizontally scalable architecture with load balancing, multiple brokers, message queue, and database sharding.
Lessons Learned:
Scalability Design Principles
Design for 10x current scale - growth surprises everyone
Horizontal scaling - add nodes, not bigger nodes
Stateless services - no server affinity
Shard data - no single database bottleneck
Queue everything - decouple producers from consumers
Load test regularly - with production-like data
Interactive Scaling Calculator:
Show code
viewof current_devices = Inputs.range([1000,1000000], {value:50000,step:1000,label:"Current Devices",width:300})viewof growth_rate = Inputs.range([0.1,5], {value:1.5,step:0.1,label:"Annual Growth Factor (x)",width:300})viewof msgs_per_device = Inputs.range([1,100], {value:10,step:1,label:"Messages per Device per Hour",width:300})viewof broker_capacity = Inputs.range([1000,100000], {value:10000,step:1000,label:"Messages per Broker per Hour",width:300})viewof db_capacity = Inputs.range([100,10000], {value:1000,step:100,label:"DB Writes per Second per Shard",width:300})viewof architecture = Inputs.select(["Single Broker","Multiple Brokers + Queue","Fully Distributed"], {label:"Architecture",value:"Single Broker"})
The Setup: Integrate 5 vendor systems (HVAC, lighting, access, security, energy).
What Went Wrong:
Vendor A: REST API v2.1
Vendor B: REST API v3.0 (breaking changes monthly)
Vendor C: SOAP (yes, really)
Vendor D: Proprietary binary protocol
Vendor E: "API available Q4" (arrived Q2 next year)
Integration Complexity:
HVAC ↔︎ Lighting
Simple estimate hid API churn
Estimated: 2 weeks
Actual: 8 weeks
Issue: Rate limiting and authentication changes.
Access ↔︎ Security
Protocol mismatch multiplied adapter work
Estimated: 3 weeks
Actual: 12 weeks
Issue: Incompatible protocols between vendors.
Energy ↔︎ All
Late vendor delivery broke the plan
Estimated: 4 weeks
Actual: 16 weeks
Issue: Vendor E missed the promised API timeline.
Lessons Learned:
Integration Best Practices
Verify API stability - check changelog frequency
Build abstraction layer - isolate vendor changes
Contract-first design - define interfaces before coding
Mock everything - don’t depend on vendor availability
Version everything - never break existing integrations
Plan explicit integration margin for vendor delays, protocol mismatches, and commissioning checks
Checkpoint: Scale and Integration
You now know that scaling failures can come from queue depth, session state, database writes, dashboard freshness, and support visibility, not only server capacity.
You now know to isolate vendor changes with contracts, mocks, versioning, abstraction layers, and explicit integration margin.
You now know to finish a failure review by choosing where the control will live: pre-deployment checklist, load test, staged rollout gate, monitoring alert, or architecture decision note.
22.15 Failure Prevention Checklist
Before deploying any IoT project, verify:
22.15.1 Connectivity
22.15.2 Power
22.15.3 Security
22.15.4 Scale
22.15.5 Integration
Match Failure Types to Root Causes
Analyze an IoT Failure Case
Place these analysis steps in the correct order.
Key Takeaway
Many IoT project failures stem from testing in ideal conditions rather than deployment environments. Test with actual terrain, weather, interference, firmware, and operating load; measure real power consumption instead of relying only on datasheet estimates; enforce unique device credentials; design with growth headroom; and plan explicit integration margin.
For Kids: Meet the Sensor Squad!
The Case of the Silent Sensors
Sammy the Sensor was so excited! He and 199 of his friends were placed across a huge farm to watch over the crops. “We will send messages about the soil every day!” cheered Sammy.
But then the corn grew tall – really, REALLY tall. “Hey, I cannot hear the gateway anymore!” called Sammy from behind the towering stalks. Max the Microcontroller tried turning up the signal power, but Bella the Battery groaned, “If you do that, I will run out of energy in a week!”
Lila the LED blinked a warning pattern. “We should have tested when the corn was fully grown, not just when the field was empty!”
The lesson Sammy learned: Test your IoT project in the REAL conditions it will face – not just the easy ones. Plants grow, weather changes, and what works in a lab might not work in a field. Plan ahead and keep a backup path!
Can you think of something in your home that works differently in summer versus winter?
Knowledge Check: IoT Failure Analysis
IoT Failure Case Relationships
Connectivity Failures
Relates to: Protocol Selection + Field Testing
LoRaWAN range failures happen when lab testing ignores terrain, vegetation, and interference in the real site.
Power Budget Miscalculations
Relates to: Sleep Modes + Transmission Frequency
Batteries lasting months instead of years usually trace to missing deep sleep or far more transmissions than budgeted.
Security Breaches
Relates to: Default Credentials + Encryption
Mirai-style compromise disappears when fleets use unique per-device credentials and modern encryption hygiene.
Scaling Issues
Relates to: Cloud Architecture + Load Testing
Systems that look stable at 100 devices collapse at 10,000 without queueing, sharding, and horizontal scale.
Integration Problems
Relates to: API Versioning + Legacy Systems
Retrofit programs fail when teams assume modern REST interfaces can cleanly meet old Modbus or proprietary systems.
Reading case studies as interesting stories without extracting reusable principles provides entertainment but not protection. For each case study, explicitly ask: “What general design rule would have prevented this?” Convert each case into a checklist item applicable to your own IoT projects.
Failures Hit Experienced Teams
Famous IoT failures have occurred at well-funded companies with experienced engineers. The common factor is not inexperience — it is specific architectural blind spots (no OTA update mechanism, inadequate security threat modeling, untested failure scenarios). Study failures with the assumption that your project could make the same mistakes.
3. Focusing Only on Technical Failures
Many IoT project failures are organizational or process failures: inadequate requirements gathering, insufficient field testing, poor user research, or missing operational procedures. Technical solutions to organizational problems rarely succeed. Analyze the full sociotechnical system, not just the hardware and software.
Label the Diagram
22.16 Try It: Build a Failure Review Note
Choose one case from this page. Write four lines: the failed assumption, the measured signal that would reveal it, the prevention control, and the next course page you would use to practice the underlying skill. Keep the note specific enough that another learner could run the check.
Code Snippet Library for reviewing implementation examples after a failure pattern points to firmware or integration code.
Concept Navigator for finding related protocol, power, security, and scaling concepts.
22.18 Summary
This chapter uses failure case studies to connect IoT concepts with real design and operations mistakes. Case studies help learners reason about causes, consequences, safeguards, and better review habits.
 Checkpoint: Evidence to Control