7 System Validation
Verification, Validation, Test Levels, the Pyramid, and Field Evidence
IoT testing, verification vs validation, testing pyramid, test levels, code coverage, hardware in the loop, field validation, conformance vs interoperability
7.1 Start With the Story: The Device Worked Until It Left the Bench
Picture a soil-moisture node that passes every desk check: the firmware boots, the ADC returns numbers, the cloud receives payloads, and the dashboard draws a line. Then it goes into a greenhouse, condensation reaches the connector, the radio fades near a metal rack, and the farmer still does not trust the alert. The build was verified, but the mission was not yet validated.
Start simple: write down the real claim before choosing a test. If the claim is “this calculation follows the spec,” verification can answer it. If the claim is “this helps someone make the right decision in the field,” validation has to include the environment, user, network, device state, and evidence record that make the claim believable.

Test Tessa
“A demo proves it can work once; a test proves it keeps working — bring the field, not the bench.”
Through this module, Tessa runs her Field Check on each result: what the bench showed, what the field adds, and what evidence earns her stamp.
7.2 Overview: Verify the Build, Validate the Mission
Two words do most of the work in this module, and they are not synonyms. Verification asks whether the system was built correctly against its specification: does the firmware compute the right value, does the message match the schema, does the function return what the contract promised. Validation asks a harder question: does the built system actually solve the intended problem once it is in someone’s home, field, or factory. A device can pass every verification test and still fail validation because the specification itself was wrong for the real world.
Both are required, and for connected hardware the stakes are unusual. A web service that ships a bug can patch it in minutes for every user at once. A deployed IoT device may run for years in a harsh environment, behind intermittent connectivity, owned by someone who never applies an update. The deploy-and-forget reality is why the industry leans on shift-left testing: the widely cited rule of thumb is that a defect grows roughly an order of magnitude more expensive to fix at each later stage, so a problem caught at the desk is cheap and the same problem caught in the field can mean truck rolls, recalls, or a device that simply stays broken.
If you only need the intuition, this layer is enough: verification confirms you built the thing right, validation confirms you built the right thing, and IoT raises the cost of being wrong because field fixes are slow, uncertain, or impossible. Test at every layer, find defects as early as you can, and keep proving the system in the conditions where it will actually live.
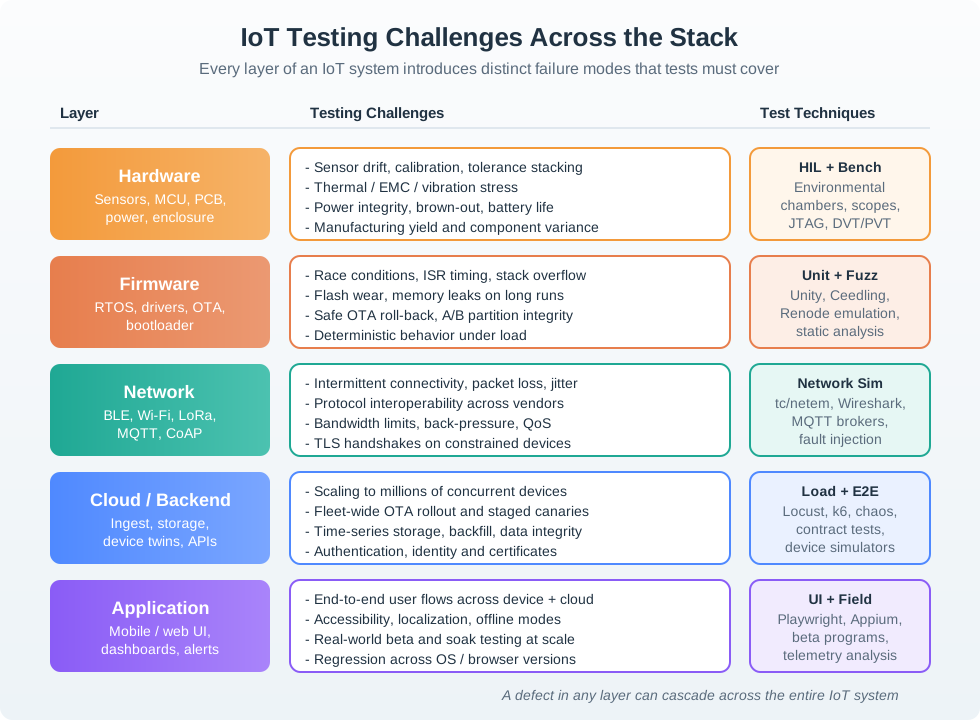
Why IoT Testing Is Different
Traditional software runs on known servers with a reliable network and instant updates. An IoT product runs across a stack that can each fail independently — sensor and circuit, firmware, radio link, cloud service, mobile app — and a failure in any layer can propagate through the whole system. It also lives in physical conditions a unit test cannot reproduce: temperature extremes, vibration, power brown-outs, RF interference, and users who install it in places the designer never imagined. Because the device may never be reachable again, the testing has to be more thorough before it ships, not after.
The One-Minute View
Verify vs validate
Verification checks the spec was met; validation checks the spec was right for the real problem. You need both.
Test every layer
Firmware, hardware, connectivity, cloud, and app each fail differently, and failures propagate across the whole system.
Shift left
Field fixes are slow, costly, or impossible, so find defects as early as possible rather than after deployment.
Beginner Examples
- A thermostat passes every unit test in a California lab but fails in Alaska because its antenna degrades below freezing — verification passed, validation did not.
- Poorly secured devices have been recruited in large numbers into IoT botnets; weak pre-release security testing has real downstream consequences.
- “All tests are green” is a verification claim; “real users in real conditions got what they needed” is a validation claim, and only one of them ships confidence to the field.
Overview Knowledge Check
If you can explain why a green test suite is not the same as a validated product, you have the core idea. Continue to Practitioner for the test levels and how to balance them.
7.3 Practitioner: Test Levels, the Pyramid, and When to Run What
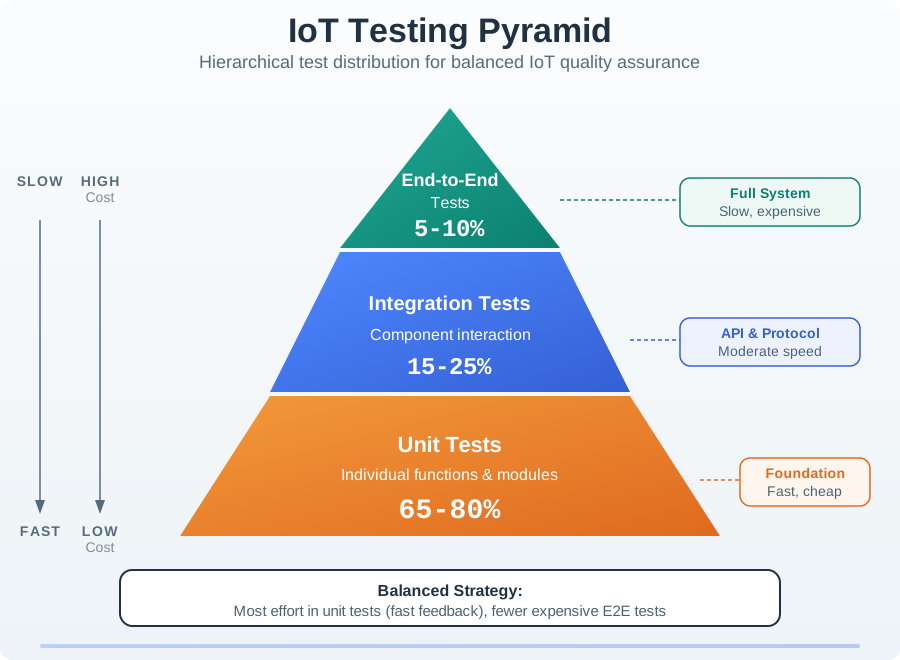
A real strategy is built from named test levels, each answering a different question. Unit tests check individual functions or modules in isolation, often with hardware mocked. Integration tests check that components work together across an interface — firmware to cloud, device to app, one service to another. System (end-to-end) tests exercise the complete path from sensor to dashboard. Acceptance tests confirm the system meets user-facing requirements. Around these sit specialized levels that IoT demands: hardware-in-the-loop, environmental, security, and field or soak testing.
The Testing Pyramid
The pyramid is a heuristic for distributing effort by cost and speed. Fast, cheap, repeatable unit tests form the wide base; slower integration tests sit in the middle; expensive end-to-end tests are the narrow top. A common guideline is roughly two-thirds to four-fifths unit tests, with integration and end-to-end making up the remainder — treat the exact percentages as a target, not a law. The reasoning is behavioral, not numeric: a suite that runs in seconds gets run on every commit and catches bugs while they are cheap, while a suite that takes hours gets skipped, and skipped tests catch nothing.
Run the Right Test at the Right Time
Cadence matters as much as coverage. Map each test level to a trigger so the fast checks gate every change and the expensive ones run when they are worth it: unit tests, static analysis, and a build check on every commit; integration and security scans on pull requests; hardware-in-the-loop and extended integration nightly; soak and full regression weekly; environmental, security, and field validation before release. The point is to keep developer feedback in seconds while still exercising the slow, real-world paths on a schedule.
Tessa’s Field Check
- Bench says: unit tests, static analysis, and a build check pass on every commit, in seconds.
- Field adds: hardware-in-the-loop nightly, soak weekly, environmental and field validation before release.
- Stamp when: every level has a trigger, so the slow real-world paths actually run.
Spend Coverage Where Failure Hurts
Coverage is a budget, not a single global number. Allocate it by the impact of failure: safety-critical paths warrant the highest coverage because a defect can cause injury; core logic and protocol implementations need high coverage because bugs there break the product or mishandle edge cases; utility code and hardware-abstraction layers can take lower targets because they are lower risk or are exercised in integration. Track coverage per feature, not as one average that hides an untested critical path behind an over-tested trivial one.
Practitioner Knowledge Check
If you can name the levels, place them in the pyramid, schedule them by cadence, and budget coverage by risk, you can stop here. Continue to Under the Hood for what coverage hides and how validation continues in the field.
7.4 Under the Hood: Coverage Quality, Metrics, and Validation That Continues
The deeper layer is about the gap between a passing suite and a trustworthy system. Three things separate teams that ship reliable hardware from teams that merely have green dashboards: they know what coverage does not measure, they track metrics that predict field behavior, and they treat validation as ongoing rather than a pre-launch checkbox.
Coverage Is Quantity, Not Quality
A suite can execute 90% of the lines while proving almost nothing if it runs the same happy-path inputs over and over. Coverage measures which code ran, not whether the right cases were tried. Test quality comes from deliberate design: boundary-value tests (minimum, maximum, just inside and just outside the limits), equivalence partitioning (one representative from each input class), negative and error-path tests, and error guessing informed by past failures. A high coverage number with no boundary or failure cases is a confidence illusion.
HIL, SIL, and the Bugs Units Cannot See
Some defects only appear with real timing and real I/O. Software-in-the-loop runs the firmware logic against a simulated environment on a host; hardware-in-the-loop runs the actual firmware on the target while sensors and actuators are simulated or stimulated, so the test exercises real interrupts, drivers, and timing. This is where race conditions, uninitialized state, and timing-dependent faults surface. A HIL test that fails intermittently — passing most runs and failing some — is usually not a flaky framework; it is revealing a genuine timing or concurrency bug that unit tests, which run deterministically on a host, were never positioned to find.
Conformance Is Not Interoperability
Two distinct claims are easy to conflate. Conformance testing checks that an implementation follows a specification’s required behavior. Interoperability testing checks that it actually works with other independent implementations of that specification. Both can be necessary: a device can conform to a protocol on paper and still fail to interoperate with a particular peer because of optional features, version differences, or ambiguous corners of the standard. Treat a conformance pass and an interoperability pass as separate evidence.
Tessa’s Field Check
- Bench says: a conformance pass — the implementation follows the specification’s required behavior.
- Field adds: independent peer implementations, optional features, version differences, ambiguous corners of the standard.
- Stamp when: conformance and interoperability each pass, held as separate evidence.

Metrics That Predict the Field
Validation Does Not End at Launch
Lab conditions — stable power, clean RF, a perfect network — do not represent the field, so systems validated only in the lab routinely fail once deployed. Field and beta validation at representative sites, with real network conditions and real user behavior, belongs as a mandatory gate before production. Soak testing runs the system continuously for long periods to expose slow leaks, memory growth, and drift. Regression testing re-runs prior tests after every change so a fix in one place does not silently break another. Reserve the lab for reproducible regression; use the field for real-world acceptance, and keep validating as conditions change.
Tessa’s Field Check
- Bench says: stable power, clean RF, a perfect network — reproducible lab regression.
- Field adds: representative sites, real networks, real user behavior, and the slow leaks soak exposes.
- Stamp when: field or beta validation passes as a mandatory gate before production.
Common Pitfalls
- Writing the test plan after development. Plans written afterward describe what was built, not what should have been; write them during requirements and sign them off before coding.
- Confusing coverage with quality. Line coverage with no boundary, negative, or error cases proves little; design the cases, do not just chase the number.
- Validating only in the lab. Controlled conditions hide the field variability that causes real failures; make field validation a gate.
- Ignoring flaky tests. An intermittent failure is usually a real timing or concurrency bug, not noise to retry away.
- Letting test plans rot. Requirements drift; tests for removed features pass meaninglessly while new behavior goes untested unless plans are owned and updated.
Under-the-Hood Knowledge Check
At this depth, testing and validation is a discipline of evidence: levels chosen and scheduled deliberately, coverage spent where failure hurts, quality designed rather than counted, and validation that follows the device into the field. A trustworthy review asks which level produced each result, what the coverage did not exercise, and whether the system was proven in the conditions where it will actually run.
7.5 Summary
- Verification confirms the system was built correctly against its specification; validation confirms the built system solves the real problem in real conditions. Both are required.
- IoT raises the stakes because devices deploy-and-forget: they run for years in harsh, intermittently connected conditions and may never be updatable, so defects must be caught before shipping.
- Shift-left testing reflects the rule of thumb that defects grow roughly an order of magnitude more expensive at each later stage.
- The test levels are unit, integration, system (end-to-end), and acceptance, surrounded by specialized IoT levels: hardware-in-the-loop, environmental, security, and field or soak testing.
- The testing pyramid distributes effort by speed and cost: many fast unit tests, fewer integration tests, and a small set of slow end-to-end tests; treat the percentages as a target, not a law.
- Schedule tests by cadence (commit, pull request, nightly, weekly, pre-release) and budget coverage by the impact of failure rather than by a single global average.
- Coverage measures quantity, not quality; test design needs boundary values, equivalence partitions, and negative and error-path cases.
- Conformance testing (follows the spec) is distinct from interoperability testing (works with other implementations); track metrics that predict field behavior, and keep validating in the field after launch.
Testing proves you built the system right; validation proves you built the right system, and for IoT both must hold before a device leaves your hands because the field rarely gives you a second chance. Choose test levels deliberately, balance them with the pyramid, spend coverage where failure hurts, design for quality rather than counting lines, and keep validating in the conditions where the device will actually live. If it is not tested, it is broken; you just do not know it yet.
7.6 See Also
Testing Fundamentals
Go deeper on why IoT testing is different and how the testing pyramid balances cost and confidence.
Integration Testing
Test the interface contracts between firmware, cloud, and app where data-format mismatches hide.
Hardware-in-the-Loop Testing
Automate firmware validation against simulated sensors to surface timing and concurrency bugs.
CI/CD Fundamentals for IoT
Wire the levels into pipelines and device farms so the right tests run at the right cadence.