15 Smart Grid: Communications and Operations
15.1 Start With the Story
A utility can see a growing number of meters, substations, chargers, and flexible loads, but those devices do not share one timing or reliability need. The design team must decide which communications fit each job, then operate the grid without treating every measurement or promised load shift as equally dependable.
15.2 Overview
This route connects communication requirements and standards to EV charging, transformer loading, voltage control, investment, cyber risk, and recovery evidence.
This is part 2 of 2. Review Smart Grid: Measurement and Architecture when you need the first route.
15.3 Learning Objectives
By the end of this chapter, you will be able to:
- match smart-grid communication requirements to standards and duties
- evaluate flexible-load and transformer impacts with stated limits
- plan grid investment, cyber boundaries, and recovery evidence
15.4 Chapter Roadmap
Follow the original sections below in order. They begin at the reviewed split boundary and keep every worked example, figure, check, and supporting banner with the section that owns it.
15.5 Smart Grid Communication Requirements
Different smart grid applications have vastly different communication needs:
- Distribution network monitoring: fiber, cellular, or mesh paths using DNP3 or IEC 61850; 100-300 kbps, 2-15 second latency, and roughly 99.9% reliability.
- Advanced Metering Infrastructure: RF mesh, PLC, or cellular paths using Zigbee, LoRaWAN, or LTE-M; 10-100 kbps, hours-tolerant latency for many reads, and roughly 95% reliability.
- Demand response: internet or cellular paths using OpenADR or MQTT; 1-50 kbps, minutes-to-hours latency, and roughly 99% reliability.
- Electric vehicle charging: ISO 15118 may handle EV-to-charger communication; OCPP may handle charger-to-management-system communication over Ethernet, Wi-Fi or cellular. Bandwidth, response time and reliability targets must be set for each link and use case.
- Wide-area situational awareness: fiber or dedicated networks carrying synchrophasor data such as IEEE C37.118; 100-1000 kbps, 2-15 second operational latency, and roughly 99.99% reliability.
15.6 Critical Standards Ecosystem
The smart grid relies on a layered ecosystem of communication protocols, each designed for specific grid functions:
Figure 15.1 answers a question a flat list of protocol names cannot: which job each standard was actually built to do.
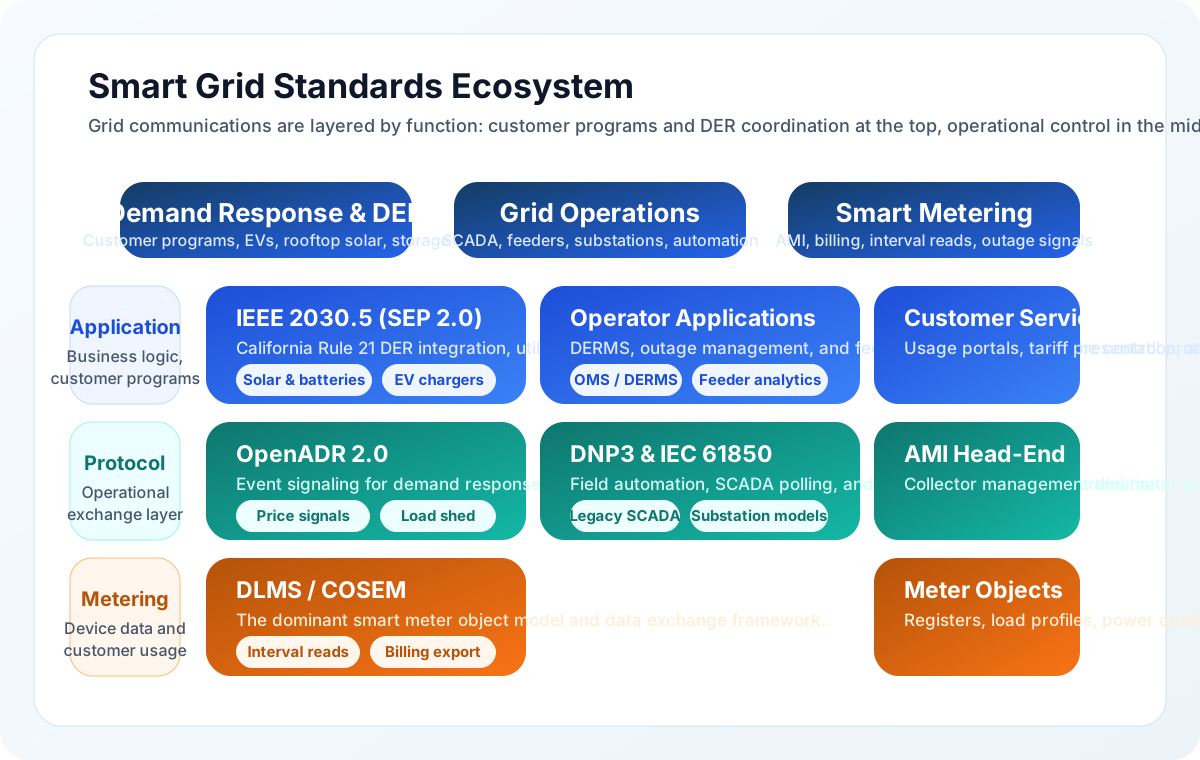
Figure 15.1 is a grid, so read a column first and then a row. The columns are three different jobs: customer programmes for solar, storage and electric vehicles; operating the network itself; and metering for billing and outages. The rows separate the business application from the protocol that carries control, and from the device data underneath. Once both are fixed, each standard has one place to sit. IEEE 2030.5 and OpenADR land in the customer column because they signal events and prices. DNP3 and IEC 61850 land in operations because they carry substation control. DLMS and COSEM land in metering because they define what a register means. A protocol argument is often a column argument in disguise.
Communication Protocols:
- IEEE 2030.5 (SEP 2.0): application-layer smart energy profile for demand response and DER integration, mandated in California Rule 21 contexts.
- OpenADR 2.0: application-layer automated demand response signaling, with thousands of deployments globally.
- DNP3: protocol-layer distribution automation and SCADA standard, widely used by US utilities.
- IEC 61850: power-utility automation standard covering device/data models and communication mappings, widely used for substation automation and protection.
- DLMS/COSEM: metering-layer smart meter data exchange standard used by hundreds of millions of meters.
15.7 Comm Standards Check
Question 4: A utility needs to send demand response signals to residential customers. Which protocol is designed specifically for this?
a) DNP3 b) IEC 61850 c) OpenADR 2.0 d) Modbus TCP
Answer c) OpenADR 2.0
OpenADR (Open Automated Demand Response) 2.0 is specifically designed for automated demand response signaling between utilities and customer equipment. It has 5,000+ deployments globally. DNP3 is for distribution automation/SCADA, IEC 61850 is for substation automation, and Modbus is for industrial control systems.
Question 5: Smart meters typically use which communication technology for neighborhood-level data collection?
a) Fiber optic direct connection b) RF mesh networks (Zigbee, LoRaWAN) c) Satellite uplink d) Power line communication only
Answer b) RF mesh networks (Zigbee, LoRaWAN)
Advanced Metering Infrastructure (AMI) typically uses RF mesh networks where meters communicate with each other and relay data to collector nodes. Zigbee and proprietary RF mesh (like Silver Spring Networks) are common, with LoRaWAN and LTE-M used in rural areas. PLC (power line communication) is used in some deployments but RF mesh dominates in North America.
 Checkpoint: Visibility and Communications
You now know:
- WAMS depends on PMUs sampling 30-60 times per second, while traditional SCADA may poll every 2-4 seconds.
- Smart meters usually report 15-minute interval data and outage notifications through RF mesh, PLC, or cellular AMI paths.
- Protocol choice follows the job: OpenADR for demand response, DNP3 for distribution automation and SCADA, IEC 61850 for substations, and DLMS/COSEM for metering exchange.
15.8 EV Charging and Grid Integration
With the measurement stack in place, the next stress test is load flexibility. EVs show why a grid-IoT system must coordinate customers, devices, tariffs, and transformer limits at the same time.
Electric vehicle charging represents both a challenge and opportunity for smart grids:
Challenge: A single Level 2 EV charger (7.2 kW) can double a home’s peak demand. A neighborhood with 20% EV adoption could overload distribution transformers designed for pre-EV loads.
Opportunity: Smart chargers can defer charging to off-peak hours, participate in demand response programs, and even provide vehicle-to-grid (V2G) services that return stored energy during peak demand.
Figure 15.2 shows the physical half of the smart-charging story that the scheduling logic sits on top of.

Almost everything visible in Figure 15.2 is about the physical contract rather than the software. The cable is heavy and long, and where it coils decides whether the unit can serve a car parked either way round. The holster in the middle keeps the connector off the ground, and the lit ring around it is the only status the owner sees without opening an app. Behind the case sits a fixed connection to a dedicated circuit, and that is the part which adds 7.2 kW to the house. Smart charging and vehicle-to-grid only become interesting once the installation is safe, correctly sized, and convenient enough that the driver plugs in.
Inspect Figure 15.3 to compare the household peak created by unmanaged charging with the two ways coordinated vehicles can help the grid.
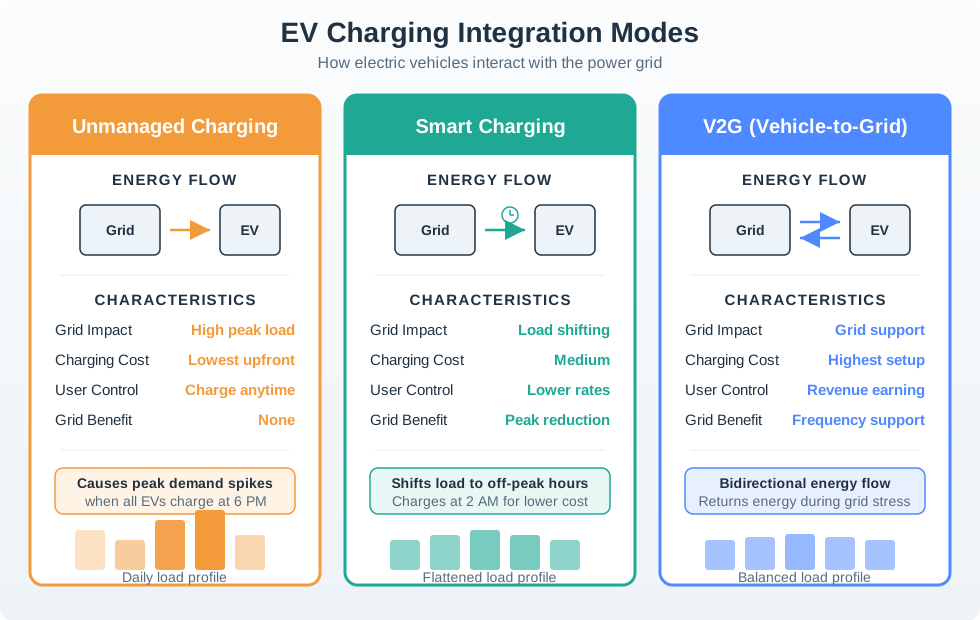
Begin Figure 15.3 with the 12 kW household peak and add the 7.2 kW Level 2 charger: 12 kW + 7.2 kW = 19.2 kW, a 60% increase during an already stressed period. Smart charging moves that demand into the 10 p.m.–6 a.m. window or defers it when the grid is constrained. Vehicle-to-grid goes further by returning stored energy during a stress event. The figure turns an EV from an unmanaged new load into a schedulable resource, provided mobility needs and battery limits remain protected.
15.9 EV Charging Household Demand
Scenario: A suburban household with 200A service evaluates adding a Level 2 EV charger.
Given:
- Current peak demand: 12 kW (air conditioning + appliances)
- Level 2 charger: 7.2 kW (240V, 30A charging draw on a dedicated 40A circuit)
- Daily EV charging need: 30 miles @ 4 miles/kWh = 7.5 kWh
- Electricity rate: $0.12/kWh (flat rate)
- Time-of-use rate: $0.08/kWh (off-peak 10 PM - 6 AM), $0.18/kWh (peak 4-9 PM)
Steps:
-
Calculate new peak demand if charging during peak hours:
- Existing peak: 12 kW (5 PM on hot summer day)
- EV charging: 7.2 kW
- New peak: 19.2 kW (60% increase!)
-
Evaluate transformer impact:
- Typical 25 kVA residential transformer serves 5 homes
- If all five 12 kW household peaks coincide: 5 homes x 12 kW = 60 kW, at least 2.4x a 25 kVA transformer rating at unity power factor; this is an overload condition, not normal loading.
- With 1 EV charging at the same time: 60 + 7.2 = 67.2 kW, at least 2.7x rating.
- With 3 EVs charging at the same time: 60 + 21.6 = 81.6 kW, at least 3.3x rating. Actual transformer impact needs coincident measured demand and power factor.
-
Calculate savings from smart charging:
- Flat rate: 7.5 kWh x $0.12 = $0.90/day
- Peak charging: 7.5 kWh x $0.18 = $1.35/day
- Off-peak charging: 7.5 kWh x $0.08 = $0.60/day
- Annual savings (off-peak vs peak): ($1.35 - $0.60) x 365 = $274/year
-
Demand response participation:
- Utility offers $50/year for EV charging flexibility
- Smart charger defers charging when grid is stressed
- Total incentive: $50 + $274 = $324/year for smart charging
Result: Smart EV charging saves $324/year compared to unmanaged peak charging while preventing neighborhood transformer overloads. Multiply by 20 million EVs expected by 2030 and smart charging becomes essential grid infrastructure.
Key Insight: EV charging is the largest controllable residential load - a 7.2 kW charger dwarfs other appliances. This makes EVs ideal for demand response, but unmanaged charging could require billions in grid upgrades.
15.10 EV Charging Economics
Compare charging costs under different rate structures:
15.11 Knowledge Check: Smart Grid Fundamentals
Question 1: What is the primary advantage of Phasor Measurement Units (PMUs) over traditional SCADA systems?
a) Lower cost per unit b) Easier installation c) GPS-synchronized sampling at 30-60 times/second (vs 1 sample every 2-4 seconds) d) No network connectivity required
Answer c) GPS-synchronized sampling at 30-60 times/second
PMUs provide 60-120x faster sampling than SCADA, enabling detection of grid instabilities in milliseconds rather than hours. The GPS synchronization allows phase angle comparison across distant locations, which is critical for preventing cascading failures like the 2003 Northeast blackout.
Question 2: A neighborhood of 5 homes shares a 25 kVA transformer. If 3 homes add Level 2 EV chargers (7.2 kW each), what happens to transformer loading?
a) Loading stays within normal limits b) Loading increases marginally but remains safe c) Loading increases from 2.4x to 3.3x rating (overload risk) d) The transformer immediately fails
Answer c) Loading increases from 2.4x to 3.3x rating (overload risk)
If all five 12 kW household peaks coincide, pre-EV demand is at least 2.4 times a 25 kVA rating at unity power factor. Three simultaneous 7.2 kW chargers raise this worst case to at least 3.3 times. Actual loading needs coincident demand and power factor; smart charging can shift demand when measured loading requires it.
Checkpoint: Flexible Loads
You now know:
- A single Level 2 EV charger adds 7.2 kW, enough to double some household peaks.
- Three simultaneous 7.2 kW chargers on the five-home example raise worst-case loading from at least 2.4x to at least 3.3x a 25 kVA rating at unity power factor; actual loading depends on coincidence and power factor.
- Smart charging can shift a 7.5 kWh daily need to off-peak hours and combine $274/year tariff savings with a $50/year flexibility incentive.
15.12 Transformer Loading Analysis
Evaluate transformer capacity with EV adoption:
Question 3: Which standard is mandated in California for smart energy devices to communicate with utilities?
a) DNP3 b) IEEE 2030.5 (SEP 2.0) c) Modbus d) BACnet
Answer b) IEEE 2030.5 (SEP 2.0)
IEEE 2030.5 (Smart Energy Profile 2.0) is mandated by California Rule 21 for DER (Distributed Energy Resource) integration. It provides standardized communication for demand response, solar inverters, EV chargers, and battery storage. DNP3 is the legacy protocol for distribution automation (80%+ of US utilities), while IEC 61850 is for substation automation.
15.13 Voltage/VAR Optimization (VVO)
After flexible load, move to grid-side optimization. VVO is the same evidence loop in another form: measure voltage, choose a safe setting, actuate equipment, and verify the result.
IoT enables real-time voltage optimization that reduces energy consumption while maintaining power quality:
Inspect Figure 15.4 to follow how measured feeder voltage becomes a controlled setting and then a verified energy result.
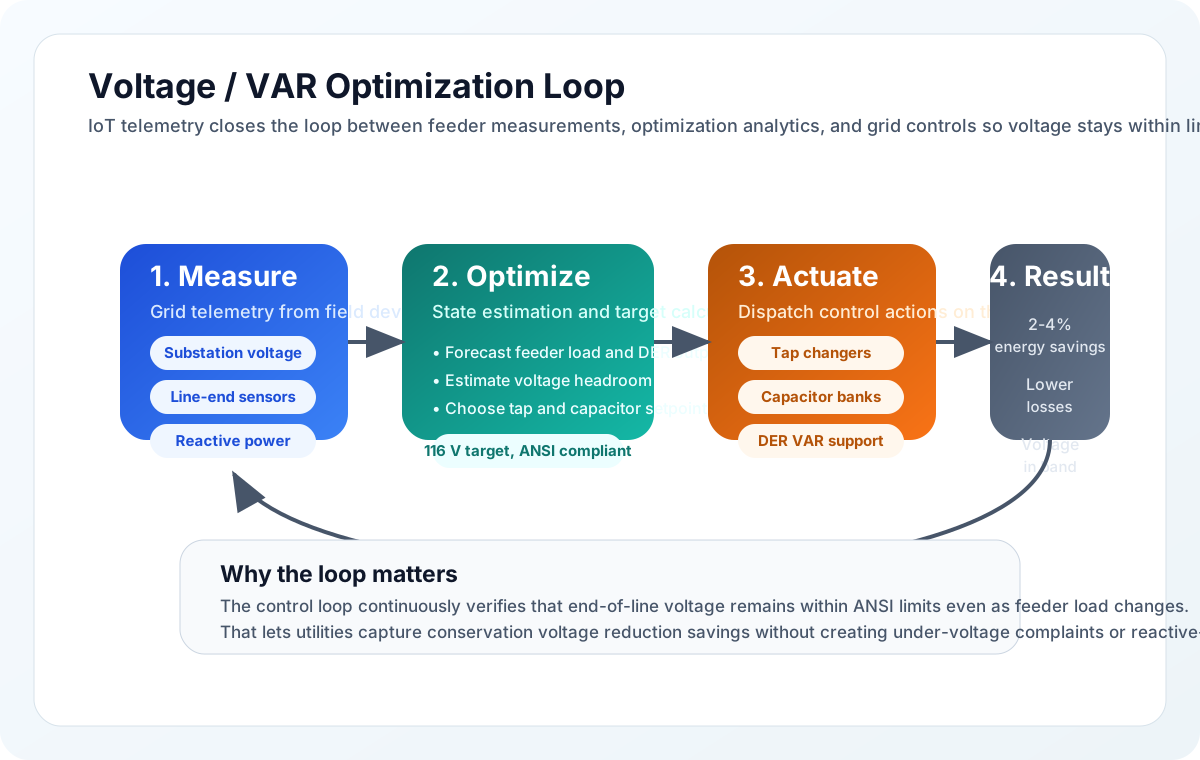
Read Figure 15.4 from substation and end-of-line voltage measurements into the optimizer, which chooses a safe feeder setting. Transformer taps change voltage and capacitor banks manage reactive power before the result is measured again. In the chapter example, reducing 120 V to 116 V gives (120 − 116) ÷ 120 × 100 = 3.3% voltage reduction. The setting remains within the stated standard, and resistive loads may use 2–4% less energy. Verification closes the loop: savings count only while power quality and equipment performance remain acceptable.
How VVO Works:
- Sensors measure voltage at substations, capacitor banks, and end-of-line locations
- Analytics calculate optimal voltage reduction that saves energy without affecting equipment
- Control adjusts transformer tap settings and capacitor switching in real-time
- Result: 2-4% energy savings across the distribution system
Conservation Voltage Reduction (CVR): By reducing voltage from 120V to 116V (within ANSI standards), utilities can reduce energy consumption. Most resistive loads (heating, incandescent lighting) consume less power at lower voltage without affecting performance.
Typical VVO Deployment:
- Investment: $500K-2M for utility-wide implementation
- Savings: 2-4% of distribution losses
- Payback: 3-5 years
- Co-benefits: Extended equipment life, reduced peak demand
15.14 Voltage/VAR Optimization Check
Question 9: Conservation Voltage Reduction (CVR) reduces residential voltage from 120V to what level while remaining within ANSI standards?
a) 100V b) 108V c) 116V d) 119V
Answer c) 116V
CVR reduces voltage from 120V to 116V, which remains within ANSI C84.1 standards (acceptable range 114-126V for service entrance). This 3.3% voltage reduction can yield 2-4% energy savings for resistive loads (heating, incandescent lighting) that consume less power at lower voltage without affecting performance.
Question 10: What is the primary function of capacitor bank switching in VVO systems?
a) Increase power consumption b) Manage reactive power (VARs) to optimize voltage levels c) Generate electricity during peak demand d) Store energy for later use
Answer b) Manage reactive power (VARs) to optimize voltage levels
Capacitor banks supply capacitive reactive power (VARs - Volt-Ampere Reactive) to maintain voltage within acceptable ranges. By automatically switching capacitors on/off based on real-time sensor data, VVO systems can flatten voltage profiles across distribution feeders, enabling CVR while ensuring end-of-line customers receive adequate voltage. This differs from energy storage which stores real power (watts).
15.15 Implementation Roadmap
Year 1: Foundation
- Deploy AMI to 25% of service territory
- Implement MDMS and integration with billing
- Establish cybersecurity baseline (CIP compliance)
- Pilot demand response with 1,000 customers
- Cost: $50-100M for mid-sized utility (500K customers)
Year 2-3: Expansion
- Complete AMI deployment (100% coverage)
- Deploy Distribution Automation to 50% of circuits
- Implement DERMS for solar/storage integration
- Launch time-of-use rates and dynamic pricing
- Cost: Additional $75-150M
Year 4-5: Optimization
- Advanced analytics for predictive maintenance
- Grid-edge computing for real-time control
- Vehicle-to-grid (V2G) pilot programs
- Transactive energy pilots
- Cost: Additional $25-50M
15.16 Business Case Considerations
Typical Smart Grid Investment Returns:
- AMI deployment: USD 150-300 per meter, typically yielding 2-4% operating cost reduction with a 5-8 year payback.
- Distribution automation: USD 2-5M per circuit, typically improving reliability by 15-30% with an 8-12 year payback.
- Volt/VAR Optimization: USD 500K-2M system-wide, typically saving 2-4% energy with a 3-5 year payback.
- Demand response: USD 50-200 per customer, typically reducing peak demand by 5-15% with a 2-4 year payback.
- DERMS: USD 2-10M depending on scale, often required to enable high renewable penetration rather than justified by a simple payback.
15.17 Critical Infrastructure Cyber
Smart grid IoT systems support critical infrastructure, but NERC CIP standards apply to specified Bulk Electric System cyber systems and responsible entities, not every grid IoT device. A successful cyberattack could cascade into widespread blackouts affecting hospitals, water treatment, financial systems, and emergency services.
Inspect Figure 15.5 to connect compliance duties with layered controls and the recovery problem revealed by a real grid attack.
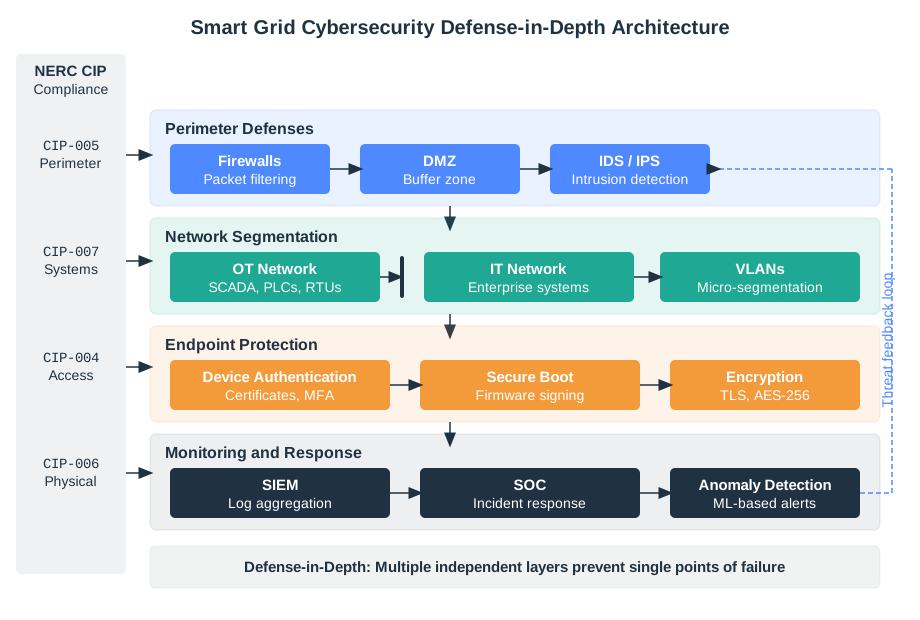
Follow one command into the grid. Trace its proof back. Begin Figure 15.5 with asset identification, because controls cannot protect critical cyber assets that the operator has not classified correctly. The layers then move through policy, training, electronic boundaries, and system security rather than relying on one perimeter device. NERC CIP provides a compliance floor for assets and entities within its defined scope. The Ukraine 2015 evidence shows why recovery also belongs in the design: remote compromise affected about 230,000 customers for up to six hours, and restoration required manual intervention. Defense in depth must therefore preserve a trusted way to operate when remote systems fail.
Real-World Attack: Ukraine 2015
On December 23, 2015, attackers remotely accessed Ukrainian power distribution companies, opened breakers, and caused blackouts affecting 230,000 customers for up to 6 hours. The attack demonstrated that:
- Remote access to grid SCADA systems enables physical damage
- Attackers can coordinate actions across multiple substations simultaneously
- Recovery requires manual intervention when remote systems are compromised
NERC CIP Compliance Requirements:
- CIP-002: asset identification so critical cyber assets are classified correctly.
- CIP-003: security management through policies, procedures, and training.
- CIP-005: electronic security through perimeter protection and access control.
- CIP-006: physical security for protected access to cyber assets.
- CIP-007: systems security, including ports, patches, and malware prevention.
- CIP-010: configuration management through baselines and change control.
Checkpoint: Investment and Cyber Risk
You now know:
- VVO lowers 120V service toward 116V within ANSI limits and can produce 2-4% energy savings.
- Typical smart-grid investments have different payback shapes: AMI is USD 150-300 per meter with a 5-8 year payback, while VVO often pays back in 3-5 years.
- Cybersecurity is operational: the 2015 Ukraine attack affected 230,000 customers for up to 6 hours, and NERC CIP covers asset identification, access, physical security, systems security, and configuration management.
15.18 Grid Business Case Check
Question 6: What is the typical payback period for AMI (Advanced Metering Infrastructure) deployment?
a) 1-2 years b) 5-8 years c) 15-20 years d) AMI never pays back
Answer b) 5-8 years
AMI deployment costs $150-300/meter but delivers 2-4% operating cost reduction through eliminated manual meter reads, faster outage detection, theft reduction, and enabled time-of-use pricing. The 5-8 year payback is typical for mid-sized utilities, with benefits accelerating as more smart grid applications leverage the AMI infrastructure.
Question 7: Voltage/VAR Optimization (VVO) can reduce distribution system energy losses by:
a) 0.1-0.5% b) 2-4% c) 15-20% d) 50%+
Answer b) 2-4%
VVO uses real-time sensor data and automated controls to reduce voltage levels and optimize reactive power flow. By reducing voltage from 120V to 116V (within ANSI standards), resistive loads consume less energy without affecting performance. With typical investment of $500K-2M, VVO achieves 3-5 year payback.
Question 8: Why is cybersecurity (NERC CIP compliance) especially critical for smart grid IoT?
a) Regulatory agencies require paperwork b) The grid is designated critical infrastructure; attacks could cause widespread blackouts c) Insurance companies demand it d) Customers expect security
Answer b) The grid supports critical infrastructure; attacks could cause widespread blackouts
The 2015 Ukraine grid attack demonstrated that cyber attackers can cause real-world power outages affecting hundreds of thousands of people. NERC CIP (Critical Infrastructure Protection) standards mandate specific cybersecurity controls for responsible entities and systems within their defined scope. Unlike most IoT systems, a smart grid breach could disrupt hospitals, water treatment, financial systems, and emergency services simultaneously.
15.19 Meters vs Load Control
The Error: Many utilities deploy smart meters (AMI) expecting immediate demand response and load management capabilities without implementing DERMS (Distributed Energy Resource Management Systems) or customer-facing programs.
Why It Happens: Smart meters provide visibility (usage data), but they do NOT control appliances directly. A meter reporting high peak usage has zero impact unless paired with time-of-use rates, demand response programs, or smart thermostats that react to price signals.
Real Example: A mid-sized utility spent $80M deploying AMI to 500K customers expecting 10% peak demand reduction. After 2 years, peak demand had dropped only 0.8% because they never launched time-of-use rates or DR programs. The meters collected data no one acted on.
The Fix: Smart meter deployment MUST be paired with:
- Time-of-use (TOU) or dynamic pricing to create customer incentives
- DERMS integration for managing solar, storage, EV chargers
- Customer engagement campaigns explaining how to respond to price signals
- Pilot DR programs with incentives ($50-100/year per participant)
Key Insight: AMI enables some demand-response designs but is not a prerequisite: direct load control and other demand-response programs can operate without it. The meter is one useful sensor; pricing and DR programs are the actuators.
15.21 Concept Check: PMUs vs SCADA
15.22 See Also
Cross-domain connections with smart grid IoT:
- Smart Home and Building Automation - Demand response programs and residential energy management
- Transportation and Connected Vehicles - EV charging infrastructure and vehicle-to-grid (V2G) integration
- Edge and Fog Computing - Substation automation and real-time grid control require edge processing
15.23 Quiz: Smart Grid Concepts
15.24 Interactive Quiz: Sequence the Steps
15.25 Smart Grid, HEMS, and Stakeholder Boundaries
A smart grid makes electrical power and operational information flow in both directions. A smart meter can measure imports and exports, but a home energy management system (HEMS) is the local decision boundary that combines meter data, tariffs, appliance constraints, rooftop generation, storage state, and occupant consent. It may recommend or schedule a flexible load; it must not pretend that every appliance, battery, vehicle, or resident is equally controllable.
| Stakeholder | Decision owned | Evidence that crosses the boundary |
|---|---|---|
| Occupant or building operator | Comfort, opt-out, appliance deadline, local safety | Consent state, constraint, override, and outcome |
| Supplier or aggregator | Tariff or flexibility offer | Price interval, event window, accepted quantity, and settlement record |
| Distribution operator | Voltage, loading, outage restoration, DER visibility | Feeder state, dispatch limit, acknowledgement, and recovery status |
| Metering party | Import/export measurement and billing-quality interval data | Timestamp, quality flag, tamper state, and correction history |
| DER/storage/EV controller | Safe local charge, discharge, curtailment, or export | State of charge, device limit, command result, and fallback |
| IoT/cloud service | Forecasting, coordination, notification, and audit support | Data purpose, access decision, model/version, latency, and retained record |
The NIST conceptual model is useful because it keeps customer, distribution, operations, markets, transmission, and distributed-energy-resource domains distinct. A cloud service may coordinate across those domains, but it does not inherit the authority or safety responsibility of the field controller.
15.26 Grid Operations and Trust Drill
PMUs provide time-synchronised phasor observations at high reporting rates; SCADA collects wider supervisory measurements and carries operator control through established operational boundaries. Distribution intelligence, EV charging, demand response, and cloud analytics add more observations and decisions, but none should bypass protection, local interlocks, or an authorised operator workflow.
Trace one event end to end: field measurement -> time/quality validation -> substation or distribution system -> authorised operations decision -> bounded field command -> device acknowledgement -> service outcome. Then inject one bad value or missing message. A false-data-injection defence needs more than an unusual-number alert: compare independent measurements or a physical model, preserve the raw and corrected values, constrain automated action, name the reviewer, and prove recovery to a known state. Privacy review should separately minimise fine-grained household data, limit purpose and retention, and record who can link an energy trace to a person or address.
A trustworthy drill records the last known-good configuration, affected measurements and commands, local protection state, revoked or isolated access, operator decision, restoration sequence, reconciliation of buffered cloud data, and the condition that permits normal automation to resume.
15.27 Home Energy Scheduling Lab
Use the model to schedule a flexible appliance and battery against one time-of-use peak. The must-run load and appliance deadline remain constraints; local generation is used before export; net-metering credit is not assumed to equal the retail tariff.
Common Pitfalls
15.28 Smart Meter Tamper Detection
Smart meters without cryptographic tamper detection can be compromised to under-report consumption, resulting in revenue loss estimated at 1-3% of billed energy. Implement device attestation, encrypted meter-to-head-end communication, and anomaly detection flagging statistically improbable consumption patterns.
15.29 Do Not Overstate DER Flexibility
Assuming all enrolled distributed energy resources will respond on demand ignores equipment failures and communication outages. Committing overstated flexibility creates reliability violations. Apply statistical availability models (typically 85-90% realisation rates) and maintain reserves to cover non-delivery.
15.30 Demand Response Opt-Out
Utilities that enrol customers without providing easy opt-out and transparent price signals face regulatory penalties and customer churn. Implement opt-in with clear benefit communication, real-time price visibility, and one-tap opt-out in the customer app.
15.31 Label the Diagram
15.32 Code Challenge
15.33 Summary
Smart grid IoT transforms the electrical grid from a passive distribution network into an intelligent, bidirectional energy system:
- Wide Area Monitoring Systems (WAMS) use PMUs to detect grid instabilities in milliseconds
- Smart meters enable real-time visibility, demand response, and time-of-use pricing
- EV charging integration presents both challenges (demand surge) and opportunities (flexible load)
- Voltage optimization can reduce energy consumption by 2-4% with modest investment
- Cybersecurity (NERC CIP compliance) is essential given the critical infrastructure nature
15.34 In 60 Seconds
Energy IoT instruments generation, distribution, and consumption to enable demand response, fault detection, and dynamic pricing that improve grid reliability and reduce peak load by 10-20% through coordinated smart meter and DER management.
The fragmented ownership structure (3,000+ utilities) makes standards adoption slow but essential for interoperability.
15.35 Knowledge Check
15.36 Quiz: Smart Grid IoT
15.37 What’s Next
- Smart Agriculture: remote, battery-powered sensor deployments for precision farming.
- Smart Manufacturing: industrial energy management and predictive maintenance.
- Smart Home: residential energy optimization and demand response integration.
15.38 Key Takeaway
Smart grid IoT balances sensing, control, reliability, cybersecurity, and customer trust. A grid device must support operational decisions without creating unsafe remote-control paths or brittle dependencies.