14 Smart Grid: Measurement and Architecture
More
Depth: Practitioner
Progress saves as you read. Mark sections complete as you go; your progress appears in the sidebar.
- Podcast audio coming soon
- Character narration audio coming soon
14.1 Follow One Grid Decision
A smart grid adds two-way communication and sensing to the electrical network. Measurements help operators balance demand, distributed generation, faults, and customer devices. Electricity can flow from plants toward customers and back from rooftop solar; information must travel both ways too. Each meter, relay, inverter, and forecast must support a safer, cleaner, and more reliable decision.
Picture a hot evening when homes use more power and rooftop panels begin to fade. A local line is near its safe limit. A control-room team must decide whether to change voltage, shift demand, or send a field crew. Begin with the physical claim: name the line, meter, switch, or inverter, what it measures, how often, in which unit, and how old the fact may be. Mark where a reading becomes a forecast or a control request.
Check identity, time, unit, quality, and software version at each hand-off. A number without a known source can move the wrong device. An old state can look safe while load is rising. Show age and doubt beside the result.
The traditional grid is often pictured as a one-way street from power plants through transmission and distribution to homes. Monthly manual readings give little visibility into a home’s current use, an air conditioner starting, or a neighborhood transformer approaching its limit. In the smart-grid picture, meters can report every 15 minutes, grid sensors expose voltage problems before equipment fails, rooftop panels export surplus power, and wind farms coordinate with batteries to smooth supply fluctuations. Think of a water-slide system whose lifeguards can now see conditions along the route: monitoring helps them respond, but does not itself control the flow.
Faster reporting serves different jobs. A meter interval is useful for billing and demand patterns; a transmission sensor reporting 60 times per second supports a different decision. These are example settings: 15-minute meter intervals, 30–60-per-second phasor reports, and a 7.2 kW electric-vehicle charger are design values, not universal device settings. Smart meters enable time-of-use pricing, outage detection, and participation in demand response. Unmanaged EV charging can overload neighborhood transformers; smart chargers can shift demand off peak and, where supported, return energy to the grid through vehicle-to-grid (V2G) operation.
The scale of the opportunity needs care. US transmission and distribution losses averaged about 5% in 2018–2022, according to the EIA. With an illustrative $400 billion annual electricity bill, 5% equals $20 billion. That arithmetic is not an estimate of recoverable losses. Monitoring and voltage control can reduce avoidable losses and improve awareness of conditions that may lead to cascading outages such as the 2003 Northeast blackout.
The operating problem is to turn observations into trustworthy evidence without confusing a bill, a dashboard hint, and an instruction to move equipment. A dashboard hint may wait for review; urgent protection needs a fixed local response when the wider link is gone. We will first separate those responsibilities, map devices to utility systems, then examine voltage-reduction value, the four grid layers, synchronized monitoring, and household meter data. Standards including Institute of Electrical and Electronics Engineers (IEEE) 2030.5, OpenADR, DNP3, and International Electrotechnical Commission (IEC) 61850 fit into that responsibility map. Communications and operations continue in part 2.
KEY CONCEPTS
- Advanced Metering Infrastructure (AMI)
A two-way smart-meter network enables remote reading, household outage detection, and time-of-use pricing.
- Demand Response (DR)
A utility programme pays customers to reduce consumption during grid stress, coordinated through IoT signals.
- Distributed Energy Resource (DER)
Customer-sited solar or batteries can provide flexibility during peak demand under grid-operator coordination.
- Fault Location, Isolation, and Service Restoration (FLISR)
Automated switching can restore power in seconds rather than hours after a distribution fault.
- Time-of-Use (TOU) Pricing
Higher peak-hour rates encourage customers to shift loads to off-peak periods.
- Voltage/VAR Optimisation (VVO)
Automated voltage and reactive-power control reduces line losses and improves power quality.
- SCADA/EMS
An Energy Management System overlays supervisory control and data acquisition to optimise generation dispatch and load balancing in real time.
14.2 Learning Objectives
By the end of this chapter, you will be able to:
- Explain the four-layer smart grid architecture (generation, transmission, distribution, consumption)
- Describe Wide Area Monitoring Systems (WAMS) and Phasor Measurement Units (PMUs)
- Compare smart meter capabilities with traditional metering
- Analyze demand response mechanisms and grid communication requirements
- Distinguish among smart grid standards (IEEE 2030.5, OpenADR, DNP3, IEC 61850) and their roles
14.3 Grid Measurement and Control
Return to the hot-evening decision and start with the control boundary. Smart-grid devices only help when each reading or command has a clear operating consequence.
Smart-grid IoT differs from ordinary telemetry because many readings can affect critical infrastructure decisions: switch a feeder, dispatch a battery, shed load, adjust voltage, confirm an outage, or settle a tariff. The system must protect people, equipment, customer trust, and grid stability while still giving operators better visibility. Treat every signal as part of a power-system operating decision, not just as a dashboard value.
Figure 1 answers the question this section opens with: which grid signals only inform, and which ones can change how the network behaves?
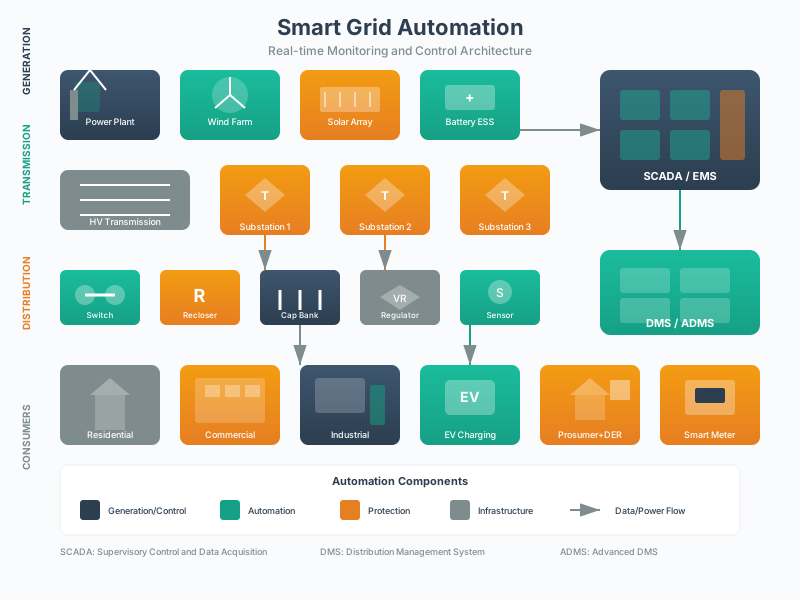
Read Figure 1 in two passes. The first pass goes down the left column, from generation through transmission and distribution to the customer, and shows that every domain pairs field equipment with an operating system that owns it. The second pass matters more here. The lower band splits the same traffic along a control boundary. On one side sit observations: a 15-minute meter read for billing, a fast PMU stream for wide-area awareness. On the other sit actions that move the grid, such as a recloser operation or a demand-response dispatch. Stronger control validation, authorization, and fallback are attached to that second group, which is why a dashboard value and a switching command cannot share one path.
Starting with Figure 1, separate measurement, advice, and control. A smart meter interval read supports billing and outage awareness. A PMU stream supports wide-area situational awareness. A DER command, capacitor-bank setting, recloser operation, or demand-response dispatch can change grid behavior and therefore needs stronger validation, authorization, and fallback. This separation keeps billing data, operational telemetry, market signals, and safety-critical switching from being treated as the same kind of event.
The practical goal is not to make the grid fully automatic. It is to give the right actor enough trusted context to act at the right speed. A customer portal can show usage and rate choices. An outage management system can group meter last-gasp messages into likely fault zones. A distribution management system can propose switching steps. A DERMS can coordinate batteries and inverters within export limits. A protection relay must still trip locally when safety requires it, without waiting for a cloud platform.
- Measurement question: what electrical quantity, timestamp, asset id, phase, feeder, customer, or DER is represented?
- Control question: is the event informational, advisory, operator-approved, automated, or safety interlocked?
- Reliability question: what happens if the device, network, clock, forecast, or upstream platform is wrong or unavailable?
A good smart-grid design can explain customer impact in plain terms. A meter read may affect a bill. A demand-response event may change a thermostat or charger schedule. A voltage-control action may reduce losses but must stay inside service limits. A feeder automation action may restore most customers while isolating a faulted section for crews. These outcomes make consent, auditability, timing, and fallback part of the product requirement.
14.4 Map Field Devices to Grid Systems
A smart-grid architecture has to connect field devices to operational and market systems without blurring their roles. Smart meters from vendors such as Itron, Landis+Gyr, Sensus, or Honeywell may feed an AMI head-end and MDMS. Substation IEDs, reclosers, relays, capacitor banks, voltage regulators, and RTUs may communicate with SCADA, DMS, ADMS, OMS, EMS, DERMS, or forecasting tools. Customer and DER programs may use OpenADR, IEEE 2030.5, SunSpec Modbus, OCPP, or utility APIs. Put each integration on a responsibility map before choosing a protocol.
The names identify separate responsibilities. An AMI head-end receives meter traffic; a meter data management system (MDMS) validates and stores readings. Intelligent electronic devices (IEDs) and remote terminal units (RTUs) connect field equipment to supervisory control and data acquisition (SCADA). Distribution management systems (DMS), advanced distribution management systems (ADMS), and outage management systems (OMS) support network operation and restoration. Energy management systems (EMS) support dispatch; distributed energy resource management systems (DERMS) coordinate customer resources. Open Charge Point Protocol (OCPP) appears in the EV charging path. Naming these systems makes it possible to ask which one owns the decision rather than assuming that every integration has authority to act.
For each field-to-system path, record the source of truth, allowed command direction, latency expectation, quality flags, and operator handoff. An AMI outage event should show whether it came from a last-gasp message, periodic read, manual call, or restoration ping. A DER dispatch should show the requested active-power or reactive-power behavior, the inverter capability curve, customer consent, aggregator responsibility, and settlement record. A FLISR step should show the feeder section, protective device state, crew safety constraint, and rollback action.
- For AMI: record meter id, service point, interval length, read source, outage/restoration flag, tamper flag, billing quality, MDMS validation state, and customer opt-out rules.
- For distribution automation: record feeder, phase, switch/recloser id, fault current, voltage, protection state, FLISR step, operator confirmation, and rollback route.
- For DER and EV charging: record inverter id, IEEE 1547 function, export limit, battery state of charge, charger connector, OCPP transaction state, IEEE 2030.5 schedule, and OpenADR event status.
- For synchrophasors and substations: record PMU id, IEEE C37.118 stream quality, GPS/PTP clock state, IEC 61850 logical node, DNP3 or IEC 60870-5-104 mapping, and alarm priority.
Then test the path against realistic operations. Run a table-top outage where meters, OMS, ADMS, mobile crew tools, and customer notifications disagree for several minutes. Run an EV charging event where OCPP chargers, an aggregator API, and a local transformer limit produce competing constraints. Run a DER export-limit event where a communications outage leaves the inverter in its last known mode. The test should prove who sees the problem, who can override, and what evidence remains for after-action review.
Practitioners also need data governance that respects operational separation. Billing-quality meter data belongs in MDMS and customer systems. Fast operational events belong in SCADA, DMS, ADMS, historian, or event-stream platforms with tighter timing and access controls. Forecast and market data can inform decisions, but it should not quietly bypass protection settings or operator clearance rules. The integration contract should name these boundaries explicitly.
14.4.1 Keep Grid Data Inside Its Safety Boundaries
Power-system IoT needs a stricter boundary model than many consumer applications. A lost weather sensor may degrade a dashboard; a bad grid command can damage equipment or create unsafe field conditions. The design should define which systems are allowed to observe, recommend, command, block, and override. The same event may have different meanings in protection, operations, billing, customer support, and regulatory evidence.
- Safety boundary: preserve relay protection, interlocks, switching procedures, crew clearance, lockout/tagout context, and manual operator authority around automated control.
- Timing boundary: define clock source, time-sync quality, latency budget, sampling rate, stale-data behavior, sequence-of-events ordering, and whether cloud paths are allowed for the function.
- Cyber boundary: define device identity, role-based access, signed firmware, remote-access rules, network segmentation, IEC 62351 security where applicable, NERC CIP scope where applicable, and incident response ownership.
- Customer boundary: define billing separation, meter-data privacy, demand-response consent, opt-out handling, rate-plan transparency, and how customer-owned DER commands are logged.
A grid event should carry provenance: a record of its origin and transformations. It should identify the device or system that produced it, the asset and feeder context, the time source, the quality state, the transformation path, and whether it is raw, estimated, validated, operator-confirmed, or settlement-grade. A phasor value without clock quality is not equivalent to a validated SCADA point. A meter read that passed billing validation is not automatically suitable for fast operational control. A forecast can guide dispatch, but it must not be confused with measured capacity.
Command paths need the same discipline. A recloser operation, capacitor-bank change, inverter function update, EV charging limit, and customer demand-response signal have different risk profiles. Some actions should remain local and protection-driven. Some should require operator confirmation. Some may be safe for automated optimisation if they have constraints, rate limits, and rollback. Logs should capture request, authorization, target, previous state, command state, acknowledgement, timeout, failure, and rollback so the control story can be reconstructed.
The strongest grid IoT design can trace one event from sensor or meter through communications, time source, operational system, operator or automation decision, field action, customer impact, and post-event review without treating critical control as just another dashboard update. If the trace cannot explain clock drift, stale AMI reads, compromised remote access, DER aggregator failure, SCADA/ADMS disagreement, customer opt-out, or crew clearance, the design is not ready for critical-infrastructure use.
For the hot-evening line, make these boundaries concrete before approving control.
Run the normal case first. Then lose one meter, delay a group of readings, use a wrong clock, open a switch, and send the same order twice. Record what the field unit did, what the control room saw, and how both views became aligned again.
Protect people as well as equipment. Fine-grained use can reveal daily life. Name why each fact is needed, who may see it, how long it stays, and how a customer can question or correct it. Use less detail when the grid job still works.
Test shared demand. Add electric vehicle charging, a cold evening peak, and local generation at the same time. Measure the busiest path and the slowest safe response. Do not approve the plan from average load alone.
Include field work. A crew needs the right asset, current isolation state, local contact, and safe return step. A remote command must not erase a physical lock or a worker’s control of the site.
Write a decision record with the event, evidence, model or rule, action, owner, result, open doubt, and change that starts a new review. Keep the record through a software change and a replaced field unit.
Review the result with an operator, field worker, customer voice, and safety owner. Each sees a different failure. Resolve any gap that can turn a clean-energy gain into an unsafe or unfair outcome.
Repeat the drill at night with the smaller team. Use a clear call path and a written return step. Record how long it takes to reach the right owner.
Run a second drill after a planned change. Use the same known event and compare the path, time, action, and record. If the answer changed, the release note should say why.
Check the end state in the field, not only on the main screen. A closed order is not proof that a switch moved. A green mark is not proof that a worker is clear.
Keep one false reading in the test set. The review should find it from source, time, unit, or a field check. The system should not reward a smooth chart over a true warning.
Use short names for the states. “Order sent,” “field unit accepted,” and “physical result checked” are different facts. Do not join them into one word such as complete.
14.5 Quantify the Voltage-Control Benefit
The EIA loss figures establish why avoidable losses matter; they do not measure the savings from any particular intervention. One option for the evening peak is voltage control. Conservation Voltage Reduction (CVR) lowers service voltage to reduce consumption. This simplified utility example makes the value calculation explicit:
Given: Distribution system serves 500,000 customers consuming 15 TWh/year at average 120V.
CVR reduces voltage to 116V while staying within ANSI C84.1 service limits. The voltage reduction ratio is 116 / 120 = 0.9667.
For resistive loads, which make up about 40% of this residential example, power consumption scales with voltage squared. The new power ratio is (0.9667)^2 = 0.9345, so that portion uses about 6.56% less energy.
Energy savings on the resistive portion are 15 TWh x 0.40 x (1 - 0.9345) = 0.393 TWh/year.
At $0.10/kWh, this simplified example values 0.393 TWh/year of gross energy saving at $39.3M/year; calculate net return only after estimating the scoped utility investment and operating cost.
14.6 Place the Decision in the Four-Layer Grid
Voltage control is one benefit; reliability is another. The same design must account for the network and owners around the local line.
How often does your power go out? The chapter uses these illustrative annual interruption figures to compare infrastructure; no common reporting year or treatment of major events is supplied, so they should not be read as a current ranking:
- United States: about 160 minutes/year, reflecting aging and weather-vulnerable infrastructure.
- Germany: about 20 minutes/year, helped by modern networks, underground cables, and smart monitoring.
- Japan: about 15 minutes/year, supported by high redundancy and advanced monitoring.
- United Kingdom: about 50 minutes/year, reflecting a mix of modern and legacy systems.
The 2003 Northeast Blackout: On August 14, 2003, a single tree branch touching a power line in Ohio triggered the largest blackout in North American history:
- About 50 million people lost power across eight US states and Ontario. source
- 11 deaths attributed to the blackout
- $5–12 billion in estimated lost economic activity. source
- Lack of real-time visibility was a contributing failure in the cascade
The IoT Solution: Modern Wide Area Monitoring Systems (WAMS) use GPS-synchronized sensors to detect grid instabilities in milliseconds - faster visibility can support corrective action before a cascading failure, but detection alone does not guarantee correction.
14.6.1 Map Voltage, Ownership, and IoT Roles
The electrical grid is organized into four distinct layers, each with different voltage levels, ownership structures, and IoT requirements:
- Generation: roughly 1,100 GW installed capacity, typically 13.8-24kV at plant output, with ownership split across investor-owned utilities, federal entities, public utilities, and cooperatives.
- Transmission: about 170,000 miles of high-voltage lines at 230-765kV, coordinated by regional transmission organizations and other transmission owners.
- Distribution: more than 6,000,000 miles of local lines at 2.4-69kV, operated by over 3,000 local utilities.
- Consumption: In 2024, EIA counted 163.7 million US electricity customers across sectors, including 143.1 million residential customers; service voltage depends on the customer and installation. source
Why Ownership Matters for IoT: The fragmented ownership structure means IoT deployments must integrate with thousands of different utility systems, each with different legacy equipment, communication protocols, and cybersecurity requirements.
Figure 2 answers why one IoT design rarely spans the grid: each layer changes voltage, owner and timing at the same time.
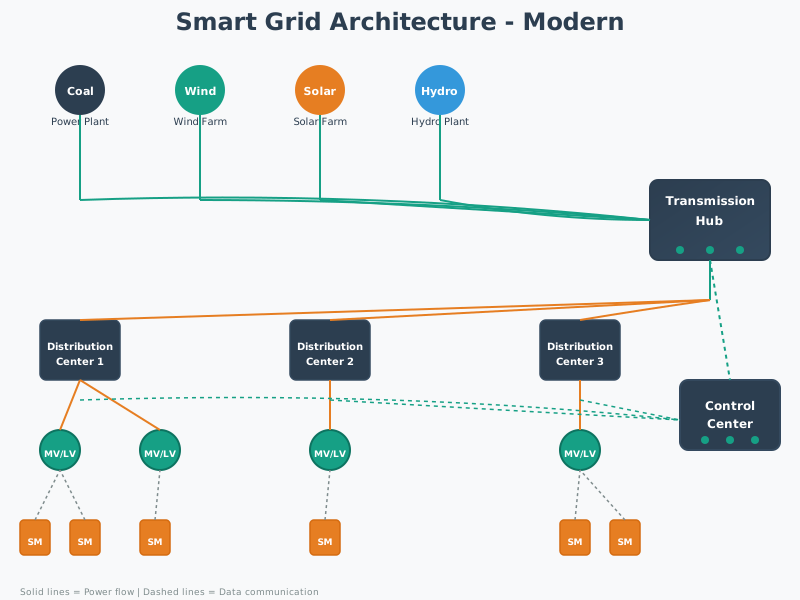
Read the four numbered panels in Figure 2 from left to right. Voltage rises from plant output to bulk transmission, then falls through local distribution to customer service. Under each panel is a second row that matters more here, because the owner changes too, from generators to regional transmission bodies to more than three thousand local utilities and finally to the customers themselves. The band underneath pairs those layers with example IoT roles, and the timing spread is stark. Phasor units report tens of times a second, while meters report every fifteen minutes. The legend adds the arrow that breaks the old picture. Power can flow back from customer solar, so the bottom layer is no longer only a consumer.
14.7 Wide Area Monitoring Systems (WAMS)
The evening decision may need a view beyond one feeder. Wide Area Monitoring Systems (WAMS) use sensors called Phasor Measurement Units (PMUs) to provide real-time visibility into grid health - the equivalent of a cardiac monitor for the electrical grid:
PMU Technical Specifications:
- Reporting rate: 30–60 phasor reports/second, compared with traditional SCADA polling every 2-4 seconds.
- Time synchronization: GPS-based timing with sub-microsecond accuracy so phase angles can be compared across distant locations.
- Measurements: voltage magnitude, phase angle, and frequency, which reveal instability before equipment damage.
- US deployment example: roughly 1,000 PMUs covering critical transmission corridors and major substations.
- Communication: fiber optic, cellular, or dedicated networks where low latency is required for real-time control.
- Data volume: about 50 kB/sec per PMU, so 1,000 PMUs can produce about 50 MB/sec or 4.3 TB/day.
What PMUs Detect:
- Phase angle instability: When distant generators lose synchronization (precursor to blackouts)
- Frequency deviations: Early warning of supply-demand imbalance
- Voltage sags/swells: Equipment stress indicators
- Line loading: Real-time capacity utilization
14.8 Trace Household Meter Data
The control room also needs a slower, household-level view. AMI supplies that view without replacing synchronized transmission monitoring.
Compare the three mounted meters to see how much of each case, display, and wall connection an installer can inspect. The photos matter because the same device name does not tell us what is accessible after installation.


In the first photo, a round meter projects from a metal box fixed to brick. In the second, the round display sits high on a larger rectangular cabinet against stone. The third has a dark front cover with its display and label visible. Those different cases change what can be checked on site. Carry that physical endpoint into the reading and outage data path below.
Smart meters transform the “dumb” endpoint (your home) into an intelligent grid participant:
Figure 6 is worth a close look, because the data flow described below begins at this box and nowhere else.

Three things stand out in Figure 6. The display carries a register code beside the energy figure, so a reading is never just a number. It names which quantity was measured. The nameplate underneath fixes voltage, current range, temperature limits, a serial number and an identifier the utility uses to tell one meter from millions. Below that, a wire seal closes the terminal cover, and that seal is the physical half of data integrity, because tampering leaves evidence. Together they explain why meter data can support billing and outage decisions. The record arrives with identity, stated limits and a custody story attached, which is what the interval readings below depend on.
- Reading frequency: traditional meters are read manually each month; smart meters report automated interval data, often every 15 minutes, for interval-level visibility.
- Outage detection: traditional outage reporting depends on customer calls; smart meters can send last-gasp messages that speed restoration and dispatch.
- Billing accuracy: traditional bills often rely on estimates; smart meters provide actual interval usage that reduces disputes.
- Remote disconnect: traditional service changes require truck rolls; smart meters can receive authorized remote commands, saving about USD 75 per service call.
- Time-of-use pricing: traditional monthly single-register meters do not support automatic time-of-use rate accounting; smart meters make peak and off-peak incentives practical.
- Theft detection: traditional metering makes abnormal consumption hard to detect; smart-meter analytics can flag anomalies and recover billions in lost revenue.
Privacy Concerns: Figure 7 shows how smart-meter readings leave the home; those detailed usage patterns can reveal when you’re home, what appliances you use, even what TV shows you watch (based on power spikes). This has led to privacy backlash and “opt-out” programs in some states.
Inspect Figure 7 to follow interval readings and urgent outage messages from a home meter into separate utility uses.
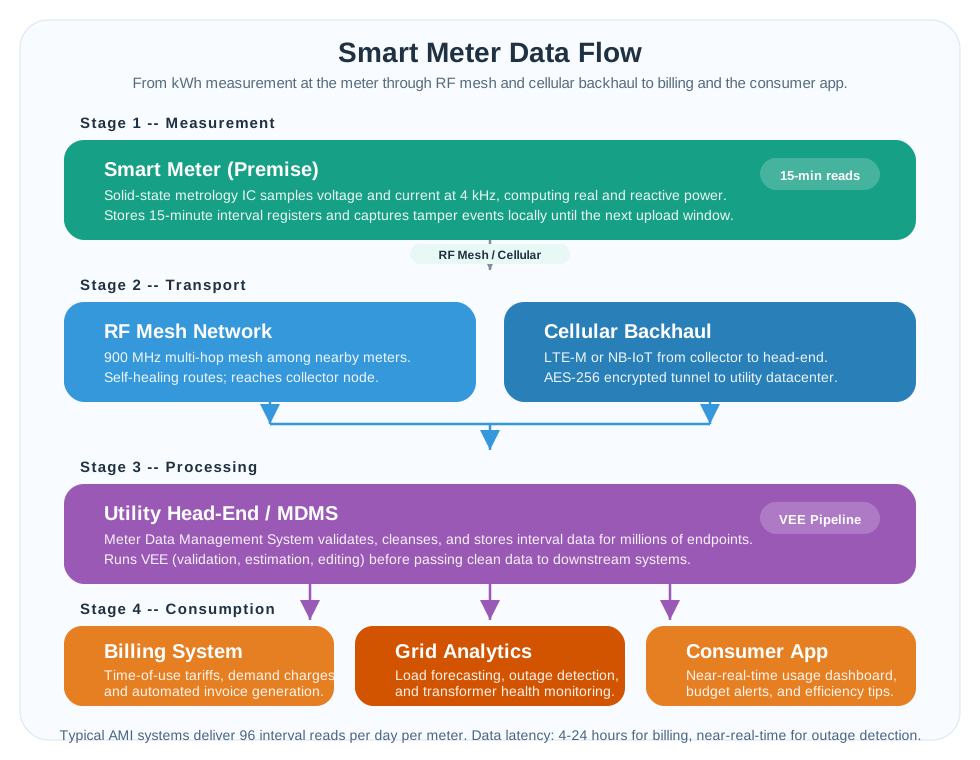
Read Figure 7 from the premise meter into radio frequency (RF) mesh and then cellular transport toward the AMI head-end and MDMS. A 15-minute interval produces 60 ÷ 15 = 4 readings per hour, or 96 per day, while a last-gasp outage message must move with different urgency. The MDMS validates and stores readings before clean intervals support billing, analytics, and the customer app. Authorized commands can return to the meter, so identity and audit matter in both directions. The privacy check belongs beside the usage detail, not after collection.
A last-gasp message also depends on power remaining after the mains fails. The energy budget and the voltage under a radio pulse answer different questions.
A 1 F supercapacitor charged to 5.0 V stores 12.5 J; after 80% conversion efficiency, 10.0 J remains against only 0.066 J for a 3.3 V, 200 mA, 100 ms radio burst. Its 0.1 ohm equivalent series resistance (ESR) causes a sag of 0.020 V. A much larger 0.675 Wh primary cell can still sag 0.600 V through 3 ohms, leaving only 0.400 V above a 2.0 V brownout floor.
Summary
The hot-evening decision connects a physical line to an accountable operating action. Separate measurement, advice, and control; record identity, time, units, quality, owner, and fallback at each handoff. Generation, transmission, distribution, and consumption change the voltage, ownership, and evidence required along that path.
WAMS brings synchronized PMU measurements together for wide-area awareness. AMI carries interval readings and urgent outage messages into validated utility uses. CVR can offer energy savings, but a gross saving calculation needs service limits, load assumptions, and scoped costs before it becomes an investment decision. Privacy, customer consent, and crew clearance belong in the same architecture record as the devices and protocols.
A trustworthy grid architecture can trace a reading to a decision and a checked physical result while preserving local protection, customer rights, and worker authority.
