3 IoT Domains: Constraints and Collection Paths
More
Depth: Practitioner
Progress saves as you read. Mark sections complete as you go; your progress appears in the sidebar.
- Podcast audio coming soon
- Character narration audio coming soon
3.1 Introduction
A farm sensor may wait minutes; a safety stop may not. Domain limits shape the network, storage and collection route. Building on IoT Domains: Shared Patterns, this chapter compares latency, battery, scale, rules and outage limits, then uses site evidence to choose direct collection, storage or peer relay. The applications module index places these cases alongside the other application chapters.
Consider the chapter’s wildlife-monitoring case: a collar follows an animal through a reserve without pervasive antenna towers. Researchers need useful observations between direct sightings, but the collar has limited weight, energy and contact with receivers. A reading can be valuable even when it cannot reach the team immediately. The problem is to preserve both the observation and its meaning until there is a collection opportunity.
We will first compare the decisions and failure costs of different domains, then organize their outcomes and operating constraints. With those approaches in place, we will return to the collar and choose how to store, relay and collect its evidence.
KEY CONCEPTS
- Operating limits
Compare latency, battery, scale, rules and outage costs.
- Telemetry meaning
Keep identity, units, calibration and the action contract.
- Physical budget
Design sensing, storage and radio use for unattended operation.
- Collection path
Distinguish direct collection from storage and peer relay.
3.2 Learning Objectives
- Compare latency, battery, scale, rule, and outage limits.
- Choose store, gossip, or direct collection from site evidence.
3.3 Compare Decisions Before Platforms
When you evaluate a domain, build a small comparison table before choosing a platform. Include latency, battery life, expected device count, data volume, network availability, regulation, ownership, and the cost of missed or false alerts. The right answer often changes before hardware is discussed.
Real technologies make the tradeoffs visible. LoRaWAN can suit low-rate farm or city sensors where battery life and range matter. NB-IoT or LTE-M can help when managed cellular coverage and carrier operations are acceptable. OPC UA and MQTT Sparkplug appear in industrial contexts because equipment identity, tag semantics, and plant integration matter. HL7 FHIR may matter in healthcare because device data has to land in clinical workflows, not just a dashboard.
A useful practitioner artifact is a one-page domain profile. It should name the primary user, the operational decision, the physical environment, the integration target, the data owner, the support team, the success metric, and the unacceptable failure mode. For a city deployment that may mean a public works dispatcher, a GIS asset registry, an open-data rule, and a field maintenance SLA. For a hospital device it may mean a nurse workflow, an EHR interface, a clinical safety review, and privacy controls. For a factory it may mean a maintenance planner, an MES or CMMS integration, a plant-network boundary, and a production downtime threshold.
- Start with a domain scenario. For example, compare cold-chain vaccines, fleet tire pressure, and greenhouse irrigation rather than comparing “sensors” in general.
- Mark the non-negotiables. Safety response time, patient privacy, seasonal access, uptime windows, calibration, and auditability can eliminate attractive-looking stacks.
- Choose a pilot boundary. Test one site, route, ward, field, or production cell deeply enough to reveal operations work before scaling.
Then translate the comparison into tests. A fleet pilot should prove location quality, driver workflow, tire-pressure or temperature sensor durability, cellular coverage gaps, and repair handoff. A precision agriculture pilot should prove gateway placement, battery life through the crop cycle, sensor calibration, and whether operators actually change irrigation or treatment. A healthcare pilot should prove alert routing, device cleaning, data minimization, identity matching, and what happens when a reading is outside expected clinical context.
The final review should be cross-functional. Engineering can explain protocols, payloads, uptime, and integration cost. Operations can explain who acts on alerts and who maintains devices. Legal, privacy, safety, or compliance staff can explain retention, consent, audit, and incident obligations. Finance can decide whether the value of the changed decision justifies the ongoing service cost. If any group is absent, the pilot may still work technically while failing as a domain deployment.
3.4 Preserve the Meaning of Each Reading
The profile tells us who needs the evidence. Next, define what the evidence must mean to that person. Telemetry semantics are the meaning and context that let a reading support a particular decision.
A temperature reading means different things in different domains. In a smart building, it may tune comfort and energy use. In a cold-chain route, it may decide whether a shipment is usable. In a factory, it may forecast bearing failure. In healthcare, it may trigger escalation rules and record retention requirements.
That difference changes the system underneath the chart. Sampling interval, timestamp source, calibration history, retention period, data owner, alarm threshold, and fallback action all become domain-specific. Even the same transport protocol can carry different obligations depending on who relies on the result.
The data contract should therefore carry domain context, not just a value. A temperature event may need device identity, asset identity, location, unit, timestamp source, calibration version, firmware version, quality flag, enclosure state, and the rule that interpreted the value. Industrial deployments may encode asset and tag meaning through OPC UA information models or MQTT Sparkplug B birth certificates. Healthcare integrations may need patient or device identity to map safely into HL7 FHIR resources. Smart-city systems may need geospatial identifiers, public-release rules, and retention metadata before an observation can be shared beyond the operating team.
- Time: Decide whether seconds, minutes, hours, or seasons are the meaningful unit for the domain.
- Trust: Track calibration, firmware version, operator override, and missing-data behavior when decisions depend on the reading.
- Integration: Connect the output to the receiving system people already use, such as a CMMS, EHR, fleet platform, irrigation controller, or city operations console.
Under the hood, domain semantics also shape storage and processing. A smart-building trend may be downsampled for energy analysis, while a regulated cold-chain record may need immutable audit history and exception review. A vehicle-safety signal may be evaluated at the edge because the response window is short. A soil-moisture reading may be most meaningful when joined with soil type, crop stage, valve state, rainfall, and forecast data. A vibration feature may need machine speed, bearing type, maintenance history, and production schedule before anomaly detection is useful.
This is why domain models matter even when platforms advertise generic device management. The registry, time-series database, event broker, rules engine, dashboard, and API can be shared, but they must preserve enough meaning for downstream action. If a pipeline drops units, calibration, identity, quality, or ownership metadata, it may still render a chart while making the operational decision less reliable. A good architecture lets common infrastructure handle ingestion, security, observability, and lifecycle management while domain schemas protect the meaning that operators need.
3.5 Connect Domain Families to Outcomes
Preserving meaning also helps explain value to the people funding and operating a deployment. The five pillars—Sustain, Move, Heal, Feed and Make—organize IoT applications around human needs. Each pillar asks for a different measurable outcome. Figure 1 follows Sustain through a smart-building example, from a temperature event to operations and an energy measure.
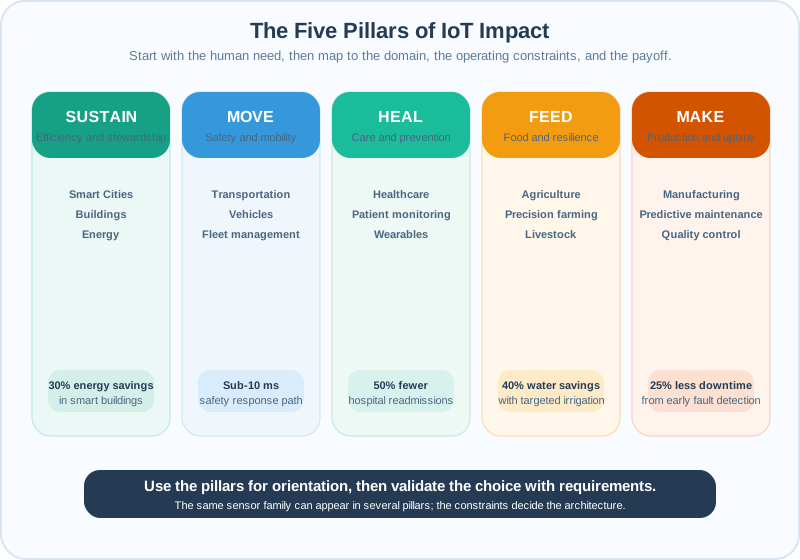
| Pillar | Domain | Key Challenge Addressed | Example Impact |
|---|---|---|---|
| SUSTAIN | Smart Cities | Urban resource efficiency | 30% energy savings in smart buildings |
| MOVE | Transportation | Mobility safety and efficiency | Automated driving may reduce some crash risks; measure the effect for the vehicle and operating domain |
| HEAL | Healthcare | Patient care and prevention | 50% reduction in hospital readmissions |
| FEED | Agriculture | Food production optimization | 40% water savings with precision irrigation |
| MAKE | Manufacturing | Production efficiency | 25% reduction in equipment downtime |
Sustain spans cities, buildings and energy. Move spans transportation, vehicles and fleet management. Heal includes patient monitoring and wearables; Feed includes precision farming and livestock; Make includes predictive maintenance and quality control.
These percentages are illustrative outcomes in the chapter’s examples, not promised improvements for a new installation. The smart-building scenario uses 30% energy savings; the transportation safety example uses a sub-10 ms response. Healthcare illustrates 50% fewer readmissions, precision irrigation 40% water savings, and manufacturing 25% less downtime. A requirements process starts with the human outcome, then chooses sensing, connectivity and operations that can prove it.
The framework serves four practical purposes. It helps you remember the scope of IoT, identify opportunities by asking how to Sustain, Move, Heal, Feed or Make better, communicate value through human needs, and transfer ideas between pillars. Predictive maintenance algorithms developed for MAKE in manufacturing also appear in MOVE for autonomous vehicle maintenance and HEAL for medical equipment monitoring. The algorithm may transfer; its operating limits and action thresholds still need review.
3.6 Compare Categories and Technical Envelopes
The pillars describe the desired outcome. A domain taxonomy groups applications by operating context, making it easier to compare technologies and architectures. The 13 domains below fall into six categories. Figure 2 links each category to a worked domain example and requirement profile; compare the operating path and responsible actor as well as the category name.
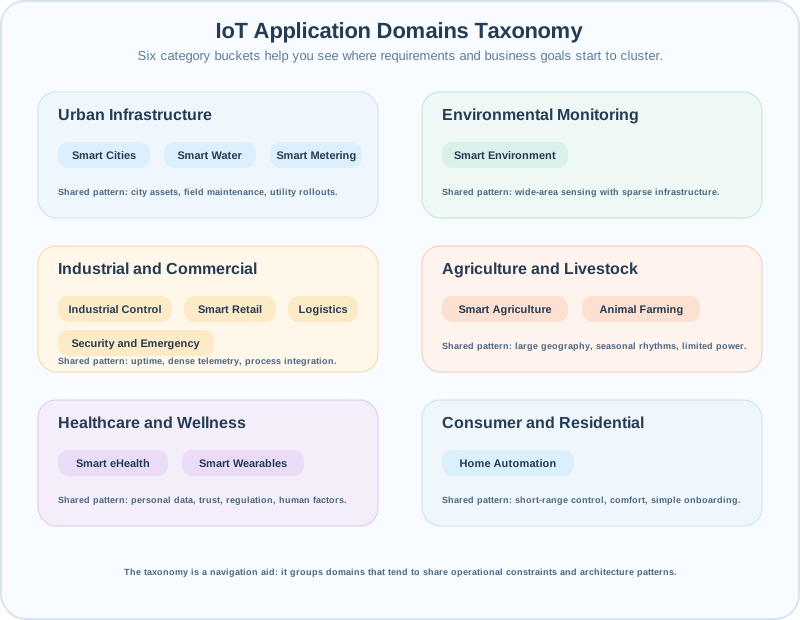
| Category | Domain | Focus Areas |
|---|---|---|
| Urban Infrastructure | Smart Cities | 9 initiatives (parking, lighting, waste, etc.) |
| Smart Water | Quality monitoring, Leak detection | |
| Smart Metering | Energy & Utilities | |
| Environmental Monitoring | Smart Environment | Fires, Pollution, Earthquakes |
| Industrial & Commercial | Industrial Control | M2M, Tracking, Quality Control |
| Smart Retail | Supply Chain, NFC payments | |
| Logistics | Fleet management, Storage | |
| Security & Emergency | Access control, Hazard detection | |
| Agriculture & Livestock | Smart Agriculture | Precision Farming |
| Animal Farming | Tracking, Health monitoring | |
| Healthcare & Wellness | Smart eHealth | Patient Monitoring |
| Smart Wearables | Biometric Sensing | |
| Consumer & Residential | Home Automation | Energy, Security, Comfort |
A deployment can span categories. The city sensor-to-dispatcher path differs from wildlife collars that store and opportunistically replicate observations for later collection. Industrial control emphasizes tag semantics and plant integration; agriculture emphasizes coverage, energy and irrigation decisions; healthcare emphasizes identity, privacy and clinical handoff. Verify latency, data volume, power, regulation, ownership and failure behavior for the actual site.
Figure 3 compares latency tolerance with the volume of data to move. Start with autonomous vehicles and industrial control, whose strict response windows can rule out waiting for a distant service. Healthcare monitoring and smart-grid work have response and data needs that vary by task. The smart-city and agriculture examples tolerate longer delays and move less data, making battery life and wide coverage more prominent.
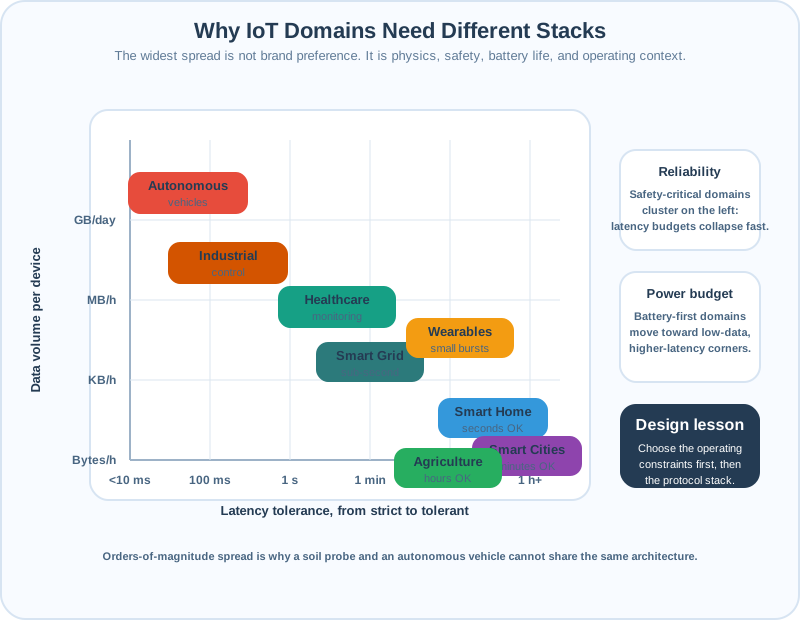
Read the DOMAIN, LATENCY, and DATA VOLUME columns together, starting with Autonomous Vehicles and Industrial Control. Their strict response limits can rule out waiting for a distant service to respond. Next, Healthcare Monitoring and Smart Grid occupy the middle ground, where needs vary by task. Smart Home, Smart Cities, and Agriculture allow longer delays and move less data. For these domains, long battery life and wide coverage may matter more than milliseconds. Treat these profiles as prompts, and check each value against the actual installation before use. Also compare reliability, power budget, and regulation; define what reliability measures before accepting a percentage.
- Autonomous vehicles: Latency below 10 ms, 99.999% reliability, vehicle power, GB/day data volume, and safety-critical regulation.
- Industrial control: Latency below 100 ms, 99.99% reliability, mains power, MB/hour data volume, and industry standards.
- Healthcare monitoring: Latency below 1 s, 99.9% reliability, days-to-weeks battery life, kB-MB/hour data volume, and FDA/CE medical expectations.
- Smart grid: Latency below 1 s, 99.9% reliability, mains or battery power, kB-MB/hour data volume, and utility regulation.
- Smart cities: Minutes of latency, 99% reliability, years of battery life, bytes-kB/hour data volume, and municipal oversight.
- Agriculture: Hours of latency, 95% reliability, years of battery or solar life, bytes/hour data volume, and minimal formal regulation.
- Smart home: Seconds of latency, 95% reliability, months-to-years power budget, kB/hour data volume, and consumer safety expectations.
Those differences explain why a platform chosen for one domain can be wasteful or unsafe in another. Compare the response window and data volume together, then test the power budget, regulation and operating responsibility against the site’s actual decision. A domain name alone does not settle those choices.
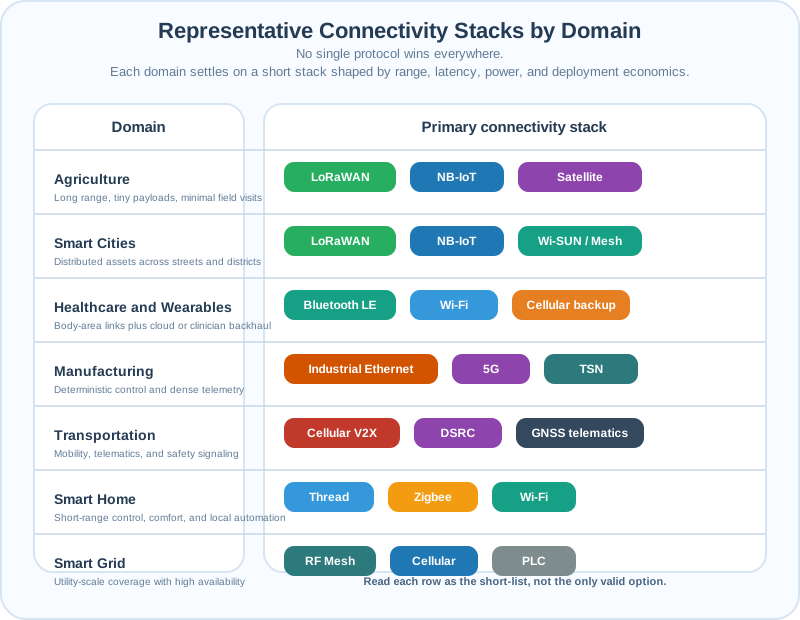
The connectivity matrix makes the next comparison concrete. Agriculture uses LoRaWAN, NB-IoT and satellite; smart cities use LoRaWAN, NB-IoT and Wi-SUN or mesh. Healthcare and wearables use Bluetooth LE, Wi-Fi and cellular backup. Manufacturing uses industrial Ethernet, 5G and TSN; transportation uses cellular V2X, DSRC and GNSS telematics. Smart homes use Thread, Zigbee and Wi-Fi, while smart grids use RF mesh, cellular and PLC. These are representative stacks: range, latency, power and operating ownership narrow the realistic choices before vendor selection.
3.7 Follow the Environment to the Collection Path
The wildlife case now gives those comparisons a physical setting. Collection path means the route by which an observation reaches the team that uses it, including storage and later contact when an immediate link is unavailable.
Environmental monitoring is not limited to fixed weather, fire, or pollution stations. Wildlife conservation can require the sensing system to move with the subject: a collar combines location, motion, biometric, storage, compute, and radio functions so researchers can observe movement and condition between direct sightings. The purpose is not merely to accumulate positions. Continuous records can expose changes in migration, population density, social interaction, injury, illness, or trapping early enough for a conservation team to investigate.
Other environmental targets change the path again. Forestry monitoring can look for illegal logging, land-use or species change, tree health, and fire risk while measuring characteristics such as tree height, stem diameter and density, canopy density, discoloration, or water content; the source flags sparse infrastructure and strong multipath as communication constraints and names longer-wave links, relays, and satellite as candidate paths. Marine monitoring can follow sea turtles, coral reefs, or mercury exposure in fish across migration, pollution, breeding, and nesting studies, but underwater communication moves the design toward sonar or long-wave links. The domain label stays the same while the collection mechanism changes with the environment.
The source example makes the operating constraint concrete. A collar may combine GPS; an accelerometer, gyroscope, and magnetometer; biometric sensors; flash memory; wireless transceivers; and a CPU, while still working within a stated example weight limit of 3—5 pounds and an example lifetime of one year without human intervention. Those are case-study constraints, not universal collar specifications, but they show why sensing frequency, storage, radio use, and retrieval method must be designed together.
The comparison is between environments as well as radios. A fixed station, a moving animal, a forest and an underwater subject offer different contact opportunities. Review the collection mechanism alongside the observation being sought; otherwise, an apparently suitable sensor may produce evidence that the research team cannot retrieve when needed.
3.8 Choose What Survives a Contact Gap
With the environment clear, choose the collection path before components. The reserve’s missing tower coverage makes storage, radio use and retrieval part of the same decision.
In a reserve without pervasive antenna towers, a collar cannot be reviewed as though every reading will reach a gateway immediately. Record four decisions before choosing components:
- Observation: which location, motion, or biometric evidence answers the conservation question?
- Physical budget: what weight and unattended lifetime can the animal carry safely in this study?
- Collection: will a directional antenna on a plane listen for collar pings, will another reachable receiver collect them, or will both paths be used?
- Response: which finding should trigger a field check rather than wait for the next routine collection?
The zebra-monitoring example shows the value of connecting those decisions. The collected records distinguished grazing, graze-walking, and occasional fast movement; indicated that the monitored zebras did not tend to sleep deeply; and showed them seeking water about once a day and drinking relatively quickly. These are findings from that study, not thresholds to transfer blindly to another species.
3.9 Under the Hood: Store, Gossip, Collect
When a collar is outside direct receiver range, it can retain observations in local storage. During an encounter, peer-to-peer communication can use gossip replication: opportunistic copying of information across collars. A later plane flyover can then listen for pings with a directional antenna and collect records from collars in radio range. Replication does not create continuous connectivity; it changes which collar may eventually carry a copy to a collection opportunity. A review should therefore distinguish the time an observation was made, the time it was copied between collars, and the time it reached the research team.
Those separate times matter when interpreting the record. A late arrival can still describe an earlier movement; it does not establish that the animal is in that state now. The response decision must therefore account for what the collection path can deliver.
Direct receiver contact, local storage and peer copying offer different ways to retain and retrieve observations through the reserve’s contact gaps. Review them against the study’s physical budget and the finding that should trigger a field check, rather than assuming every collar has a continuous route to a gateway.
Summary
A domain profile connects the operator’s decision to latency, battery, scale, data volume, network availability, regulation, ownership and failure cost. Telemetry must preserve units, identity, calibration, quality and action context throughout the pipeline. The five pillars explain intended value; the taxonomy and requirement profiles help compare the operating conditions that value depends on.
The wildlife-collar case brings those choices together. Limited weight, unattended lifetime and intermittent receiver access shape sensing, storage and radio use. Local storage preserves observations, peer copying creates later retrieval opportunities, and a flyover can collect records. None of those steps makes contact continuous, so observation time and collection time must remain distinguishable.
Choose a collection path that fits the domain’s physical limits and failure costs, and preserve enough context for the receiving team to interpret the evidence and act.
Carry that domain profile into IoT Application Domains: Requirements and Navigation to continue comparing requirements.
