18 Retail IoT: Loss Prevention and Operations
18.1 Start With the Decision
A tagged item leaves through the wrong door as the freezer temperature rises. Loss prevention, cold-chain response, and energy control need different sensors, actions, and proof.
18.2 Route Overview
This is part 3 of 3. Review Retail IoT: Engagement and Inventory for the preceding evidence.
18.3 Learning Objectives
- Design evidence paths for loss prevention, HVAC, and cold-chain response.
- Choose retail technologies while accounting for read-rate and material limits.
18.4 Chapter Roadmap
- Loss Prevention IoT
- Figure Guide: Loss Prevention Stack
- Energy Management in Retail
- Figure Guide: HVAC Control Loop
- Knowledge Check
- Knowledge Check: Retail IoT Fundamentals
- Knowledge Check Answers
- Retail IoT Technology Comparison
- Figure Guide: Technology Matrix
- Common Retail IoT Pitfalls
- Low-Value SKU Instrumentation
- Pitfall: Beacon Notification Fatigue
- Common Misconceptions About Retail IoT
- Retail IoT Ecosystem Overview
- Figure Guide: Retail IoT Ecosystem
- RFID Metal/Liquid Issues
- Quiz: Retail IoT Concepts
- Quiz: Retail IoT Deployment
- Common Pitfalls
- 1. Assuming 100% RFID Read Rates
- Cold Chain Excursion Response
- Tracking Data Is Not Truth
- Label the Diagram
- Code Challenge
- Summary
- Knowledge Check
- Quiz: Retail IoT Deployment
- Concept Relationships: Smart Retail
- See Also
- In 60 Seconds
- What’s Next
- Design Studio lab
18.5 Loss Prevention IoT
Smart loss prevention combines multiple technologies to reduce shrinkage while maintaining positive customer experience.
18.5.1 Loss Prevention Technology Stack
Inspect Figure 18.1 to see why a retail intervention should follow correlated evidence and human review.
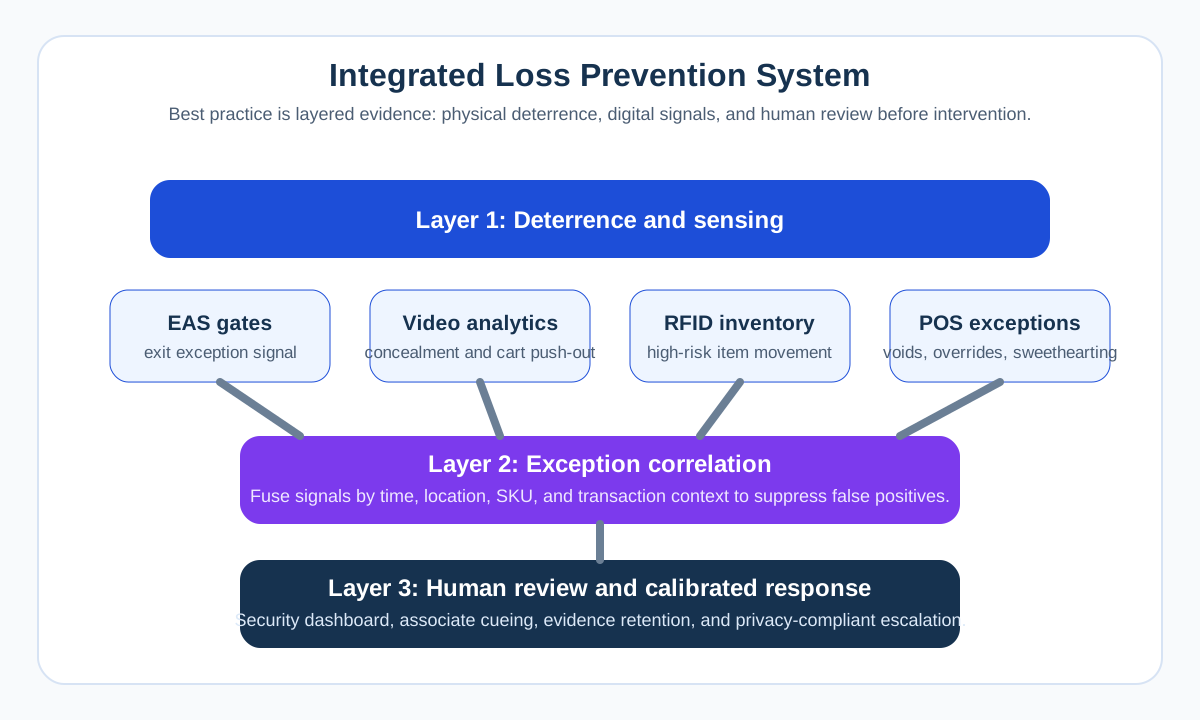
Read Figure 18.1 from deterrence and sensing into correlation. RFID, EAS, video, or POS exceptions provide signals, but none proves theft alone. The second layer combines time, location, SKU, and transaction context before raising the case. The third layer keeps a person in the loop before any intervention affects a customer or employee. That order reduces false positives better than adding another standalone detector. It also makes review possible: the store can inspect which evidence caused escalation, who approved action, and whether the outcome justified the rule.
Figure Guide: Loss Prevention Stack
- Layer 1, sensing: EAS gates, video analytics, RFID, and POS exceptions each catch different signals.
- Layer 2, correlation: combine time, location, SKU, and transaction context before escalating.
- Layer 3, response: human review stays in the loop before intervention.
- Design rule: layered evidence reduces false positives better than any single theft detector.
18.5.2 Video Analytics for Loss Prevention
Capability guide:
- Concealment Detection: Uses object tracking and body-pose analysis, typically 85-92% accurate, and still requires human review before action.
- Sweethearting: Compares POS events against video, typically 90-95% accurate, and requires clear employee-monitoring policy.
- Cart Push-Out: Detects exit without payment, typically 95-99% accurate, and depends on clear evidence handling.
- Ticket Switching: Tracks price-label movement, typically 80-88% accurate, and can create false positives.
- Return Fraud: Checks receipt and item mismatches, typically 75-85% accurate, and works best when integrated with the returns system.
18.6 Energy Management in Retail
Retail stores consume 50-100 kWh per square meter annually. IoT-based energy management can reduce this by 20-40%.
18.6.1 Retail Energy Consumption Breakdown
Energy breakdown:
- HVAC: 40-50% of energy use. Occupancy-based setpoints can save about 25-35%.
- Lighting: 20-30% of energy use. Daylight harvesting plus occupancy sensing can save about 40-50%.
- Refrigeration: 15-25% of energy use. Demand defrost and door sensors can save about 15-25%.
- Other: 10-20% of energy use. Power monitoring and standby reduction can save about 10-20%.
18.6.2 Smart HVAC for Retail
Inspect Figure 18.2 to follow how occupancy and weather become HVAC actions without sacrificing comfort in busy aisles.
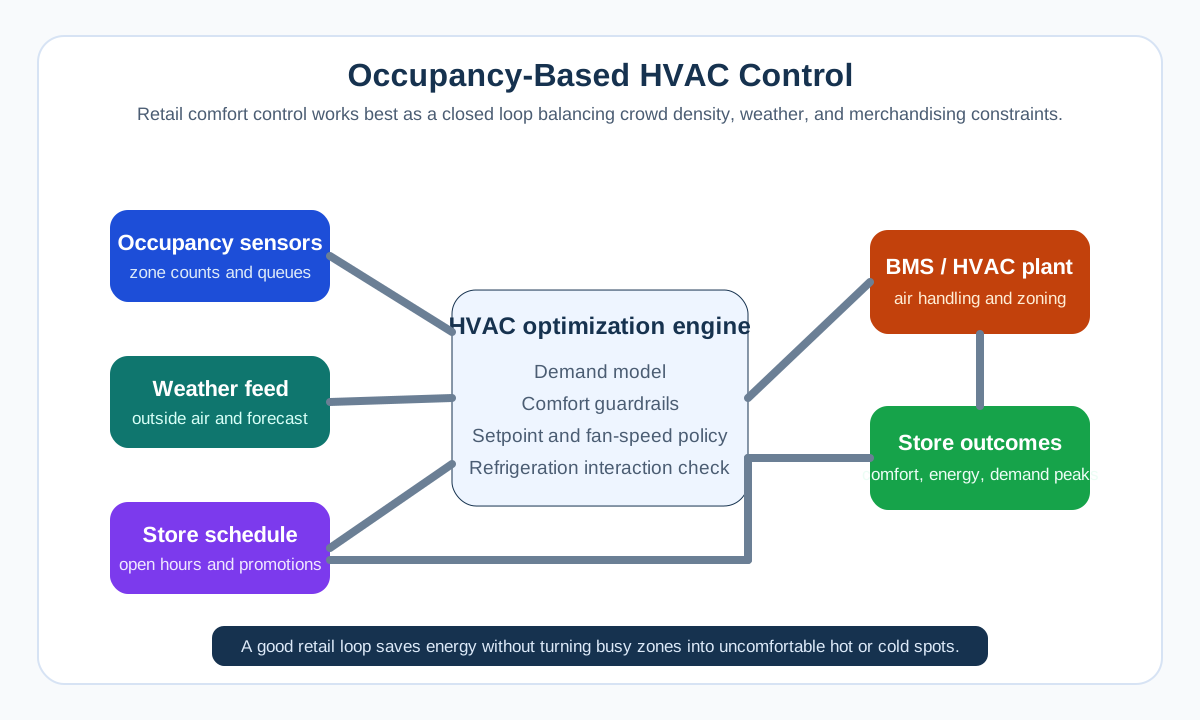
Start Figure 18.2 with zone counts and queues, then add weather and merchandising constraints. The optimizer converts those signals into setpoint and fan-speed decisions for the BMS and HVAC plant. The plant applies air handling and zoning, and the store outcome closes the loop through comfort and energy evidence. HVAC can represent 40–50% of store energy, while occupancy-based setpoints may save about 25–35%, but those figures are useful only inside the guardrail: savings must not make crowded aisles uncomfortable or disturb product conditions.
Figure Guide: HVAC Control Loop
- Inputs: occupancy, weather, store schedule, and merchandising constraints.
- Optimizer: converts those signals into setpoint and fan-speed decisions.
- BMS/HVAC plant: applies the control decisions through air handling and zoning.
- Store outcome: save energy without making busy aisles uncomfortable.
18.7 Knowledge Check
18.8 Knowledge Check: Retail IoT Fundamentals
Question 1: A grocery store has 8,000 SKUs with an 8% out-of-stock rate. If each stockout costs $4.00/hour in lost sales and the store operates 15 hours/day, what is the maximum daily cost of stockouts?
A) $3,840 B) $38,400 C) $4,800 D) $48,000
Question 2: Which smart shelf sensor technology works best for detecting stockouts of irregularly shaped produce items?
A) Light beam sensors B) Weight sensors C) RFID tags D) Capacitive sensors
Question 3: A beacon-based retail system detects a customer near the wine section. Their purchase history shows frequent cheese purchases. What is the most appropriate personalized offer?
A) 10% off all wines B) Wine pairing suggestions based on their cheese preferences C) Reminder about cheese on sale in Aisle 3 D) Loyalty points doubled for any purchase
Question 4: What is the primary advantage of RFID inventory tracking over barcode scanning in apparel retail?
A) Lower cost per tag B) No line-of-sight required, enabling bulk scanning C) Faster individual item scanning D) Better durability in washing
Question 5: A self-checkout system has a 25% false alarm rate for “unexpected item in bagging area.” This causes customer frustration and staff intervention. What IoT enhancement would most directly address this?
A) Faster barcode scanners B) ML-enhanced weight calibration with product database C) Additional security cameras D) Larger bagging area
Question 6: Which electronic shelf label (ESL) technology offers the longest battery life while supporting multiple colors?
A) LCD displays with 2-3 year battery life B) e-Paper (EPD) with 5-7 year battery life C) LED segment displays with 3-5 year battery life D) e-Paper Color with 3-5 year battery life
Question 7: A retailer wants to implement customer analytics while minimizing privacy concerns. Which sensor combination provides useful insights with the lowest privacy risk?
A) Facial recognition cameras + Wi-Fi tracking B) People counters + thermal cameras C) Video analytics + beacon detection D) Wi-Fi probe requests + facial recognition
Question 8: In an RFID apparel workflow, at which stage is the tag typically deactivated?
A) At factory during initial tagging B) When item enters fitting room C) At point of sale during purchase D) When item leaves distribution center
18.9 Knowledge Check Answers
Answer 1: B) $38,400
Calculation: 8,000 SKUs x 8% out-of-stock = 640 stockout incidents. 640 x $4.00/hour x 15 hours = $38,400 maximum daily loss. Note: This is the theoretical maximum if all stockouts persist all day; actual losses depend on detection and restocking speed.
Answer 2: B) Weight sensors
Weight sensors work regardless of product shape, size, or orientation. Light beam sensors can be triggered by customer browsing; RFID requires tagging each produce item (impractical); capacitive sensors struggle with varying moisture content in produce.
Answer 3: B) Wine pairing suggestions based on their cheese preferences
This demonstrates contextual personalization - using location (wine section), purchase history (cheese), and timing (current shopping trip) to create relevant, helpful suggestions. Generic discounts (A) miss personalization; cheese reminders (C) may not be relevant; doubled points (D) lack context.
Answer 4: B) No line-of-sight required, enabling bulk scanning
RFID can read hundreds of tags simultaneously without requiring direct line-of-sight. This enables inventory counting in seconds rather than hours. RFID tags cost more than barcodes (not A), individual scanning speed is similar (not C), and standard RFID tags don’t survive washing (not D).
Answer 5: B) ML-enhanced weight calibration with product database
The root cause is weight sensors triggering on small discrepancies. ML can learn product weights with tolerances, accounting for packaging variations. Faster scanners (A) don’t address weight issues; cameras (C) add monitoring but don’t fix the alarm trigger; larger bagging areas (D) don’t solve the weight calibration problem.
Answer 6: D) e-Paper Color with 3-5 year battery life
e-Paper Color (7-color) offers 3-5 year battery life, balancing multi-color capability with longevity. Standard e-Paper (B) has the longest battery life (5-7 years) but only supports black/white/red. LCD (A) offers full color but shorter battery life. LED segments (C) only display numbers.
Answer 7: B) People counters + thermal cameras
People counters provide anonymous foot traffic data, while thermal cameras detect crowd density through heat signatures without identifying individuals. Both operate at low privacy risk. Facial recognition (A, D) and Wi-Fi tracking (A, D) involve PII collection. Video analytics (C) and beacon detection (C) require more privacy safeguards.
Answer 8: C) At point of sale during purchase
RFID tags are deactivated (or the EAS function disabled) at point of sale when the customer completes payment. This allows the tag to track the item through the entire supply chain and sales floor while preventing false alarms when legitimate purchasers exit the store. Factory tagging (A) would defeat loss prevention; fitting room deactivation (B) would allow theft; distribution center deactivation (D) would eliminate store-level tracking.
18.10 Retail IoT Technology Comparison
Understanding the tradeoffs between different retail IoT technologies helps in making informed deployment decisions:
Figure 18.3 answers which of these technologies a store should pilot first, using only two things a retailer can estimate before buying.
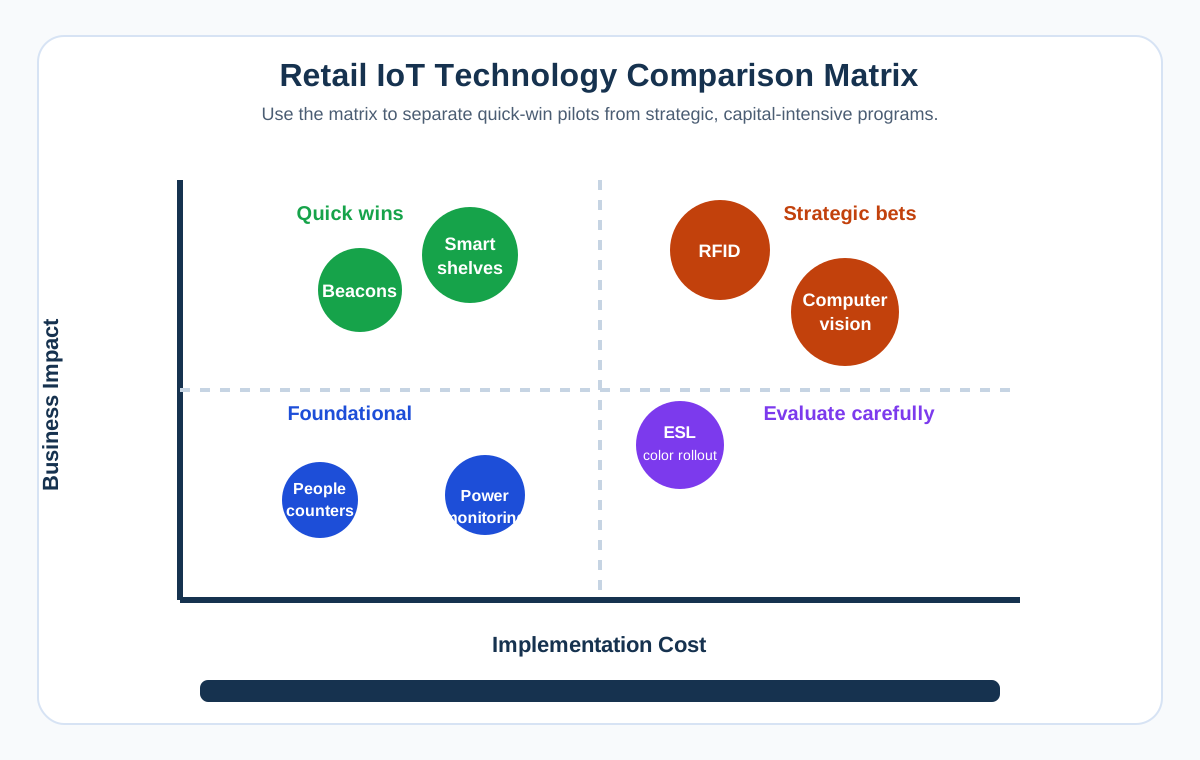
The two axes in Figure 18.3 are cost across and business impact up, which creates four corners. Beacons and smart shelves sit top left, cheap enough to pilot and still worth doing, so they are the sensible first move. Radio tags and computer vision sit top right, where the return is real but so is the capital, so they need a business case rather than a trial budget. People counters and power monitoring sit low and left. They are cheap, and their impact is small on its own, which makes them plumbing that supports later work. Electronic shelf labels sit near the middle, which is the honest answer, because the cost is committed long before the benefit is proven.
Figure Guide: Technology Matrix
- Quick wins: smart shelves and beacons offer high impact without the biggest capex burden.
- Strategic bets: RFID and computer vision can deliver strong value, but they demand larger rollout discipline.
- Foundational moves: people counters and basic sensing help build data habits at lower cost.
- Use caution: expensive low-impact programs are hard to justify unless a very specific constraint demands them.
Technology Selection Guidelines:
- Quick Wins (high impact, low cost): Best for initial pilots and proof of value. Typical choices: smart shelves, BLE beacons, and people counters.
- Strategic (high impact, high cost): Best for competitive differentiation. Typical choices: RFID inventory and computer-vision checkout.
- Foundational (low impact, low cost): Best for infrastructure building. Typical choices: basic sensors and network upgrades.
- Evaluate (low impact, high cost): Avoid unless a specific use case requires it. Typical examples: over-engineered solutions.
18.11 Common Retail IoT Pitfalls
18.12 Low-Value SKU Instrumentation
The Mistake: Deploying smart shelf sensors across all products instead of focusing on high-velocity, high-margin items.
Why It Happens: “Complete visibility” sounds appealing. Vendors quote per-unit costs that seem low. The value of prioritization isn’t immediately obvious.
The Fix: Apply Pareto principle rigorously. Top 20% of SKUs drive 80% of revenue. Instrument these first. A slow-moving item with $2/day potential loss doesn’t justify a $12 sensor with $8/year monitoring costs.
18.13 Pitfall: Beacon Notification Fatigue
The Mistake: Sending push notifications every time a customer passes a beacon, leading to app deletion and negative brand perception.
Why It Happens: Marketing teams optimize for notification open rates. Each department wants to communicate with customers. No governance over total notification volume.
The Fix:
- Cap notifications at 2-3 per store visit
- Require 15+ minute dwell time before triggering
- Use preference learning to send only relevant offers
- Implement easy opt-out with clear value exchange
18.14 Common Misconceptions About Retail IoT
Misconception 1: “Walk-out stores will replace all checkout methods.” Reality: Amazon Go-style computer vision stores cost $1-3 million per location to retrofit and achieve 95-99% accuracy — meaning 1-5% of items go undetected. Traditional checkout handles 99.9% accuracy at far lower infrastructure cost. Walk-out technology suits small-format convenience stores (under 3,000 sq ft) but is not economically viable for full-size supermarkets with 30,000+ SKUs.
Misconception 2: “RFID tagging makes sense for every product.” Reality: At $0.03-0.08 per tag, RFID is cost-effective for items priced above roughly $5-10 (where tag cost is under 1% of item value). Tagging a $0.75 can of beans adds 4-10% to product cost, which is unacceptable for thin-margin grocery. RFID adoption is highest in apparel (where margins are 50-60%) and electronics (where loss prevention justifies the cost).
Misconception 3: “More data collection always means better customer insights.” Reality: Collecting Wi-Fi probe requests, facial recognition data, and Bluetooth signals simultaneously creates legal liability under GDPR (fines up to 4% of global revenue) and erodes customer trust. Stores that use only anonymous, aggregate analytics — people counters and thermal cameras — often achieve 80% of the insight value at 10% of the privacy risk. The marginal value of identifying individual customers rarely justifies the regulatory and reputational exposure.
Misconception 4: “Smart shelves eliminate the need for manual inventory counts.” Reality: Smart shelves detect product presence in real time but cannot verify product identity (a misplaced item on the wrong shelf still registers as “stocked”). RFID-enabled stores still perform quarterly full-store inventory audits, though these now take 30 minutes instead of 8 hours. Smart shelves reduce count frequency, not eliminate it entirely.
18.15 Retail IoT Ecosystem Overview
Inspect Figure 18.4 to see how four retail domains depend on one operating model rather than isolated devices.
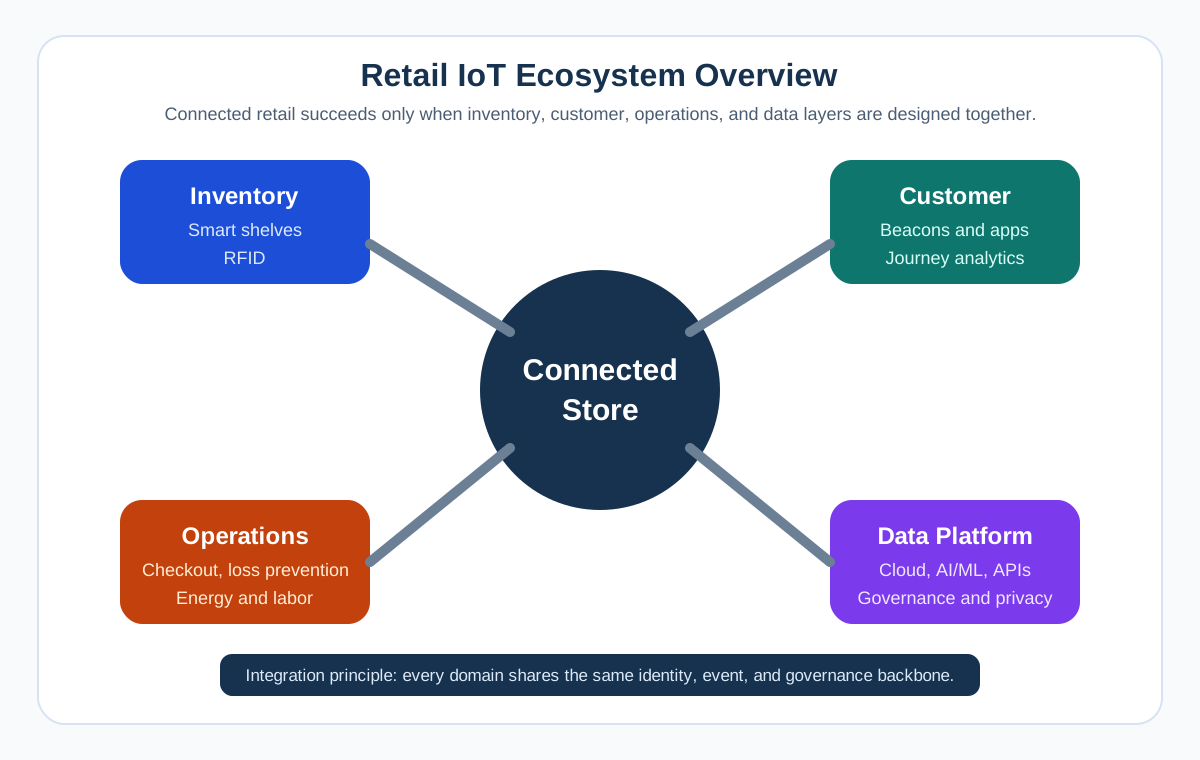
Read Figure 18.4 outward from the connected store. Inventory tools such as smart shelves, RFID, and electronic labels keep stock visible. Customer tools shape journeys and offers, while checkout, loss prevention, and energy systems turn observations into store operations. The data platform connects all three through cloud services, analytics, and integration. That centre is not merely a database: it provides shared identity, timing, and ownership so an inventory event can influence a replenishment or customer decision without creating four conflicting versions of store state.
Figure Guide: Retail IoT Ecosystem
- Inventory: smart shelves, RFID, and electronic shelf labels keep stock visible.
- Customer: beacons, analytics, and mobile apps shape journeys and offers.
- Operations: checkout, loss prevention, and energy systems turn data into store execution.
- Data platform: cloud, AI/ML, and integration connect those domains into one operating model.
18.16 RFID Metal/Liquid Issues
The Mistake: Rolling out passive UHF RFID tags across an entire product catalog without accounting for the physics of how metal and liquids block/absorb RF signals, leading to 30-60% read failures on specific products.
Why This Happens: RFID vendors demo the technology in ideal conditions (apparel on hangers, electronics in boxes), and retailers assume all products will perform the same. Metal and liquid interference is often dismissed as “not our problem” or discovered only after tens of thousands of tags have been purchased.
The Physics Problem:
Metal objects: Reflect RF energy, creating standing waves that cancel out the tag’s response
- Aluminum cans, metal packaging, jewelry, tools, electronic devices
- Effect: Tag reads at 5 cm instead of 5 meters (99% range reduction)
Liquid-filled products: Absorb and detune 860-960 MHz UHF RFID signals (water is lossy at these frequencies)
- Bottled beverages, cosmetics, cleaning products, sauces
- Effect: Tag reads at 10-30 cm instead of 5 meters (94-98% range reduction)
Real-World Failure Example:
A grocery chain deployed RFID tags on 18,000 SKUs:
- Apparel/dry goods: 98% read rate.
- Canned goods (metal): 12% read rate.
- Bottled beverages: 8% read rate.
- Cosmetics (liquid in metal): 3% read rate.
Result: $450K investment, but system was abandoned because 40% of inventory (by SKU count) and 60% (by revenue) couldn’t be reliably tracked.
Category-Specific Read Rates:
- Textiles (dry): Standard tag 95-99%, no special tag needed. Ideal case.
- Cardboard boxes: Standard tag 90-98%, no special tag needed. Good performance.
- Plastic bottles (empty): Standard tag 85-95%, no special tag needed. Acceptable.
- Metal cans: Standard tag 5-20%, special on-metal tag 70-85%. Requires on-metal tag.
- Liquid bottles: Standard tag 5-15%, special tag 60-80%. Requires anti-liquid or on-metal treatment.
- Cosmetics (liquid + metal): Standard tag under 5%, special tag 50-70%. Very difficult.
- Electronics with batteries: Standard tag 10-30%, special tag 60-80%. Metal shielding blocks RF.
The Fix: Tag Selection and Placement
On-Metal RFID Tags:
- Use dielectric spacer to separate tag antenna from metal surface
- Cost: $0.15-0.40 per tag (vs. $0.03-0.08 standard)
- Read range: Recovers to 2-4 meters (vs. <5 cm with standard tag)
Anti-Liquid RFID Tags:
- Tuned antenna for high-dielectric environments
- Foam/plastic spacer to separate tag from liquid
- Cost: $0.10-0.30 per tag
- Read range: 50 cm - 2 meters (vs. <10 cm with standard tag)
Strategic Placement:
- Aluminum cans: Tag on END of can (parallel to metal, not perpendicular)
- Bottles: Tag on CAP or LABEL (away from liquid mass)
- Cosmetics: Tag on OUTER PACKAGING (not inner product)
- Electronics: Tag on SHIPPING BOX, not internal to device
Case Study: Apparel Retailer Lessons
Successful deployment after learning from mistakes:
Phase 1 Failure (standard tags everywhere):
- Denim with metal rivets: 15% read rate
- Leather goods with metal zippers: 8% read rate
- Shoes with metal eyelets: 25% read rate
Phase 2 Success (material-specific tagging):
- Denim: On-metal tag placed AWAY from rivets → 92% read rate
- Leather: Tag on hang tag or inner fabric, not touching metal → 88% read rate
- Shoes: Tag inside shoe (foam acts as spacer from metal) → 85% read rate
Investment:
- Standard tags: $0.05 × 500,000 items = $25,000
- On-metal tags for 20% of items: $0.25 × 100,000 = $25,000
- Extra labor for specialized placement: $0.02 × 100,000 = $2,000
- Total: $52,000 (vs. $25K for failed all-standard approach)
ROI: 95% read rate (vs. 40% with wrong tags) enabled inventory accuracy to reach 98%, preventing $180K annual loss from “phantom inventory” (system thinks item exists but it’s misplaced/stolen).
Prevention Checklist:
Before Deploying RFID:
-
Categorize inventory by RF characteristics:
- Soft goods (textiles, paper) → Standard tags
- Hard goods with metal → On-metal tags
- Liquids → Anti-liquid tags
- Combination (liquid in metal) → On-metal tags + careful placement
-
Pilot testing on actual products:
- Tag 50 items from each problematic category
- Test read rates with planned reader setup (handheld, tunnel, shelf)
- Measure reads at different orientations and distances
- Identify failure modes BEFORE buying 100,000 tags
-
Calculate blended tag cost:
- Don’t assume $0.05/tag across all products
- Reality: 60% standard ($0.05) + 30% on-metal ($0.25) + 10% special ($0.40)
- Blended cost: (0.6 × $0.05) + (0.3 × $0.25) + (0.1 × $0.40) = $0.145/tag
- Budget accordingly (3x higher than vendor’s initial quote!)
-
Design for worst-case scenarios:
- If system fails on 40% of products, it fails completely
- Better to start with proven categories (apparel) than fail on diverse inventory
Key Warning Signs:
- Vendor demos only with cardboard boxes or hanging clothes
- Vendor quotes single per-tag price without asking about product materials
- No discussion of metal/liquid interference during planning
- “RFID works on everything” claims (physics says otherwise!)
Key Takeaway: RFID is not a universal solution. Success requires material-aware tag selection, strategic placement, and realistic budgeting for specialized tags. Pilot on your ACTUAL product mix, not sanitized vendor demos, before committing to large-scale deployment.
18.17 Quiz: Retail IoT Concepts
18.18 Quiz: Retail IoT Deployment
Common Pitfalls
18.19 1. Assuming 100% RFID Read Rates
RFID read rates in practice range from 85-98% depending on tag orientation, metal interference, and reader antenna placement. Inventory counts with uncorrected misreads produce phantom stock and missed replenishment triggers. Measure read rates in the actual deployment environment, use redundant antennas at choke points, and apply statistical correction models.
18.20 Cold Chain Excursion Response
Deploying cold chain temperature monitoring without defining what happens when a threshold is exceeded means sensors alert but no one acts. Define excursion response procedures (quarantine, test, discard, document) before deployment and integrate alerts directly into the quality management system.
18.21 Tracking Data Is Not Truth
RFID and barcode scan data reflects when items passed a read point, not their current location or condition. Treating tracking data as live inventory truth leads to misallocations. Implement reconciliation logic that ages out stale location data and flags items not scanned within expected timeframes.
18.22 Label the Diagram
18.23 Code Challenge
18.24 Summary
Retail IoT delivers measurable business value across five pillars:
- Inventory Intelligence: Out-of-stock rate typically improves from 8% to about 2-3%.
- Customer Experience: Conversion rate typically improves by about 15-25%.
- Checkout Automation: Transaction time typically drops by about 40-60%.
- Loss Prevention: Shrinkage rate typically drops by about 30-50%.
- Energy Management: Energy cost typically drops by about 20-40%.
Key Success Factors:
- Start with high-velocity items: Focus IoT investment where impact is greatest
- Privacy by design: Build customer trust through transparent data practices
- Integration over innovation: Connect to existing systems rather than creating silos
- Measure and iterate: Establish baselines and track improvements
Critical Tradeoffs:
- Personalization depth vs. privacy perception
- Automation level vs. customer service experience
- Investment concentration vs. broad coverage
18.25 Knowledge Check
18.26 Quiz: Retail IoT Deployment
18.27 Concept Relationships: Smart Retail
- RFID Smart Shelves -> Out-of-Stock Detection: Real-time inventory monitoring reduces stockouts from about 8% to 2-3%, increasing sales by 3-5%.
- Beacon Notifications -> Notification Fatigue: More than 3 push notifications per visit can cause 40% app uninstall rates; personalization plus cool-down periods prevent fatigue.
- Self-Checkout Automation -> Transaction Time: RFID-enabled basket scanning reduces checkout time by 40-60%, improving customer experience and throughput.
- Heat Maps + Journey Analysis -> Conversion Rate: Foot-traffic analysis improves conversion 15-25% by optimizing placement and staffing.
- Privacy by Design -> Customer Trust: Transparent data practices such as opt-in and clear signage increase IoT feature adoption by 2-3x versus stealth tracking.
Cross-module connection: Retail IoT combines RFID/NFC (Module 4), BLE beacons (Module 4), computer vision (Module 6), and privacy compliance (Module 7). See RFID Fundamentals.
18.28 See Also
- RFID and NFC Fundamentals — Technology behind smart shelves and self-checkout
- BLE Beacon Protocols — Proximity marketing and indoor navigation
- Privacy and Data Ethics — Building customer trust in retail IoT
18.29 In 60 Seconds
Retail IoT uses RFID, shelf sensors, and tracking beacons to provide real-time inventory visibility, cutting shrinkage by 20-40% and enabling automated replenishment that reduces out-of-stock events across distributed store networks.
18.30 What’s Next
- Smart Manufacturing: Supply chain upstream from retail.
- Smart Home: Consumer IoT in residential settings.
- RFID and NFC Fundamentals: Deep dive into retail tagging technologies.
18.31 Continue Your Route
This final part closes the route from Loss Prevention IoT through Design Studio lab. Return to Retail IoT: Engagement and Inventory or continue from the applications module index.