12 Smart Cities: Parking and Governance
More
Depth: Practitioner
Progress saves as you read. Mark sections complete as you go; your progress appears in the sidebar.
- Podcast audio coming soon
- Character narration audio coming soon
12.1 Make the Parking Promise Reviewable
A parking sensor can report each second and still fail the city. Coverage, battery use, false states, and rules decide whether it cuts traffic. This chapter connects the engineering calculation to the public-service contract: calculate sensor density, airtime, battery charge, and return on investment (ROI), then define who owns the data and the decisions it supports.
The running scenario is Austin, Texas, with a stated population of 1,015,000. The city plans downtown parking sensors to reduce cruising-for-parking traffic by 25%. Its planning target is to instrument 80% of the named downtown inventory and mark the remaining spaces as outside guidance coverage. These are scenario assumptions, not measured results of a deployment.
The problem is to make that promise credible. A sensor count does not establish that drivers will adopt the service, and a successful transmission does not establish that anyone responds. We will first draw the coverage boundary and calculate its costs, then follow observations through shared city records, department workflows, and governance rules. The preceding Service Envelopes and Initiatives supplies the service context; the applications module index places this case among other domains.
KEY CONCEPTS
- Coverage boundary
Guidance identifies which spaces it can describe.
- Airtime and charge
A tiny report still spends battery charge on air.
- Service ownership
A department owns the response and public evidence.
- Purpose and privacy
Collection and retention follow the approved service.
12.2 Learning Objectives
- Calculate parking sensor density, airtime, battery charge, and ROI.
- Define governance rules for parking data and service decisions.
12.3 Draw the Coverage Boundary Before Buying Sensors
Austin’s scenario contains 18,500 on-street spaces across 42 city blocks in an 8 km² downtown area. The average driver spends 18 minutes searching, and parking search accounts for an assumed 30% of downtown vehicle-hours. Those assumptions define the potential benefit; the instrumented boundary defines where the guidance can make a claim.
At 80% coverage, the target is 18,500 × 0.80 = 14,800 sensors. Each magnetic sensor costs $185 including installation. The remaining spaces stay explicitly outside guidance coverage. Credibility depends on matching the app’s claims to this boundary: a phased deployment can work when observations are accurate and fresh and the service is evaluated before expansion.
The gateway planning assumption is one LoRaWAN gateway per 2 km radius, costing $2,400 each. Its circular area is π × (2 km)² = 12.57 km². A simple area calculation therefore gives a minimum of one gateway for 8 km²; the scenario budgets three gateways with overlapping coverage for reliability and redundancy. Area arithmetic alone does not prove the urban radio link.
Parking guidance is a trust problem. Cruising can add congestion in some downtown districts, but its share of traffic varies by place; stale availability data can quickly break adoption. Keep the scenario’s 30% assumption separate from a general citywide claim. The Federal Highway Administration’s discussion of parking search provides the source context.
With the service boundary explicit, we can price the installation and examine what would have to change for it to pay back.
12.4 Calculate Costs, Benefits, and Reporting Burden
Capital expenditure (CapEx) is the initial investment. The Austin calculation combines 14,800 × $185 = $2,738,000 for sensors, three × $2,400 = $7,200 for gateways, and $150,000 for one-time platform integration. Total CapEx is $2,895,200, or about $2.9 million.
Operating expenditure (OpEx) is the recurring service cost. Connectivity at $1.50 per sensor per month costs $266,400/year. The cloud platform costs $4,500/month, or $54,000/year. Replacing 5% of the sensors means 740 replacements/year at $185, or $136,900/year. Together these make $457,300/year.
The benefit projection reduces search time from 18 minutes to 5 minutes, about a 72% reduction. Applying that rounded reduction to the assumed 30% parking-search share gives 21.6% fewer downtown vehicle-hours. That uses a different denominator from the 25% cruising-for-parking target. Keep both projections separate from evidence that the service has met its traffic goal.
The annual benefit ledger separates who receives the value:
| Value to drivers and the city’s economy | Cash the city receives |
|---|---|
| 1.2 million driver-hours at $12/hour: $14,400,000; 890,000 gallons at $3.50/gallon: $3,115,000; total $17,515,000/year | Parking turnover revenue: $1,800,000/year |
Together these are $19,315,000/year in projected public value. These benefit and adoption assumptions need testing against the service. Subtracting $457,300 annual OpEx gives $18,857,700 in net annual public value; $2,895,200 CapEx divided by this gives about 56 days of public-value payback. The five-year 3,157% figure is a public-value ratio, not a city budget return.
For city cash, $1,800,000 − $457,300 = $1,342,700/year, so $2,895,200 / $1,342,700 is about 2.2 years (26 months); the five-year return is about 132%. A finance office would use the city cash payback for its budget. See Match Finance to the Benefits the City Keeps. Lower coverage may reduce addressable benefit, but adoption cannot be inferred from coverage alone.
The separate ROI calculator lets you change sensor coverage, search-time reduction, and turnover. In that model, driver time savings account for about 85–95% of total benefit, making search-time reduction the critical input. Compare the assumptions before comparing its output with Austin’s worked ledger.
A recurring cost can also hide inside the reporting policy. A 30-second interval produces 2,880 transmissions per day; for battery sensors, the power budget can be harder than the message volume. The one-second transmission line item therefore deserves its own calculation before it becomes a service-life claim.
12.5 Phoebe’s Field Notes: Why The Parking Sensor’s “1 Second” Isn’t Arbitrary
At 868 MHz, a gateway 2 km away imposes about 97.2 dB of free-space loss. Airtime is the duration of a radio transmission. A 12-byte LoRaWAN payload at SF12 and 125 kHz stays on air for about 1.16 seconds. A 40 mA transmission therefore costs roughly 46.2 mA·s before retries. The same pulse can sag a 15 ohm primary cell by 0.60 V.
These values explain Phoebe’s field note about the parking sensor’s “1 second” line item. They do not prove an urban link or ten-year service life. Keep distance, spreading factor, airtime, charge, and voltage sag together when reviewing the battery ledger.
12.6 Give Each Observation a Service Owner
The Austin calculation describes potential value. A service contract must explain how the city delivers it. The same gap appears in the streetlight example: a light reports a fault at midnight, the reading reaches the city, yet no team owns the repair. Residents still walk through a dark street.
Governance is the set of rules and owners around the service promise. Say what residents should receive, name the city team that owns the result, set a response time, and explain how people can report a problem and learn what happened. Define who may collect and use data, how long records stay, and who handles faults, complaints, changes, and the end of a supplier deal.
Follow the streetlight event: the city checks the fault, a work order reaches a repair team, the team fixes the light, and the public record shows the result. Each handoff needs an owner and proof. These duties turn the parking case’s projected benefit into a question that departments and residents can review.
A smart-city deployment is a public-service system. It must improve mobility, safety, energy use, waste collection, air quality, accessibility, or maintenance while preserving public trust. The design has to account for residents, visitors, service crews, city departments, vendors, elected officials, and people who do not use the city’s app. It also has to respect the fact that public-space sensing is rarely optional for the people being observed.
Begin with the service outcome before the technology. A parking sensor should reduce search time or enforcement friction. A streetlight controller should improve lighting reliability, energy use, and night-time safety. A waste sensor should change collection routing. An air-quality node should support public health decisions with enough calibration and context to be trusted. If the data does not alter a city workflow, a resident service, or a published accountability measure, the deployment is still an instrumentation pilot rather than a smart-city service.
The strongest proposals name the operational decision, the responsible department, the response window, and the public evidence of success. Parking guidance may need block-level coverage above a trust threshold before residents rely on it. Adaptive lighting may need local fail-safe brightness when the backhaul is offline. Flood, traffic, and air-quality services need a clear rule for when a measurement becomes a field crew task, a public alert, an enforcement action, or a dashboard-only observation.
- Service question: which public decision or operational action changes when the data arrives?
- Trust question: what data is collected in public space, who can access it, how long is it retained, and how is the use explained?
- Equity question: which neighborhoods, access needs, languages, maintenance patterns, and offline alternatives are included in the rollout?
A smart-city design therefore has to be useful at street level and accountable at city level. It should show how a field event becomes a maintained asset record, a department workflow, a public-facing message, or an open-data release, and it should show what happens when the event is missing, stale, biased, or too sensitive to publish.
The Smart Cities service foundations introduces parking, lighting, waste, air-quality, traffic, safety, privacy, and cross-domain platforms. The contract here gives those services a responsible department, a data model, a governance boundary, and explicit failure behavior.
12.8 Govern Data Use and Long-Term Maintenance
Shared records make evidence reusable. Their contract must also state when reuse is allowed, who maintains the equipment, and what happens when quality or coverage is poor.
City systems live longer than most prototypes and operate in places the public cannot opt out of. The architecture therefore needs governance, procurement, cybersecurity, accessibility, and maintenance paths from day one. A field node that works in a pilot but has no spare-parts plan, ownership model, firmware-update route, or data-sharing agreement becomes civic technical debt. Scale amplifies those weaknesses because thousands of devices create recurring work: cleaning, battery replacement, SIM management, certificate rotation, firmware updates, calibration, pole access permits, road closures, and resident complaints.
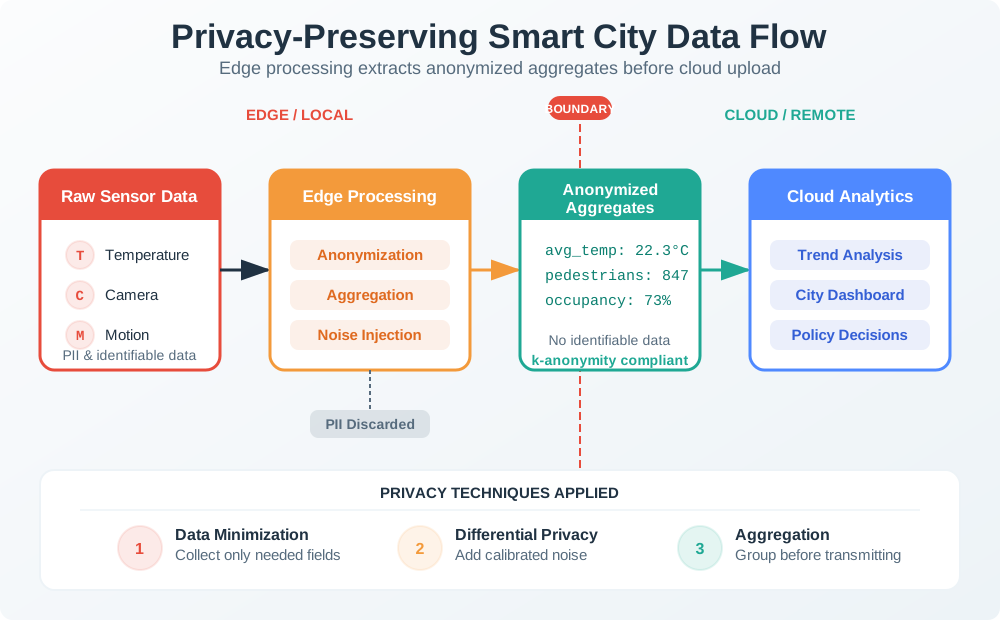
- Data-governance boundary: define data owner, steward, schema, quality flag, retention period, open-data release, API rate limit, and exception process for sensitive feeds.
- Cyber boundary: define device identity, certificate rotation, network segmentation, vendor remote access, firmware signing, vulnerability response, and International Electrotechnical Commission (IEC) 62443-style zone assumptions for operational systems.
- Privacy boundary: define whether video, Wi-Fi, Bluetooth, license-plate, or app data is anonymous, aggregated, blurred, consented, or prohibited; document signage and public review expectations.
- Operations boundary: define battery replacement, cleaning, calibration, pole access, traffic-control permits, outage handling, seasonal drift, service-desk ownership, and procurement exit rights.
Privacy and security controls should be explicit because public-space sensing can drift from service delivery into surveillance. Aggregation, blurring, edge redaction, deletion windows, public sensor registries, privacy impact assessments, and independent review boards all reduce the chance that “we already have a pole” becomes a reason to add unrelated sensing later. These controls are not separate from engineering: they decide where raw data is processed, who can query it, how long it exists, and whether residents can understand the service.
A smart-city platform is successful when a sensor event can be traced from field asset through network, shared city data model, department workflow, resident-facing service, and measured public outcome without locking the city into one vendor or collecting more data than the service needs. The trace should also show the negative case: what the system does when data quality is poor, when a neighborhood is under-covered, when the network is down, or when the requested data use falls outside the approved purpose.
Under the hood, the architecture usually separates field assets, access networks, platform services, department applications, and public release channels. Field assets need signed firmware, secure boot where available, unique device identity, tamper detection for exposed hardware, and a decommissioning process that removes credentials. Access networks need segmentation between operational systems, public Wi-Fi, vendor maintenance access, and back-office services. Platform services need schema validation, time synchronization, deduplication, retention rules, audit logs, and role-based access control.
These controls make the service boundaries enforceable: a retired device must lose access, and a vendor maintenance connection must remain separate from public Wi-Fi. Review the controls alongside the named owner of each layer.

Summary
Austin’s scenario instruments 80% of the named inventory with 14,800 sensors. Its cost ledger totals $2,895,200 upfront and $457,300/year in operations. The large projected return depends on search-time savings and adoption; coverage and completed transmissions cannot establish those benefits by themselves.
The service contract connects each observation to a shared record, a responsible department, a response window, and public evidence. Privacy, security, maintenance, accessibility, and procurement exit rights shape the engineering from the beginning. Review the negative case as carefully as the successful handoff: stale data, missing coverage, network failure, and uses outside the approved purpose all need explicit behavior.
Make the coverage claim, benefit assumptions, and responsible service owner reviewable together. The city’s promise is fulfilled when the evidence leads to a maintained, accountable public service.