4 IoT Application Domains: Requirements and Navigation
More
Depth: Practitioner
Progress saves as you read. Mark sections complete as you go; your progress appears in the sidebar.
- Podcast audio coming soon
- Character narration audio coming soon
4.1 Turn an Operational Problem into Requirements
Two domains can use similar sensors and still need very different systems because one decision can wait hours while another cannot. This chapter compares those requirements so you can choose an architecture and a useful application route. It is part 2 of 2; review IoT Application Domains: Patterns and Collection for the first route. Familiarity with everyday connected products is enough to begin. Overview of IoT supplies the background; detailed networking, architecture and business knowledge can follow later.
Keep the autonomous vehicle and agricultural soil sensor in view. Both collect measurements, but collision avoidance needs a decision while the vehicle is moving, whereas irrigation can use changes observed over hours. The team must translate that difference into latency, reliability, scale, power, data volume and regulation before selecting a platform.
The problem is choosing technology before defining the operational decision. Vendors sell platforms, fear of missing out encourages premature investment, and engineering fascination can displace business outcomes. A success story such as “Company X saved 30% with LoRaWAN sensors” does not establish that LoRaWAN meets another project’s requirements. We will first quantify the response gap, then test assumptions, choose a reading route and examine a focused deployment.
KEY CONCEPTS
- Response deadline
The decision sets how long the system can wait.
- Useful coverage
Sensor density follows the detail the task needs.
- Domain constraints
Power, reliability and regulation narrow the options.
- Measured value
A focused pilot tests improvement against a baseline.
4.2 Learning Objectives
By the end of this chapter, you will be able to:
- compare latency and reliability duties across domains
- diagnose domain-selection misconceptions
- choose an application route from measurable requirements
4.3 Latency Drives Architecture
A latency requirement is the permitted delay before a useful response. The two examples span roughly 6 orders of magnitude:
- Autonomous vehicle collision avoidance: At 100 km/h, the vehicle moves about 27.8 m/s. A 10 ms response window is therefore about 0.28 m of travel before the vehicle can react, which is critical for collision avoidance.
- Agricultural soil sensing: If soil moisture changes by roughly 0.5 percentage points per hour under typical evaporation, reporting every 6 hours captures about a 3 percentage point change, which is still actionable for irrigation.
- Architecture gap: Six hours is 21,600 seconds. Compared with a 10 ms vehicle response window, that is a 2,160,000x difference in latency tolerance.
For this vehicle response budget, edge computing means processing locally to meet a sub-10 ms deadline. The soil-sensing example can tolerate hours and use cloud platforms with LoRaWAN. These are task-specific budgets, not universal deadlines for either domain. Edge Computing develops the processing patterns behind this choice.
4.4 Test the Assumptions Behind the Design
The response gap gives us a way to test four common design assumptions. Here, reliability describes the required dependability of the service, while scale describes how many devices or locations it must support. Set both for the task before comparing products.
Misconception 1: “All IoT applications are basically the same — just sensors sending data to the cloud.” Requirements vary by orders of magnitude. An autonomous vehicle processes gigabytes per day with sub-10 ms latency, while a smart parking sensor transmits a few bytes per hour and tolerates minutes of delay. Treating them as “the same” leads to massively over-engineered or dangerously under-engineered systems.
Misconception 2: “More sensors always means a better IoT system.” Sensor density must match the domain’s spatial and temporal resolution needs. A smart agriculture deployment may need 1 soil moisture sensor per hectare (readings every 30 minutes), while a factory vibration monitoring system needs sensors on every critical bearing (readings at 10 kHz). Adding unnecessary sensors increases cost, power consumption, network congestion, and data storage without improving outcomes.
Misconception 3: “Cloud connectivity is required for all IoT applications.” Many domains operate effectively with edge-only or local processing. Industrial control systems often require deterministic sub-millisecond response that cloud round-trips cannot guarantee. Agricultural sensors in remote areas may use store-and-forward with satellite backhaul on a daily schedule. The connectivity model must match the domain’s latency, reliability, and coverage requirements.
Misconception 4: “Consumer IoT experience transfers directly to industrial or healthcare IoT.” Consumer IoT (smart home, wearables) tolerates occasional failures gracefully — a missed smart light command is an inconvenience. The industrial example demands 99.99% reliability where failures cause production losses of thousands of dollars per minute. For a US medical device, the FDA pathway and need for clinical data depend on its classification and intended use; validation and audit-trail work must be planned for the product. source The regulatory, reliability, and safety requirements across domains are fundamentally different.
These contrasts also explain why Sensor Fundamentals and Networking Fundamentals belong after the task is clear: sensing detail and communication choices must serve the same decision.
4.5 Domain Requirements Calculator
Use the separate domain calculator to compare two domains. Latency ratios above 1000× flag a potentially substantial architecture gap; reliability gaps above 4 percentage points prompt a review of redundancy. Neither threshold alone selects an architecture. Battery life shapes sensor density and cost, while regulation shapes development and certification. Compare Healthcare Monitoring with Smart Home to examine the medical requirements.

4.6 Knowledge Check: IoT Application Domains
4.7 Choose a Route from the Deployment Setting
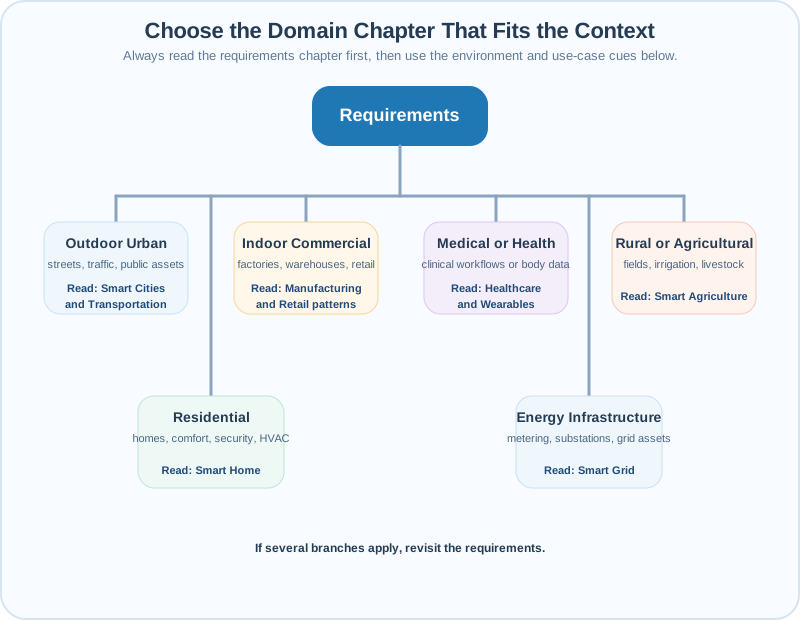
Start with the use case and let its limits narrow the route. Streets point toward cities and transport; commercial interiors toward manufacturing and retail; medical work toward healthcare and wearables. Rural fields point toward agriculture, homes toward building automation, and grid assets toward energy. These are reading routes rather than product labels: mixed projects can follow more than one once their common constraints are clear.
The comparison in Figure 1 uses illustrative calculator values, including a one-hour agriculture interval; that is a 360,000× ratio against 10 ms. It differs from the six-hour example above. Its “Unlimited” vehicle-power label means a supplied-power comparison, not physically unlimited energy, and its broad regulation labels do not replace project-specific review.
Read each domain row across latency, reliability, power, data volume, and regulation before choosing a route. Latency means the response delay used in this comparison. Autonomous Vehicles starts at 10 ms and 99.999% reliability, followed by Industrial Control at 100 ms. Healthcare Monitoring and Smart Grid both show 1 s, while Smart Cities shows 1 min. Agriculture uses 1 h, and Smart Home uses 5 s. Compare each row’s power and reporting needs alongside its regulation label. The worked difference then divides the agriculture interval by the vehicle interval, giving 360,000×. Their reliability gap is 4.999 percentage points; these illustrative values help narrow the design choices.
4.7.1 Start with common constraints
Begin with the operational problem and identify the decision the system must support. Compare latency, reliability, scale, power, data volume and regulatory constraints before selecting a platform or application route. Latency affects whether processing needs to happen locally or can tolerate a cloud exchange. Power and reporting requirements shape battery expectations, while sensor density should reflect the spatial and temporal detail needed for the task. Reliability and regulation also affect design and validation work. Use these requirements to narrow technology choices, then follow the domain chapter that matches the deployment setting. A project spanning several settings may need more than one route.
4.7.2 Streets, traffic and public assets
Smart Cities. Urban infrastructure applications include smart parking, traffic management, street lighting, waste management and structural health monitoring. Choose this route when the operational problem concerns these services or their integration across a city. Start with a measurable service problem, then compare latency, reliability, coverage, power and data requirements before choosing sensors or a platform. The parking example shows how coverage and battery targets can guide connectivity choices, with changes in search time providing evidence of value. City-scale integration belongs within that requirements discussion. For projects that also involve connected vehicles or traffic optimization, the transport route provides a related reading path.
Transport and Connected Vehicles. This route covers Vehicle-to-Everything (V2X) communication, autonomous vehicles, traffic optimization, fleet management and the wider connected mobility ecosystem. Begin by identifying the operational decision and its response deadline. The collision-avoidance example shows why latency matters: a moving vehicle continues traveling during the interval before it reacts. That relationship supports local edge processing for the short response window described in the chapter. Compare reliability, power, scale and data volume alongside latency before choosing an architecture. Use the specific requirements of the mobility task to guide selection. Projects involving urban traffic services may also benefit from the city infrastructure route.
4.7.3 Grid assets, fields and buildings
Smart Grid and Energy. Choose this route for projects involving electrical grid modernisation, smart metering, demand response, renewable integration or energy management systems. Start by defining the operational problem and the decision that connected measurements must support. Compare latency, reliability, scale, power, data volume and regulatory constraints before selecting a platform or connectivity technology. These shared dimensions provide a basis for assessing the particular energy application; the domain label alone does not specify its requirements. Match the reading route to the deployment setting, with grid assets pointing towards energy infrastructure. Where a project also concerns home or building energy management, the building automation route offers related coverage.
Smart Agriculture. Precision farming brings together soil monitoring, irrigation optimization, crop health monitoring and livestock tracking. The useful reporting interval depends on the decision being supported: soil moisture observations can remain actionable over hours, so rapid local processing is not necessarily justified for that task. Remote agricultural deployments may also use store-and-forward communication when continuous connectivity is unavailable.
Sensor density should match the spatial coverage and reporting frequency required by the farming problem. Extra sensors increase cost, power consumption and data storage without necessarily improving outcomes. Agricultural IoT economics therefore belongs alongside the technical design: define a measurable problem, such as wasted water, then compare deployment and operating costs with measured savings before expanding a pilot.
Smart Home and Building Automation. Home energy management, security systems, heating, ventilation and air conditioning optimization, lighting control and commercial building automation form this route. Requirements should follow the particular building task. In the thermostat example, response times measured in seconds, low data volume and an available power supply make Wi-Fi a suitable option; brief outages are acceptable where manual override is available.
That example does not define the requirements of every building application. Identify latency, reliability, power, scale and regulatory needs before selecting a platform. For energy management and lighting projects, compare purchase and operating costs with measured savings to assess payback. Include security in the initial design and test behavior during sensor failures, connectivity outages and cloud unavailability.
4.7.4 Factories, warehouses and retail spaces
Smart Manufacturing and Retail. Industry 4.0 covers connected factory operations alongside predictive maintenance, supply chain visibility, smart packaging and retail analytics. These applications need requirements derived from their operational purpose. Industrial control may require rapid, deterministic local responses, while maintenance decisions can work on daily or weekly timescales. A shared industrial setting does not imply a shared latency requirement.
Predictive maintenance should focus on equipment whose failures create measurable losses. Monitoring machines that already have effective maintenance, or whose replacement costs are low, may add little value. Retail projects likewise need a specific problem, such as losses from empty shelves. Compare reliability, sensor coverage, data volume and costs against that problem, then use a focused pilot to assess savings and workflow fit.
4.7.5 Clinical workflows and body data
Healthcare IoT. Patient monitoring, medication adherence and medical wearables belong to a route that also covers clinical-grade sensors and healthcare data interoperability. Begin with the intended care task and the decisions that depend on its data. Time-sensitive patient alerts can require rapid responses and high reliability, making latency and processing location central design choices.
Consumer device experience does not directly establish suitability for clinical use. Accuracy, safety, privacy and regulatory requirements must be defined for the intended application. For a US medical device, classification and intended use affect the FDA pathway and the need for clinical data; validation and audit-trail work also require planning. Use these requirements to assess sensors, connectivity and integration with existing systems before choosing a platform.
Wearable IoT. Fitness trackers, smartwatches and medical wearables share a device category, but their intended uses can lead to different requirements. This route covers design principles, sensor accuracy and the wearable technology market. Begin by identifying the decision the measurements support, then consider latency, reliability, power, data volume and regulation before selecting components or connectivity.
Consumer wearables may tolerate occasional failures, while a wearable used for clinical monitoring needs requirements appropriate to its care task. Medical classification and intended use can affect regulatory pathways, clinical evidence and validation work. Sensor accuracy therefore needs assessment against the application rather than the product label. A project involving medical wearables can follow both the wearable and healthcare routes once its common constraints are clear.
4.8 Test Value with a Focused Deployment
The requirement comparison must lead to an operational benefit. Consider the chapter’s manufacturing example: a company invested $850K deploying 2,000 vibration sensors across all machines using a cutting-edge AI platform with sub-millisecond anomaly detection. After 18 months, the savings-to-cost multiple was only 0.4x ($340K savings) because:
- 80% of machines had <$10K replacement cost — predictive maintenance was overkill
- Critical machines (15%) already had excellent maintenance — sensors added no value
- Sub-millisecond latency unnecessary — maintenance schedules work on day/week timescales
- Data overwhelmed team — 2,000 machines generated too many alerts to act on
The same example offers a more focused alternative:
Step 1: Identify High-Value Problems
- Analyzed 24 months of unplanned downtime costs
- Found 8 machines (0.4% of fleet) responsible for 72% of downtime losses ($2.4M/year)
- Root cause: Bearing failures on these high-load CNC machines
Step 2: Match Technology to Problem
- Only these 8 machines justified vibration monitoring
- Daily reporting sufficient (no need for sub-ms latency)
- Simple edge FFT + alert-when-anomaly detected (no need for complex AI)
Step 3: Right-Sized Deployment
- Deployed sensors on 8 critical machines only: $25K
- Prevented 4 catastrophic failures in year 1: $600K damage avoided
- Benefit-to-cost multiple: 24x instead of 0.4x
4.8.1 Use the problem → requirements → technology sequence
1. Define the Measurable Problem (before ANY technology discussion)
- What operational issue costs you money TODAY?
- How much does it cost per year?
- How do you measure improvement?
- What is the decision-making process?
Examples with measurable quantities:
- “Parking search traffic wastes 2.5 million driver-hours/year = $30M opportunity cost”
- “Out-of-stock costs $4.20/hour per empty shelf, with 640 incidents/day; estimating $38K/day lost sales also requires each incident’s duration”
- “Unplanned machine downtime on 8 CNC machines = $2.4M/year in lost production”
Examples of poorly-defined problems:
- “We need better visibility into our operations” (too vague)
- “Our competitors are using IoT” (no internal value statement)
- “IoT will transform our business” (technology-first thinking)
2. Extract Requirements from the Problem
- What latency do decisions require? (Minutes? Hours? Days?)
- What sensor density provides sufficient coverage? (80%? 95%? 100%?)
- What data volume must be transmitted? (Bytes/hour? MB/hour?)
- What battery life/power constraints exist? (Mains? 1 year? 10 years?)
- What regulatory environment applies? (Consumer? Healthcare? Industrial?)
3. Match Technology to Requirements (not the other way around!)
- With requirements defined, technology choices narrow from hundreds to 3-5 viable options
- Evaluate each on: cost, maturity, vendor support, integration with existing systems
- Start with pilot on ONE high-value application before scaling
Red Flags That You’re Doing It Wrong:
- “We’re deploying sensors on everything”: This is technology-first thinking; focus first on the top 20% of value.
- “This is what the vendor recommended”: This outsources requirements; define needs internally before platform selection.
- “Everyone is using [technology]”: This follows trends; match the stack to your requirements.
- “We’ll figure out use cases after deployment”: This is hope-based strategy; stop and define problems now.
- “The ROI will come eventually”: This hides unmeasurable value; require hard metrics upfront.
Success Pattern:
- Problem statement: “Parking search costs $30M annually”
- Value metric: “Each 5-minute reduction in search time = $5M/year saved”
- Requirement: “80% sensor coverage minimum for driver trust”
- Technology: “Magnetic sensors + LoRaWAN meets coverage/battery/cost targets”
- Pilot: “Deploy 1,000 spaces in densest downtown area first”
- Measure: “Average search time: 18 min → 6 min after 3 months”
- Scale: “Expand to 15,000 spaces city-wide”
The 24× and 0.4× figures here compare avoided damage or savings with deployment spending; they are benefit-to-cost multiples rather than net-return percentages. IoT Use Cases and Case Studies examines implementation evidence. IoT Business Models Fundamentals develops commercial strategies, while Monetizing IoT Data considers revenue and pricing.
A simple payback calculation divides device cost by monthly savings. The separate calculator lets you change device cost, annual operating spending and efficiency improvement for thermostats, lighting or industrial IoT. Use purchase and operating costs and measured savings for the actual project.
4.9 Apply the Constraints and Plan for Failure
The hospital example makes the selection sequence concrete. A hospital asks for patient alerts within 5 seconds; the ICU example uses alerts reaching nursing stations in less than 1 second. Its stated requirements include sub-second latency, 99.99% reliability, clinical-grade temperature accuracy of ±0.1°C and HIPAA compliance. The chapter compares healthcare wearables costing $500–2,000 with consumer fitness trackers at $50–200. These figures describe the example rather than all products in either category.
A vineyard can use LoRaWAN for hourly soil reports, while the operating-room task needs a communication and processing path that meets its local response requirement. Evaluate Wi-Fi or Bluetooth with local hub processing against that requirement. Do not reject NB-IoT on the claim that it prevents local processing, or assume LoRaWAN inherently takes minutes: the complete path and operating conditions determine whether a deadline can be met.
Before expanding any pilot, avoid three recurring failures. Adding features before validating core user needs can waste weeks; define a minimum viable version and add complexity in response to tested requirements. Treating security as phase 2 leaves hardcoded credentials, unencrypted channels and missing firmware signing expensive to repair. Include security in the first design review because prototype patterns become production patterns.
Finally, test sensor failures, connectivity outages and cloud unavailability. Devices need a safe, locally functional fallback during outages. Measured savings alone do not establish that the system fits the workflow or recovers safely.
Summary
The Five Pillars organize applications as SUSTAIN (cities, buildings and energy), MOVE (transport), HEAL (healthcare), FEED (agriculture) and MAKE (manufacturing). The wider framework contains 14 application domains in six categories: Urban Infrastructure, Environmental, Industrial, Agriculture, Healthcare and Consumer. A shared pattern, such as predictive maintenance transferred to healthcare equipment, still needs sensors, thresholds and regulatory work suited to its new use.
Requirements range from sub-10 ms vehicle response examples to hours for agriculture, from 95% reliability examples in smart homes to 99.999% for safety-critical work, and from mains-powered operation to a 10-year battery target. These ranges frame questions; each project needs its own measurable requirements. Start with the operational problem, compare the six dimensions, then test a focused pilot before scaling.
Start with the pain point, derive requirements, then select technology. The chapter’s 30–40% savings examples depend on addressing measurable waste, downtime or manual inspection work; connectivity alone does not establish value.