17 Retail IoT: Engagement and Inventory
17.1 Start With the Decision
A shelf reports low stock while a beacon offers a nearby shopper a discount. The store must link identity, consent, inventory state, and the action each signal may trigger.
17.2 Route Overview
This is part 2 of 3. Review Retail IoT: Store Value and Smart Shelves for the preceding evidence.
17.3 Learning Objectives
- Compare BLE, smart-shelf, checkout, analytics, RFID, and ESL roles.
- Set consent and identity boundaries for engagement and inventory data.
17.4 Chapter Roadmap
- Checkpoint: Retail Value Pillars
- Figure Guide: Value Timeline
- BLE Beacon Marketing
- Smart Shelf Monitoring
- Figure Guide: Smart Shelf Architecture
- Grocery Smart Shelf Monitoring
- Beacon-Based Customer Engagement
- Figure Guide: Beacon Customer Journey
- Putting Numbers to It
- Personalization vs Surveillance
- Checkpoint: Beacons and Consent
- Checkout Automation Technologies
- Figure Guide: Checkout Selection
- Cut Checkout Abandonment
- Customer Analytics and Heat Mapping
- Figure Guide: Analytics Data Flow
- Pitfall: Analytics Scope Creep
- RFID for Retail Inventory
- Figure Guide: RFID Apparel Workflow
- Putting Numbers to It
- Electronic Shelf Labels (ESL)
- Checkpoint: Inventory Identity
 Checkpoint: Retail Value Pillars
You now know:
- Inventory intelligence targets stockouts and can deliver 5-8% sales lift with 3-5x ROI when focused on the right products.
- Customer experience and checkout gains are different outcomes: beacons can improve conversion by 15-25%, while checkout automation can raise throughput by about 40%.
- Loss prevention and energy management must still protect the customer experience, with shrinkage reductions of 30-50% and energy savings of 20-40% only valuable when operations can act on them.
17.4.1 Retail IoT Value Chain Timeline
Inspect Figure 17.1 to see what evidence each three-month phase must create before the program expands.
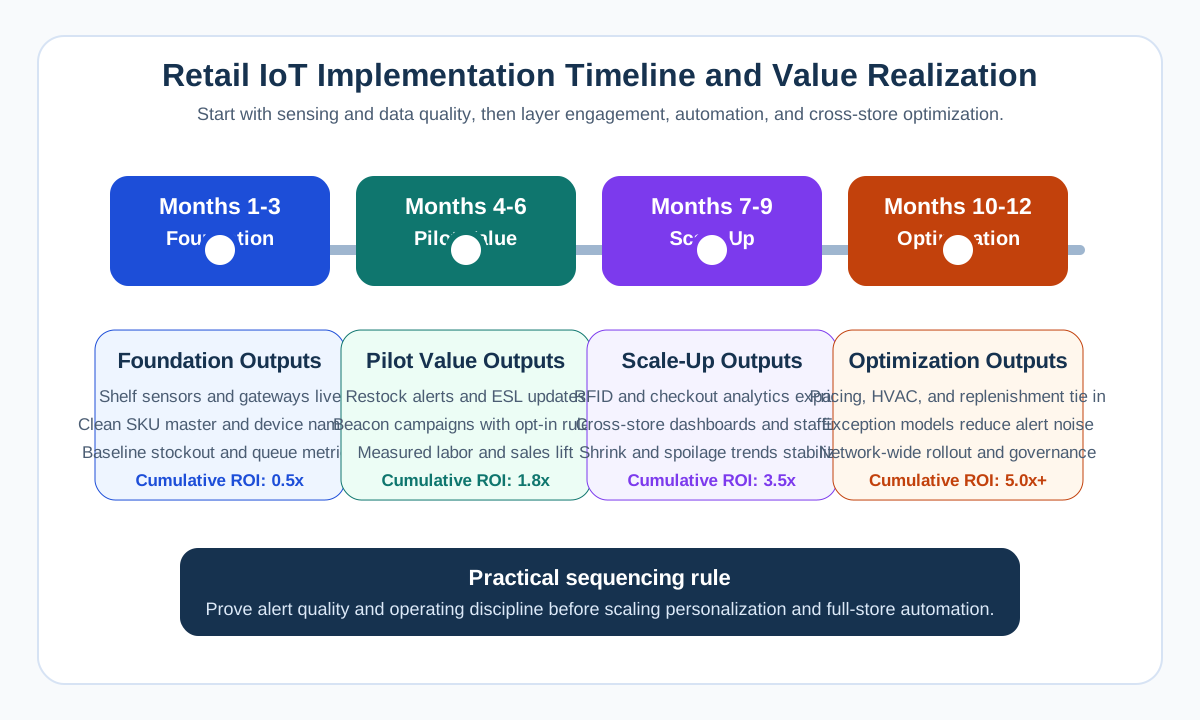
Read Figure 17.1 across the twelve months. Months 1–3 fix shelf-data quality, connect sensors, and establish clean baselines. Months 4–6 run targeted beacon and analytics pilots and compare results with those baselines. Months 7–9 scale only flows that proved value, connect dashboards, and automate routine decisions. The final quarter tunes models, reduces false alerts, and governs the cross-store program. The order protects the rollout from amplifying bad data or an unmeasured pilot simply because the hardware is ready.
Figure Guide: Value Timeline
- Months 1-3, foundation: fix shelf data quality, connect sensors, and establish clean operational baselines.
- Months 4-6, pilot: run targeted beacon and analytics pilots, then compare measured outputs against baseline.
- Months 7-9, scale-up: expand the flows that proved value, connect them to dashboards, and automate routine decisions.
- Months 10-12, optimization: tune predictive models, reduce false alerts, and govern the full cross-store program.
17.5 BLE Beacon Marketing
With the value pillars mapped, follow one customer-facing flow end to end. Beacons are useful because they connect place, permission, and timing; they are risky because the same signal can feel helpful or invasive depending on the rule that fires.
Let’s trace how a grocery store delivers a personalized coupon to a customer’s phone as they approach the cereal aisle:
Step 1: Beacon Installation (Infrastructure Layer)
First, Store installs 50 Bluetooth Low Energy (BLE) beacons throughout store (one per aisle, plus entrances, checkout, deli counter).
Next, Each beacon broadcasts a unique UUID every 100 ms (e.g., Beacon #12 = UUID: f7826da6-4fa2-4e98-8024-bc5b71e0893e).
Then, Beacon transmit power: -12 dBm (range ~5 meters, avoids cross-aisle interference).
After that, Battery life: 2-3 years on CR2450 coin cell.
Figure 17.2 shows what a store is really installing when a floor plan shows fifty dots.

The hardware in Figure 17.2 has been taken apart on purpose. The white square housings and the blue key-fob shells hold the same kind of part, a small round board carrying a radio chip and an antenna. Beside them sits a coin cell, and that cell is the whole power budget behind a multi-year battery claim. The enclosure decides where a unit can be mounted and how hard it is to reopen. The cell decides how often somebody has to return to it. Neither fact appears on a floor plan, which is why a rollout needs a recorded identifier, transmit power, mounting position and a maintenance round before any five metre trigger can be trusted.
Step 2: Customer App (Mobile Layer)
- Customer downloads store’s mobile app and enables Bluetooth + location permissions
- App registers user’s loyalty ID (#98765) and purchase history: frequently buys organic produce, rarely buys branded cereal
- App runs background BLE scanning service (scans every 1 second for nearby beacons)
Step 3: Proximity Detection (App Layer)
- Customer walks past dairy section → App detects Beacon #8 UUID, RSSI = -65 dBm (~3 meters away)
- Customer enters cereal aisle → App detects Beacon #12 UUID, RSSI = -55 dBm (~1 meter away, strong signal = close proximity)
- App uploads to cloud: “User #98765 entered Zone 12 (cereal aisle) at 10:42 AM”
Step 4: Personalization Engine (Cloud Layer)
- Cloud analytics platform receives zone entry event
- Queries user profile: Last 10 trips show $0 cereal purchases but $40/week organic produce
- Checks campaign rules: “Users with <$5 cereal spend + Zone 12 entry → Send 30% off coupon for Nature’s Path organic cereal (high-margin item, aligns with customer preferences)”
- Decision: Send targeted offer
Step 5: Notification Delivery (App Layer)
- Push notification appears on customer’s phone: “30% off Nature’s Path Cereal — Aisle 12, expires in 15 min”
- Customer taps notification → In-app coupon page shows barcode
- Customer adds cereal to basket (acquisition cost: $0.45 for notification delivery vs. $2.50 for mass print coupon)
Step 6: Purchase Confirmation (POS Layer)
- Customer scans coupon barcode at checkout
- POS system validates: Coupon #XYZ123, User #98765, expires 11:00 AM (current time 10:57 AM, valid)
- Discount applied: $5.99 → $4.19 (saved $1.80)
- Store profit: Product cost $2.80, sale price $4.19, margin $1.39 (vs. $3.19 at full price) — margin reduced but customer acquired
Step 7: Attribution and Learning (Analytics Layer)
- Cloud platform logs: Zone 12 entry → notification sent → coupon redeemed in 15 minutes
- Attribution: This customer was not planning to buy cereal (no cereal in last 10 trips), so the $4.19 sale is incremental revenue (not cannibalization)
- ML model updates: “User #98765 responds well to organic/health-positioned offers, poor response to discount-only commodity offers”
Key Insight: The beacon itself is “dumb” (just broadcasts a UUID). All intelligence lives in the app + cloud. The beacon’s job is proximity detection, not marketing logic.
Privacy Tradeoff: This system requires Bluetooth + location permissions, loyalty ID linkage, and purchase history tracking. Customers who disable permissions don’t receive offers. Stores must balance personalization depth (more data = better targeting) with privacy perception (over-tracking causes app uninstalls). Best practice: Transparent opt-in with clear value exchange (“Get exclusive offers” vs. “We track your movements”).
Common Failure Point: Sending too many notifications causes “beacon fatigue.” Industry standard: Max 2-3 notifications per store visit, with 15-minute cool-down between messages. Stores that spam 10+ notifications see 40% app uninstall rates.
17.6 Smart Shelf Monitoring
Smart shelves use sensors to detect product availability in real-time, dramatically reducing the time between a stockout occurring and staff responding.
17.6.1 Sensor Technologies for Smart Shelves
Technology quick reference:
Weight sensors use pressure pads to detect product removal. They are accurate and product-agnostic, but they require shelf modification, which tends to suit high-value items and produce. Light sensors use infrared beams to detect gaps; they cost less and retrofit easily, although customer browsing can create false positives. RFID tags add item-level radio tracking at the cost of tags and reader infrastructure, a trade that often fits apparel and electronics. Computer vision avoids modifying the shelf, but lighting, occlusion, and privacy affect its performance. Capacitive sensors can detect products through shelf material, with humidity becoming the main environmental constraint in uses such as beverage coolers.
Figure 17.3 answers the question the sensor list leaves open: what happens to a gap once the shelf notices it?
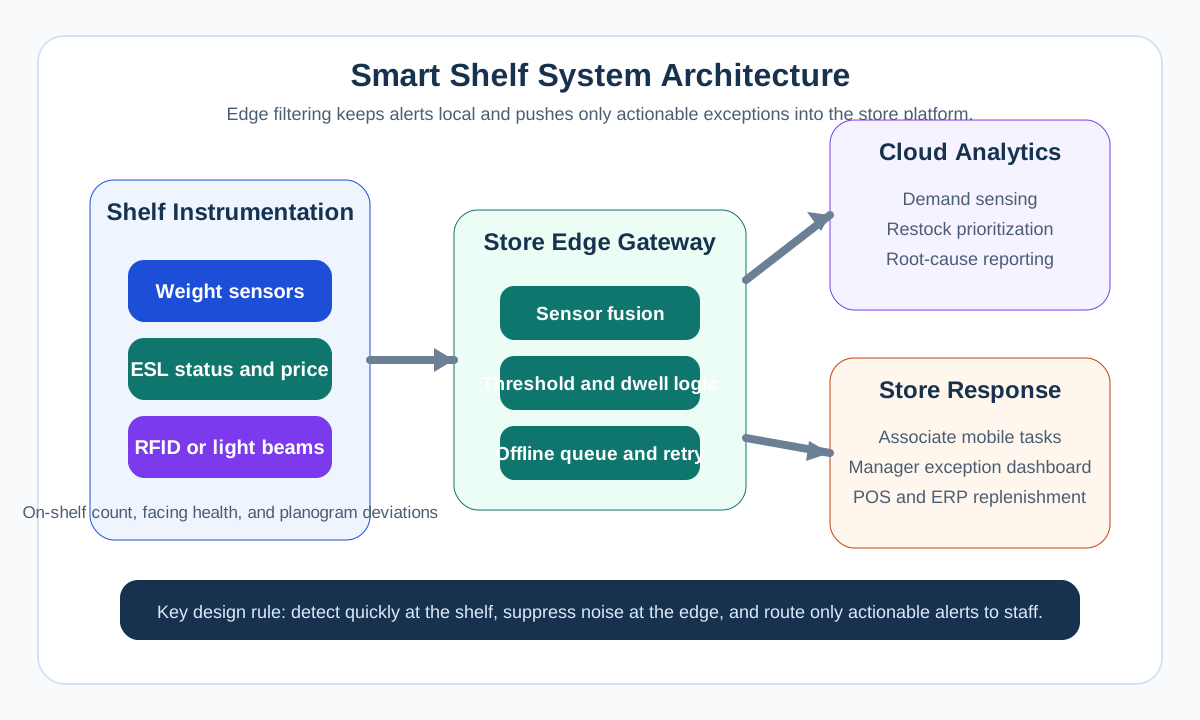
Follow Figure 17.3 from left to right and watch the volume of data fall at every step. The shelf produces a constant stream, because a weight pad or a light beam reacts to every shopper who lifts something and puts it back. The store gateway is where that noise is handled: it fuses the sensors, applies dwell and threshold rules, and queues events when the link drops. Only what survives those rules travels to the cloud, which ranks gaps by what they cost rather than by when they appeared. The last column is the point of the whole chain, because an associate gets a short task list instead of a walk down every aisle.
Figure Guide: Smart Shelf Architecture
- Shelf instrumentation: weight, RFID, light, or capacitive sensors capture item presence and shelf status.
- Store edge gateway: fuses the raw signals, filters noise, and keeps only actionable events.
- Cloud analytics: prioritizes which gaps matter most and decides when staff should intervene.
- Store response: associates receive replenishment tasks instead of manually walking every aisle.
17.6.2 Smart Shelf ROI
17.7 Grocery Smart Shelf Monitoring
Scenario: A regional grocery chain with 85 stores is evaluating smart shelf deployment.
Given:
- Average store: 9,200 active SKUs across 1,450 shelf facings
- Current out-of-stock rate: 7.8%
- Each out-of-stock costs $4.50 in lost sales per hour
- Store operates 16 hours/day
- Manual shelf audits: 2x daily, detecting 55% of stockouts
- Target: Instrument top 500 SKUs (highest velocity)
Sensor Investment:
- Weight sensors: $12/unit installed
- Edge gateway: $450/store
- Cloud platform: $85/store/month
- Total per store: (500 x $12) + $450 + ($85 x 12) = $7,470 Year 1
Benefit Calculation:
- Current detected stockouts: 500 SKUs x 7.8% x 55% = 21.5 SKUs/day
- With smart shelves (95% detection): 500 x 7.8% x 95% = 37 SKUs/day
- Additional detections: 15.5 SKUs/day
- Hours saved per detection: Average 4 hours earlier response
- Daily recovered sales: 15.5 x 4 x $4.50 = $279/day
- Annual benefit per store: $279 x 365 = $101,835
ROI Analysis:
- Year 1 Investment: $7,470
- Year 1 Benefit: $101,835
- Year 1 ROI: 13.6x
Key Insight: Focus on high-velocity items. The top 500 SKUs in a grocery store typically represent 60-70% of stockout losses. Instrumenting 35% of shelf facings captures the majority of value.
17.7.1 Interactive Calculator: Smart Shelf ROI
Read Figure 17.4 for where the money in that calculator comes from, because a weight change only pays off if it ends as a checked action on the shelf.
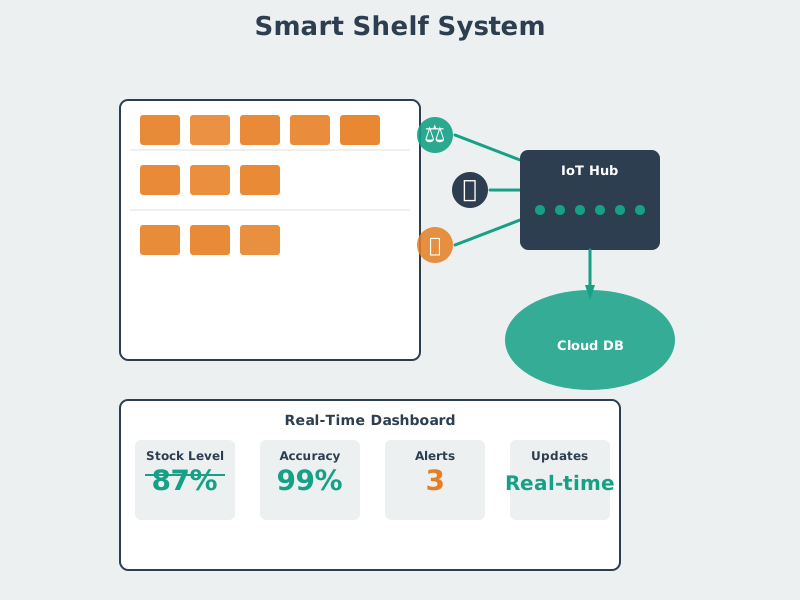
Follow one event through Figure 17.4 from left to right. The shelf senses a weight change, which is a candidate, not a fact. The gateway stage is the one that earns its place: it checks tare and calibration, applies a threshold and a dwell time, drops duplicates, and queues events when the link is down. Only then does the inventory system reconcile the event and give a named owner a shelf check. The last stage is a person confirming it, who either refills the shelf or corrects a bad count. Notice that no stage quietly rewrites the inventory record. The worked panel across the foot shows why that matters, because the return comes from finding real stockouts hours earlier, and every false alert spends that gain.
17.8 Beacon-Based Customer Engagement
Bluetooth Low Energy (BLE) beacons enable location-aware customer engagement, sending personalized offers when shoppers are near relevant products.
17.8.1 How Retail Beacons Work
Figure 17.5 settles a common misreading of this technology by showing exactly where the offer is chosen.
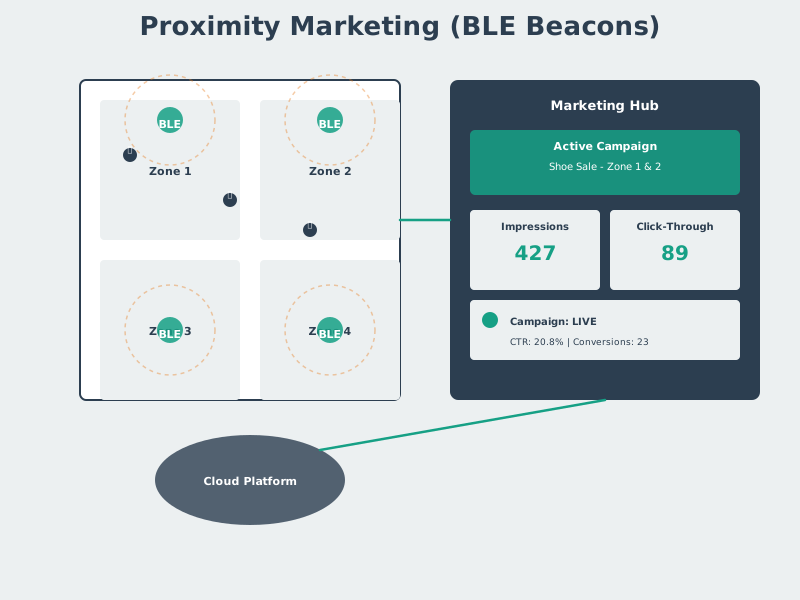
Follow the four numbered stages in Figure 17.5 in order. The beacon only broadcasts an identifier and knows nothing about the shopper. The phone turns that identifier into a zone event, and it does so only when Bluetooth is on and the customer has opted in. The platform then picks an offer from zone, purchase history and campaign rules, and the last stage logs impressions, redemptions and conversions so the campaign can be judged. The band across the bottom is the one to remember. Without consent or access the chain simply stops while the beacon keeps transmitting. Privacy is not a layer added later here. It is the step that decides whether anything reaches the shopper at all.
Figure Guide: Beacon Customer Journey
- Beacons broadcast zone identity near the entrance, departments, displays, and checkout.
- The mobile app detects proximity only for customers who enabled Bluetooth and opted in.
- The marketing platform decides the offer using location, purchase history, and campaign rules.
- The system measures outcomes by logging impressions, click-through, redemption, and conversion.
Beacon interaction patterns:
- Store Entry: Welcome message or loyalty reminder. Requires app opt-in.
- Department Proximity: Category-specific offers. Track location only with permission.
- Product Vicinity: Item-specific deals and recommendations. Make opt-out easy.
- Checkout Approach: Mobile payment prompt or skip-the-line message. Treat payment context as sensitive.
- Exit: Thank-you message, feedback request, or return offer. Limit to post-visit engagement.
17.8.2 Beacon Placement Strategy
Placement guide:
- Entrance: 2-3 beacons for welcome messages and basket-size influence. Example: “Welcome! Today’s deals in Aisle 5.”
- High-Margin Departments: About 1 beacon per 200 sq ft for conversion optimization. Example: “Wine pairs with your cheese selection.”
- Promotional Displays: 1 beacon per display for campaign tracking. Example: “Flash sale: 30% off this display only.”
- Checkout: 3-4 beacons for queue management and mobile-pay prompts. Example: “Skip the line with mobile checkout.”
17.9 Putting Numbers to It
Consider a 25,000 sq ft retail store deploying BLE beacons. Based on the placement strategy:
- Entrance beacons: 3.
- High-margin departments: 25,000 / 200 x 0.4 = 50 beacons.
- Promotional displays: 15 beacons.
- Checkout area: 4 beacons.
- Total beacons: 3 + 50 + 15 + 4 = 72 beacons.
- Total cost: 72 x USD 15 plus USD 850 cloud platform = USD 1,930.
If beacon-triggered offers increase conversion by an illustrative 18% relative lift for 8,000 monthly visitors, assuming a 50% baseline conversion rate and a USD 45 average basket, annual lift is 8,000 x 12 x 0.50 x USD 45 x 0.18 = USD 388,800. Capturing 1% of this lift yields USD 3,888 and about 102% net first-year ROI against the USD 1,930 investment.
17.9.1 Beacon Deployment Calculator
17.10 Personalization vs Surveillance
Option A: Full tracking of customer movements through the store enables sophisticated personalization and heat-map analytics - but creates “surveillance store” perception and regulatory risk under GDPR/CCPA.
Option B: Zone-only detection (entrance, department, checkout) provides useful analytics with minimal intrusiveness - but limits personalization depth and cross-sell opportunities.
Decision factors: Customer demographics (younger shoppers accept more tracking), competitive positioning (luxury vs. discount), regulatory environment, and available consent mechanisms.
Checkpoint: Beacons and Consent
You now know:
- A beacon only broadcasts zone identity; the app and cloud decide whether an opted-in shopper should receive an offer.
- A 25,000 sq ft store example uses 72 beacons and USD 1,930 first-year cost, so the business case depends on measured redemption, not hardware novelty.
- Beacon fatigue is an operating limit: cap notifications at 2-3 per visit, apply cool-downs, and make opt-out easy before personalization becomes surveillance.
17.11 Checkout Automation Technologies
We have handled the most personal customer signal in the chapter. The next set of systems shifts to store throughput, inventory truth, price accuracy, shrinkage, and energy - areas where the data may be less intimate but the operational integration is just as important.
Modern retail checkout spans a spectrum from traditional cashier lanes to fully automated walk-out stores.
Look at Figure 17.6 for how many separate sensing and decision points one customer-operated lane really holds.

The sign above the kiosk in Figure 17.6 is a design decision rather than decoration: six items, card only. That limit exists because the rest of the station is slow and error-prone at scale. The screen leads an untrained shopper through one step at a time. Below it, the scanner reads the barcode, the card terminal takes payment, and the flat shelf to the right weighs what was bagged against what was scanned. Each of those is a place the sale can stall. This is why self-checkout throughput sits below a staffed lane in the comparison that follows: the customer is doing the work the cashier used to do.
17.11.1 Checkout Technology Comparison
Technology comparison:
- Traditional Cashier: Manual barcode scanning, 15-20 items/min, 99.9% accuracy, high labor cost.
- Self-Checkout: Customer scans items, 8-12 items/min, 97-99% accuracy, medium cost.
- Scan-and-Go: Customer scans with phone, 20+ items/min, 95-98% accuracy, low cost.
- RFID Tunnel: Bulk scan of all items at once, 100+ items/min, 99.5% accuracy, high tag cost.
- Computer Vision: AI tracks items taken, effectively unlimited throughput, 95-99% accuracy, high infrastructure cost.
Inspect Figure 17.7 to choose a checkout path from basket size, tagging, and customer behavior rather than automation alone.
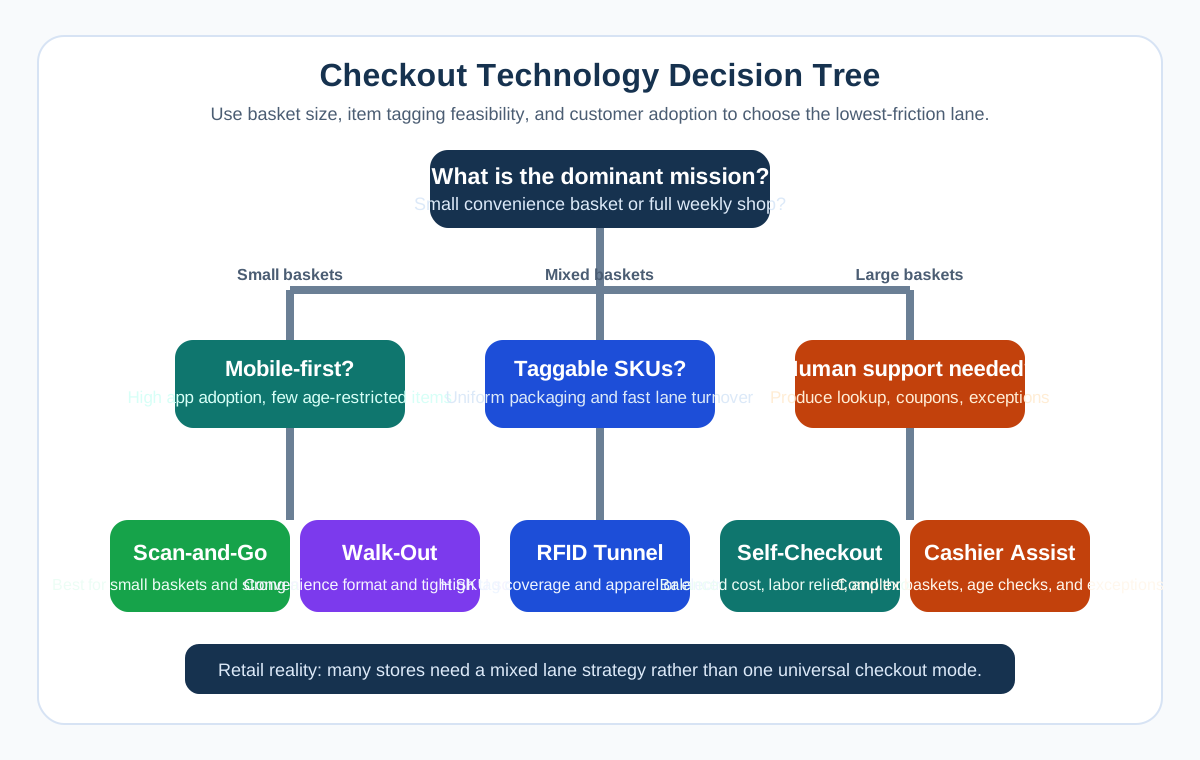
Begin Figure 17.7 with the dominant mission. A small basket and strong app adoption can favor mobile scan-and-go at more than 20 items per minute. Tagged goods and a fast-lane goal can justify RFID bulk scans above 100 items per minute, while mixed baskets often fit self-checkout’s 8–12 items per minute and moderate cost. Large or exception-heavy shops still need assisted lanes. Computer vision removes the scan step but adds high infrastructure cost. Throughput matters, but accuracy, tag feasibility, exceptions, and customer access decide the fit.
Figure Guide: Checkout Selection
- Small baskets + strong app adoption: start with scan-and-go or mobile-first checkout.
- Tagged SKUs and fast lane throughput needs: RFID tunnel or assisted RFID checkout can fit.
- Mixed baskets and moderate complexity: self-checkout usually offers the best balance.
- Large baskets or complex exceptions: keep cashier-assisted lanes in the mix instead of forcing full automation.
17.11.2 Self-Checkout Optimization
17.12 Cut Checkout Abandonment
Scenario: A home improvement retailer experiences high self-checkout abandonment rates.
Given:
- 12 self-checkout kiosks per store
- Current transaction time: 4.1 minutes average
- Abandonment rate: 22% (customers leave line or switch to cashier)
- “Unexpected item” false alarms: 31% of transactions
- Average basket value at self-checkout: $67.80
Problem Analysis:
- “Unexpected item” alarms cause 68% of abandonments
- PLU lookup for produce causes 18% of abandonments
- Payment issues cause 14% of abandonments
IoT Solution:
- Deploy ML-enhanced weight sensors with adaptive calibration
- Install computer vision for automatic produce identification
- Add NFC payment for faster transaction completion
- Implement predictive queue management
Results:
- False alarms: 31% to 8%
- Transaction time: 4.1 min to 2.3 min
- Abandonment rate: 22% to 9%
- Throughput increase: 78%
- Annual recovered revenue per store: $312,000
Key Insight: The highest-ROI intervention is reducing false alarms, not speeding up scanning. A frustrated customer who abandons represents $67.80 lost; a customer who takes 30 extra seconds still completes the purchase.
Inspect Figure 17.8 to connect the main causes of abandonment with the interventions and measured results.
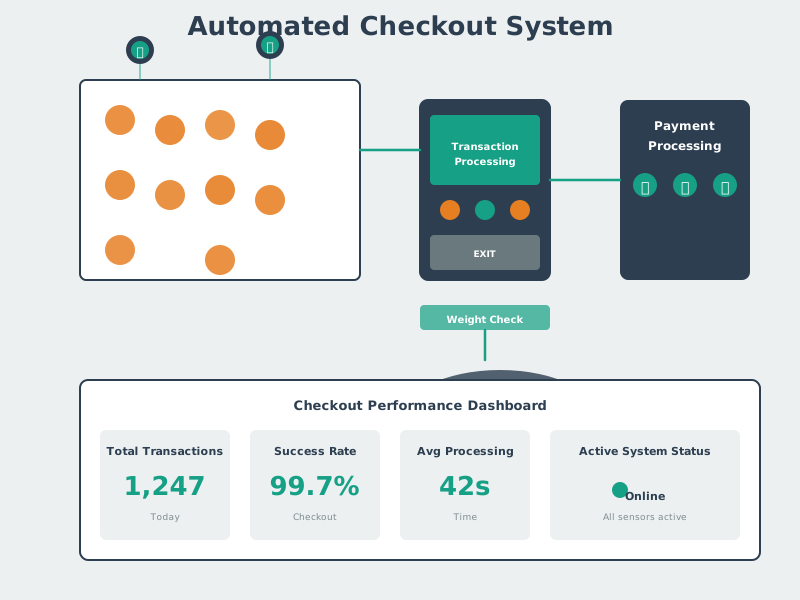
Read Figure 17.8 from the friction profile into the four changes. Unexpected-item alarms account for 68% of reported abandonments, so adaptive weight calibration and vision address the largest cause; NFC and queue management target payment and waiting. The results then compare like measures before and after. Transaction time falls from 4.1 to 2.3 minutes, so the time ratio is 4.1 ÷ 2.3 ≈ 1.78, consistent with the reported 78% throughput gain. The case ties the technology choice to customer flow, not novelty.
17.13 Customer Analytics and Heat Mapping
IoT sensors enable detailed understanding of customer behavior within the store, optimizing layouts and staffing.
17.13.1 Customer Analytics Technologies
Analytics technology guide:
People counters measure entry, exit, and direction with relatively low privacy risk when the data remains anonymous; typical accuracy is 95–99%. Wi-Fi probe requests estimate device presence and dwell time, but MAC addresses create a medium privacy risk and typical accuracy falls to 70–85%. Video analytics can measure paths and demographics at 90–95% typical accuracy, with a higher privacy risk because facial features may be captured. Beacon detection provides precise location for opted-in app users and typically reaches 95–99% accuracy. Thermal cameras estimate heat signatures and crowd density without requiring identity, with typical accuracy of 85–95%.
Inspect Figure 17.9 to see how traffic and dwell signals become store decisions without preserving unnecessary identity.
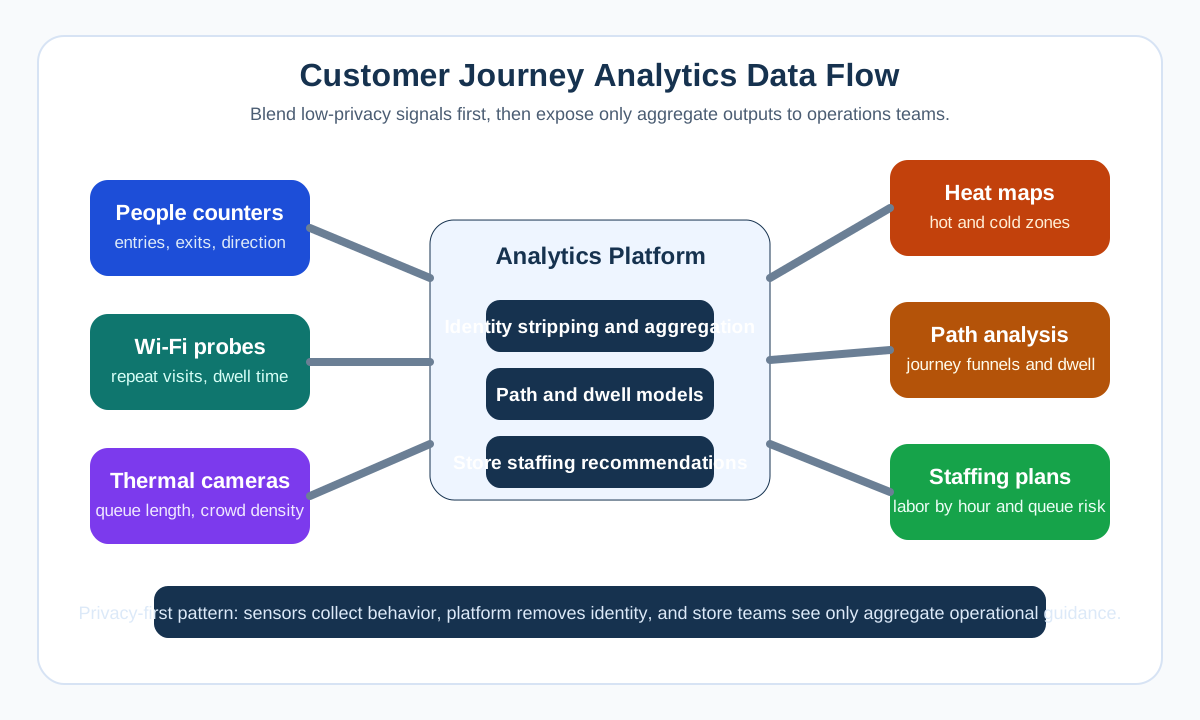
Follow one shopper event. Check where identity joins it. Read Figure 17.9 from sensor inputs to aggregate outputs. Anonymous people counters can estimate entry, exit, and direction with relatively low privacy risk. Wi-Fi presence adds dwell evidence but raises risk when MAC addresses remain linkable; app beacons should cover only opted-in users, while thermal sensing can describe crowds without identity. The analytics boundary strips identity where possible, aggregates paths, and calculates dwell or congestion. Staffing and layout decisions should consume those group patterns, not a hidden customer dossier, so the privacy guardrail belongs before the operational output.
Figure Guide: Analytics Data Flow
- Sensor inputs: people counters, Wi-Fi probes, thermal cameras, and app beacons capture traffic and dwell signals.
- Analytics platform: strips identity where possible, aggregates paths, and calculates dwell and congestion patterns.
- Operational outputs: heat maps, path analysis, and staffing recommendations guide store decisions.
- Privacy guardrail: anonymous aggregate insight usually delivers most of the value with far less risk.
17.13.2 Privacy-First Analytics Design
17.14 Pitfall: Analytics Scope Creep
The Mistake: Starting with anonymous foot traffic counting, then gradually adding facial recognition, demographic profiling, and cross-store tracking without updating privacy policies or customer consent.
Why It Happens: Each incremental capability seems like a small addition. Analytics vendors bundle features. Marketing teams request “just one more data point.”
The Fix:
- Define data collection scope BEFORE deployment
- Implement technical controls (e.g., blur faces on video analytics)
- Regular privacy audits with external review
- Customer-facing transparency (signage, privacy policy)
- Data retention limits (delete raw video within 7 days)
17.15 RFID for Retail Inventory
Radio Frequency Identification (RFID) provides item-level tracking, transforming inventory accuracy from ~65% (barcode-based) to ~98% (RFID-based).
17.15.1 RFID Retail Applications
Application guide:
Start with the item and the decision it must support. Apparel tracking and fitting-room analytics can use low-cost UHF passive tags across roughly 3-10 m because inventory accuracy, theft reduction, try-on evidence, and smart-mirror interactions benefit from room-scale reads. High-value electronics use the same UHF reach with added security features because loss prevention and authenticity matter more than the lowest tag cost. Pharmaceutical workflows can favour shorter-range HF passive tags when a deliberate read supports compliance and counterfeit checks. Fresh food may justify more expensive UHF sensor tags because freshness and waste decisions need condition data as well as identity. These are selection arguments, not fixed prices: the release record should preserve frequency, read geometry, item material, regional rules, and the operational outcome that repays the tag and reader estate.
Inspect Figure 17.10 to follow one item identity from factory tagging through store events to point-of-sale reconciliation.
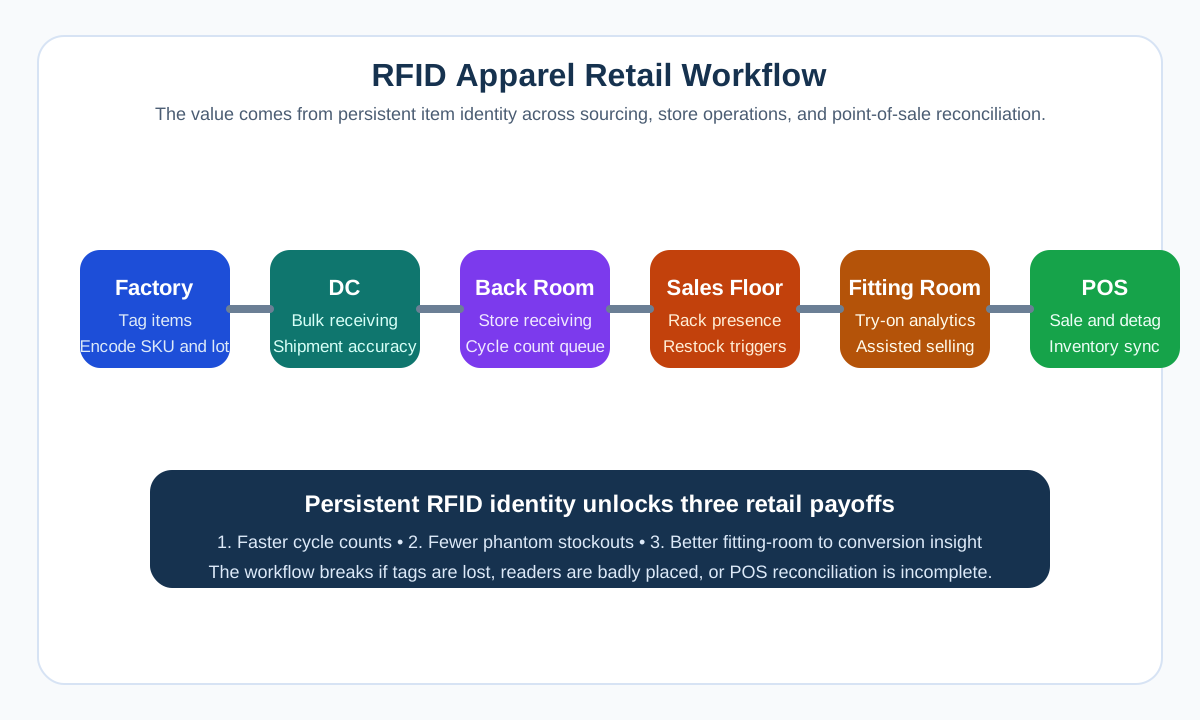
Track one tag from factory to sale. Check every handoff. In Figure 17.10, move from Factory and Tag items to the distribution-centre and store stages, then finish at fitting-room and point-of-sale reconciliation. The same identifier supports different decisions at each boundary, so reader placement and event ownership matter as much as tag range. This connects the application guide to a release test: prove that the chosen tag and reader estate preserves item identity across the full workflow that creates the claimed retail value.
Figure Guide: RFID Apparel Workflow
- Factory: apply the RFID identity at source.
- Distribution center: use bulk reads for receiving and shipment accuracy.
- Back room: reconcile stock before items reach the sales floor.
- Sales floor and fitting room: monitor presence, replenishment gaps, and try-on behavior.
- Point of sale: reconcile the tag against the sold item and close the inventory loop.
17.15.2 RFID ROI in Apparel Retail
Before-and-after snapshot:
- Inventory Accuracy: 65-75% before RFID, 95-98% after deployment, roughly +30 percentage points.
- Out-of-Stock Rate: 8-12% before RFID, 2-4% after deployment, about 70% lower.
- Sales Lift: Baseline before RFID, typically +3-8% after deployment.
- Shrinkage: 2-3% before RFID, 1-1.5% after deployment, about 50% lower.
- Cycle Count Time: 8 hours before RFID, about 30 minutes after deployment, roughly 94% faster.
17.16 Putting Numbers to It
Consider an apparel retailer with USD 50M annual revenue deploying RFID across 120,000 inventory items at USD 0.05/tag.
- Tagging cost: 120,000 x USD 0.05 = USD 6,000.
- Infrastructure: 25 readers x USD 2,500 plus USD 15,000 software = USD 77,500.
- Total investment: USD 6,000 + USD 77,500 = USD 83,500.
Annual benefits from reducing out-of-stock from 10% to 3%:
- Sales recovery (illustrative): If measured lost sales attributable to stockouts fall from USD 5,000,000 to USD 1,500,000, recovered sales are USD 3,500,000. These lost-sales inputs are scenario assumptions.
- Shrinkage reduction: USD 50,000,000 x (0.025 - 0.0125) = USD 625,000.
- Labor savings: 8 hours weekly x 52 x USD 25/hr = USD 10,400.
Total first-year benefit is USD 4,135,400. ROI is (USD 4,135,400 - USD 83,500) / USD 83,500 = 4,853%, or roughly a 48x return.
17.16.1 RFID ROI Analysis
17.17 Electronic Shelf Labels (ESL)
Electronic shelf labels enable dynamic pricing, reducing labor costs and enabling real-time promotional campaigns.
17.17.1 ESL Technology Comparison
Display technology guide:
- e-Paper (EPD): Black/white/red display, 5-7 year battery life, 30-120 second updates, about $8-15 per label.
- LCD: Full-color display, 2-3 year battery life, under 5 second updates, about $15-30 per label.
- e-Paper Color: 7-color display, 3-5 year battery life, 60-180 second updates, about $20-40 per label.
- LED Segment: Numbers-only display, 3-5 year battery life, under 1 second updates, about $3-8 per label.
Figure 17.11 shows the display comparison as it appears on a real aisle rail.

Two labels sit on the rail in Figure 17.11, and both are black-and-white e-paper holding their image with no power drawn between updates. That is the trade the table describes: slow refresh, years of battery life, and a price that stays readable under aisle lighting and at an angle. Look at what each label carries besides the price. The unit price, the origin, and the barcode all have to match the product directly above it, so association is an operations problem, not a display problem. Move the oranges one metre and the price is wrong, even though every update arrived correctly.
17.17.2 ESL Use Cases
Use-case guide:
- Dynamic Pricing: Time-of-day or demand-based pricing tied to the pricing engine.
- Flash Sales: Instant promotional updates across the store driven by the campaign management platform.
- Competitor Matching: Real-time price adjustment supported by market-intelligence integration.
- Markdown Optimization: Automated clearance pricing based on inventory-aging algorithms.
- Omnichannel Consistency: Match online prices instantly through e-commerce platform sync.
- Planogram Compliance: Visual verification through LED indicators connected to the planogram system.
Checkpoint: Inventory Identity
You now know:
- RFID is strongest when no-line-of-sight bulk reads matter: apparel inventory can move from 65-75% accuracy to 95-98% after deployment.
- The RFID economics in this chapter depend on item value and category fit: USD 0.03-0.08 tags suit apparel better than a USD 0.75 grocery item.
- ESLs solve a different identity problem: keeping price, promotion, markdown, and planogram information synchronized at the shelf edge.
17.18 Continue to the Next Part
Carry this evidence into Retail IoT: Loss Prevention and Operations, which begins with Loss Prevention IoT.