11 Smart Cities: Service Envelopes and Initiatives
More
Depth: Practitioner
Progress saves as you read. Mark sections complete as you go; your progress appears in the sidebar.
- Podcast audio coming soon
- Character narration audio coming soon
11.1 Start With the Public Decision
A parking sensor reading matters only if the city knows its age, zone, owner, and allowed use. A service envelope states the public outcome, accountable workflow, sensing requirements, governance rules, technology choices, and failure behavior before a dashboard is built.
This is part 2 of 3. Smart Cities: Service Foundations established the preceding evidence. Here, the running example is parking guidance: a driver needs an available space, while the city needs evidence that guidance reduces searching. An occupancy reading cannot support that decision if it is stale or detached from the current curb rule.
The problem is to connect field evidence to an accountable public service. We will first write its envelope, then compare nine city initiatives by public outcome and data boundary, and finally test the parking example against search-time, sensor, data-volume, and battery constraints.
KEY CONCEPTS
- Public outcome
Name the decision and the resident experience that should improve.
- Accountable owner
Connect each observation to an operator and a response.
- Field evidence
Test coverage, freshness, accuracy, and degraded behavior.
- Data boundary
Set access, retention, privacy, and public-release rules.
11.2 Learning Objectives
- Write a smart-city service envelope with owners, limits, and evidence.
- Compare nine city initiatives by public outcome and data boundary.
11.3 Write the Envelope Before Choosing Vendors
For a city project, write a one-page service envelope before selecting vendors. Start with the public outcome in plain terms: reduce cruising for parking, lower lighting energy use without reducing perceived safety, reduce missed waste pickups, detect flood risk earlier, or improve air-quality planning. Then identify the operator who acts on the data and the resident or visitor who experiences the service. If nobody is accountable for changing a route, dispatching a repair, adjusting a signal plan, or publishing an alert, the IoT system is likely to become a passive dashboard.
Next turn the outcome into measurable constraints. Parking guidance may need high space coverage, update freshness, curb-zone changes, and clear uncertainty labels. Street lighting may need photometric safety criteria, maintenance ticket integration, controller standards such as DALI-2 or ANSI C136.41/NEMA-style roadway lighting interfaces, and a policy for when adaptive dimming is allowed. Waste management may need fill-level calibration, rugged enclosures, truck-route integration, and a threshold for when a skipped bin creates service risk. Air-quality monitoring may need sensor placement rules, calibration against reference monitors, metadata about weather and siting, and a public communication policy that prevents overclaiming low-cost sensor precision.
Technology choices become easier after that. LoRaWAN can fit low-rate battery sensors across city assets when gateway placement and downlink limits are acceptable. NB-IoT or LTE-M can fit dispersed assets where carrier coverage and recurring connectivity cost are acceptable. Fiber, Ethernet, or municipal Wi-Fi may suit fixed cameras or traffic corridors with power and backhaul. FIWARE NGSI-LD, OGC SensorThings API, GTFS-realtime for transit feeds, and GIS asset identifiers can make data reusable across departments when they are used as contracts rather than marketing terms.
Before scaling, set a pilot gate. The pilot should prove field installation time, sensor accuracy, data freshness, privacy controls, open-data behavior, operator workflow, support tickets, and maintenance cost. It should also test non-technical risks: whether the service works for neighborhoods with different connectivity, income, accessibility, language, lighting, and transit conditions. A pilot can fail because nobody owns the response, even when the sensors work.
11.4 Smart City Service Envelope
- Name the public service outcome. State the municipal decision or resident experience the system should improve.
- Map the accountable workflow. Identify the department, operator, maintenance crew, vendor, and public audience affected by the data.
- Set the sensing contract. Define coverage, freshness, accuracy, calibration, confidence labels, and offline behavior.
- Set the governance contract. Define data owner, retention, privacy review, access control, open-data release, and audit evidence.
- Choose the technology stack. Compare network, device, data model, API, dashboard, and operations choices against the service envelope.
- Run the public failure test. Explain what residents and operators see when data is missing, delayed, wrong, sensitive, or contested.
A small deployment makes these requirements concrete. A smart-bin pilot starts with fill-level accuracy, battery life, collection-zone coverage, and route-change evidence before it claims city-wide waste savings.
As the scope grows, a parking guidance service adds curb-rule updates, stale-data labels, payment-zone integration, equity review, and driver trust measurements before scaling from a district to the whole city.
Across services, a multi-service operations platform uses FIWARE NGSI-LD or OGC SensorThings-style data contracts, GIS asset ids, role-based access, retention rules, and incident workflows so parking, lighting, waste, traffic, and air-quality services can share context without losing accountability.
11.5 Preserve Context and Boundaries
The parking guidance envelope needs more than an occupied/free value. It must keep the space, curb rule, observation time, confidence, and permitted use together. Shared city infrastructure makes that context reusable, provided each service retains an accountable owner.
A smart-city platform must preserve context across many layers. A parking event is not just occupied or free; it may need space id, curb rule, timestamp source, sensor confidence, maintenance status, payment-zone relation, and whether the observation is stale. A lighting event may need pole id, circuit, luminaire type, controller firmware, dimming schedule, fault code, work-order id, and safety exception. A waste event may need bin id, fill estimate, collection zone, contamination flag, route plan, and season. Without those fields, cross-domain integration becomes a pile of charts rather than an operating system for city services.
Standards help when they carry that meaning. FIWARE NGSI-LD models city entities and relationships as linked data, which can help describe assets, observations, locations, and ownership across services. OGC SensorThings API provides a structured way to expose Things, Datastreams, Sensors, Observations, and Locations for sensing systems. MQTT and CoAP can move messages from constrained devices, but they do not by themselves define what a curb space, light pole, air-quality reading, or waste-bin alert means. The schema, metadata, and governance rules are the system contract.
Privacy and cybersecurity are also architectural, not afterthoughts. Video analytics may need edge processing that emits counts or events instead of raw footage. Mobility data may need aggregation, k-anonymity-style thresholds, differential privacy techniques, or strict access controls before publication. Device fleets need provisioning, credential rotation, firmware update policy, tamper handling, network segmentation, audit logging, and incident response. Open-data portals need review rules so public transparency does not leak personally sensitive or security-sensitive detail.
For deeper review, test the platform against failures: gateway outage, SIM lifecycle mistake, dead battery, vandalized sensor, changed curb rule, unavailable vendor API, stale public map, biased sensor placement, over-retained video, and emergency override. A mature smart-city architecture makes those states visible to operators and understandable to residents. The point is not to centralize every system. The point is to make shared services interoperable while keeping the accountability boundary clear.
11.6 Smart City Governance Contract
For the layered workflow, use Smart City Service Governance Contracts, covering public-service outcomes, shared city data models, field-asset pipelines, data governance, privacy, cybersecurity, procurement, and maintenance boundaries.
11.7 Compare Nine Initiatives and Their Shared Infrastructure
Inspect Figure 1 to see how several city sensor domains share connectivity and platform services without becoming one application.

Read Figure 1 from parking, traffic, light, and waste sensors. Several networks can carry their data. The choice depends on range, rate, power, and city control. The data platform then handles streams, storage, and shared facts about each asset. It must keep sensor records, media, and registry data distinct. Traffic, waste, air, and energy services use those outputs for different goals. Shared pipes can cut repeated work. Each team still needs its own data-access, retention, accountability, and response rules.
- Smart Parking: monitoring parking-space availability in the city.
- Structural Health: monitoring vibrations and material conditions in buildings, bridges, and historical monuments.
- Noise Urban Maps: monitoring sound levels in bar areas and central zones in real time.
- Smartphones Detection: detecting Wi-Fi or Bluetooth devices such as phones when policy allows it.
- Electromagnetic Field Levels: measuring energy radiated by cell sites and Wi-Fi routers.
- Traffic Congestion: monitoring vehicle and pedestrian levels to optimize driving and walking routes.
- Smart Lighting: adapting street lighting to weather, time, faults, and presence.
- Waste Management: detecting rubbish levels in containers to optimize collection routes.
- Smart Roads: warning drivers about weather, incidents, and diversions.
Inspect Figure 2 to locate the shared data contract that lets separate city services reuse context responsibly.

Begin Figure 2 with facts from parking, traffic, lights, waste, and air sensors. They meet through a shared data contract. That contract needs clear fields, context, rules, and stable asset IDs. FIWARE NGSI-LD or OGC SensorThings can supply the exchange model. Intake and an API gateway then allow controlled reuse. The platform carries responsibility for controlled reuse; it need not centralize every city system. Each city service keeps its own owner even when another team can use its data.
11.8 Verizon Smart Cities Taxonomy
The Verizon Smart Cities Taxonomy organizes initiatives by functional domain rather than specific application:
- Energy: smart buildings, predictive maintenance, and outage management share building-management systems and power-grid sensors.
- Utility: water and gas monitoring, equipment control, and emergency response share SCADA systems and municipal networks.
- Vehicle: parking, EV charging, and traffic enforcement share street-level sensors and payment systems.
- Transit: fleet management, passenger information, and asset tracking share GPS networks and real-time feeds.
- Public Safety: emergency alerts, adaptive lighting, and policy-approved surveillance share camera networks and city-wide communications.
Grouping by functional domain helps identify shared infrastructure: a parking sensor gateway can also serve EV chargers. It also reveals common stakeholders, such as the transportation department across Transit and Vehicle, and integration opportunities, such as street light poles shared by Energy and Public Safety.
The service envelope told you what must be true before deployment. The next sections pressure-test that idea against one high-friction service where stale or incomplete data immediately affects the driver’s decision: parking guidance.
11.9 Test Parking Guidance Against Search Time
The Hidden Cost of Parking Search:
One of the most overlooked sources of urban congestion is “cruising” - drivers circling blocks searching for available parking spots. The evidence needs a stated location and measurement period:
- Parking-search estimate: SFMTA has described traffic from drivers circling for parking as close to one third in an SFpark explanation; the share should be measured for each city and time period. SFMTA
- Local surveys: Parking-search time can vary widely within one city, so report the survey location and time bands when estimating demand for guidance.
- San Francisco: In the SFpark pilot areas, SFMTA reported that average parking-search time fell by five minutes, or 43%, after the pilot measures. SFMTA evaluation
- Los Angeles: UCLA research reported about 3.3 miles of cruising per parking attempt.
Why This Matters for IoT:
The “cruising” problem offers several reasons to test IoT guidance:
- Real-time data is essential: Static parking maps cannot show current availability; spaces change minute-to-minute
- Small sensors, useful data: Parking-occupancy data can guide drivers toward available spaces; evaluate search time and traffic effects across the whole deployment.
- Network effects: The more sensors deployed, the more valuable the system becomes
- Multiple stakeholders win: Drivers save time, cities reduce emissions, businesses gain foot traffic
Simple math: If a city has 50,000 parking spaces and each space turns over 5x/day, that’s 250,000 parking events. If IoT guidance saves just 5 minutes per event, that’s 20,000+ hours saved daily (about 20,833 hours). This is potential search time saved; it does not establish an equivalent number of cars removed from roads.
11.10 Choose Sensors Within the Service Limits
The search-time outcome depends on reliable occupancy evidence. Compare how each sensor obtains that evidence, what the field installation demands, and which data boundaries it creates.
Figure 3 shows the same ranging trick a parking bay uses, in a package most learners have already touched.

The visible sensor in Figure 3 is the small disc set into the bumper. It sits flush with the panel, with no raised housing to collect dirt or change the beam. The disc both sends a pulse and listens for the echo, and the gap between the two gives distance. That is the whole measurement. Everything else in the frame is context the sensor cannot see: paint, body curve, weather and whatever happens to be behind the car. A kerbside bay sensor faces the same limits with a harder job, because it must survive rain, grit and a vehicle parked on top of it while still separating a full bay from an empty one.
Two photos show what a bay sensor looks like once it is installed. Figure 4 shows an in-ground unit and Figure 5 an overhead one.
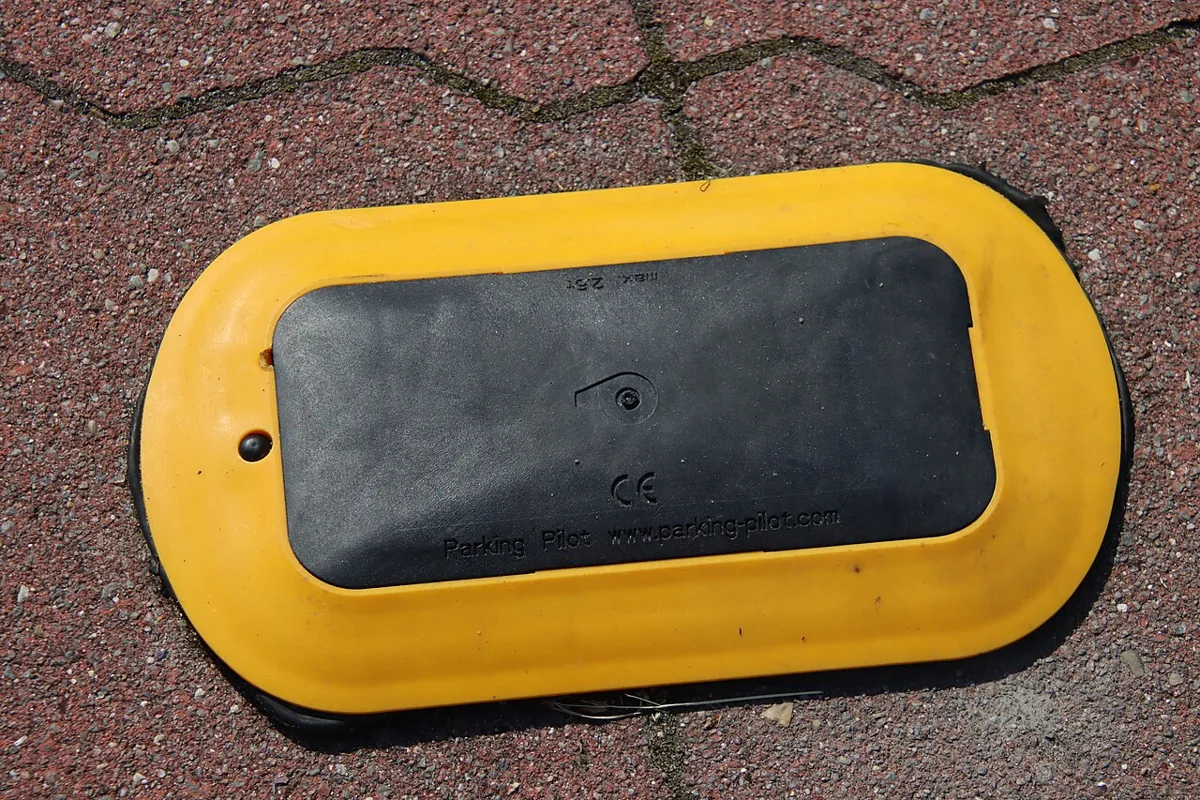
The in-ground unit sits at the level of the surface and is driven over, so its cover has to survive wheels, water, and grit. Nothing on top shows what it senses, which is why the data sheet matters more than the picture.
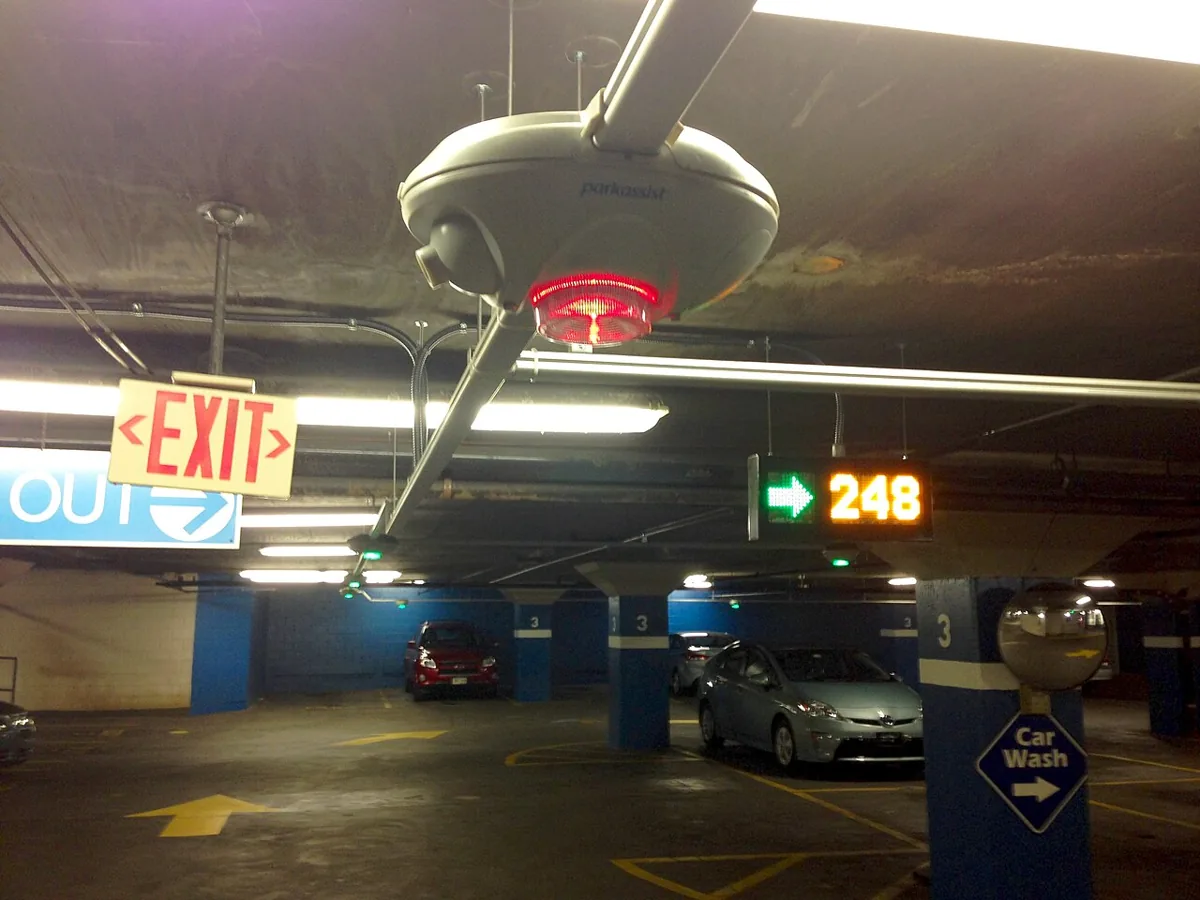
The overhead unit watches from above, so it needs a ceiling or pole and a clear view, but no road cutting. The count on the sign is the service output; the sensor in Figure 5 is only one input to it.
Sensor Types for Vehicle Detection:
- Magnetic sensors: detect disturbance in Earth’s magnetic field when a vehicle is present; they are accurate, low power, and weather tolerant, but require road-surface mounting and typically cost $150-300.
- Infrared sensors: measure IR reflection from a vehicle undercarriage; they are fast and easy to install, but can be affected by debris and weather and typically cost $100-200.
- Ultrasonic sensors: measure sound time-of-flight to detect vehicle height; they can work overhead without road cutting, but are weather-sensitive and typically cost $200-400.
- Camera plus AI: analyzes video for vehicle presence; it can cover multiple spaces and add analytics, but needs more power, stronger privacy controls, and typically costs $500-1500.
Key Design Insights:
- Mesh networks with street lights: Sensors use low-power Zigbee to reach nearby street light poles, which aggregate data and relay via LoRaWAN/cellular
- Dynamic pricing integration: Real-time occupancy enables surge pricing (higher rates during peak demand)
- Multi-use infrastructure: Same sensors can detect traffic flow, illegal parking, and emergency vehicle priority
11.11 Test the Reporting and Battery Budget
A sensor choice also commits the city to a reporting and maintenance workload. The parking example shows why data volume and battery life need separate checks.
In this example, magnetic parking sensors transmit occupancy status every 30 seconds over LoRaWAN. Let’s calculate the battery life and data volume for a typical 10-year deployment:
A 30-second reporting interval creates 2,880 transmissions per day. At 12 bytes per message for sensor id, status, and battery state, each sensor sends 34,560 bytes per day, or about 33.8 KiB. A deployment of 14,800 sensors therefore sends 511.488 MB per day (about 500 MB), or about 186.7 GB per 365-day year.
The power budget is the harder constraint. A 3.6 V, 8 Ah lithium battery stores about 28.8 Wh. Sleep mode at 5 microamps for nearly the whole day uses only about 0.120 mAh/day. The LoRaWAN transmit path dominates: 2,880 transmissions at 40 mA for 1 second each uses about 32 mAh/day. The total is about 32.1 mAh/day, so an 8,000 mAh pack would last about 249 days without recharge. A real ten-year deployment needs a larger lithium primary cell, lower reporting rate, event-driven reporting, or solar assistance.

11.12 Summary
A city service envelope connects a public outcome to an accountable operator, sensing requirements, governance rules, technology choices, and a public failure test. Shared networks and data contracts help departments reuse context while each service keeps its own owner and response rules.
Parking guidance makes the tradeoffs concrete. Search-time evidence needs a location and measurement period; occupancy sensing needs coverage, freshness, and privacy controls. The 30-second reporting example produces a manageable data stream but exhausts the stated battery in about 249 days, so a ten-year service needs a different power or reporting plan.
Choose city technology against a named public outcome, an accountable workflow, and tested evidence limits. A working dashboard alone cannot establish a reliable public service.
Carry this evidence into Smart Cities: Parking and Governance, which begins with Smart Parking ROI.