9 Smart Home: Design, Energy, and Reliability
9.1 Start With the Story
A household has chosen devices that can talk to one another, but the first evening scene still fails when the internet drops and wakes people when one sensor is wrong. The designer must turn the list of devices into a sequence with clear triggers, local fallback, timing, energy, and safe recovery.
9.2 Overview
This route designs a complete scene, then tests architecture, energy return, voice latency, false alarms, commercial controls, protocols, and household reliability.
This is part 2 of 2. Review Smart Home: Needs, Protocols, and Boundaries when you need the first route.
9.3 Learning Objectives
By the end of this chapter, you will be able to:
- design a smart-home scene with triggers, actions, and fallback
- calculate energy, latency, and false-alarm trade-offs
- compare residential and commercial automation architectures
9.4 Chapter Roadmap
Follow the original sections below in order. They begin at the reviewed split boundary and keep every worked example, figure, check, and supporting banner with the section that owns it.
9.5 How It Works: Design a Smart Home Scene
A smart-home scene is a small automation with a clear trigger, decision, action, and fallback.
- Name the household need. Start with comfort, energy, safety, access, or convenience rather than a device list.
- Choose the trigger evidence. Identify which sensor, schedule, button, location, or voice command starts the scene.
- Define local and cloud roles. Decide what must keep working locally and what can depend on cloud services.
- Test the fallback. Record what happens when a device is offline, a sensor is wrong, or the household overrides the automation.
9.6 Incremental Examples
Beginner Example: A porch light turns on at sunset and off at a fixed time. The main review is schedule, manual override, and energy use.
Intermediate Example: A heating scene uses occupancy and temperature. It must avoid wasting energy when a room is empty and avoid discomfort when a sensor is stale.
Advanced Example: A security scene combines door, motion, camera, and presence evidence. It needs false-alarm handling, privacy boundaries, local fallback, and clear user control.
9.7 Concept Check: Need Before Device
Why should a smart-home design begin with the household need?
Answer: starting with the need prevents over-automation and helps decide which sensor evidence, protocol, local control, and fallback behavior actually matter.
9.8 Concept Check: Local Fallback
Which smart-home functions most strongly need local fallback?
Answer: safety, access, heating, lighting, and security workflows need local behavior or a manual override because an internet outage should not make the home unusable.
9.9 Try It Yourself
Write a scene card for one automation: household need, trigger, action, local fallback, privacy note, and how a resident can override it.
9.10 See Also
- Application Domains Overview - compares smart homes with other IoT domains.
- IoT Use Cases and Case Studies - helps separate a device idea from an application outcome.
- Protocol Selector Wizard - supports connectivity choices for home devices.
9.11 Smart Home Architecture
Inspect Figure 9.1 to see how device needs determine the local protocols and control interfaces above them.
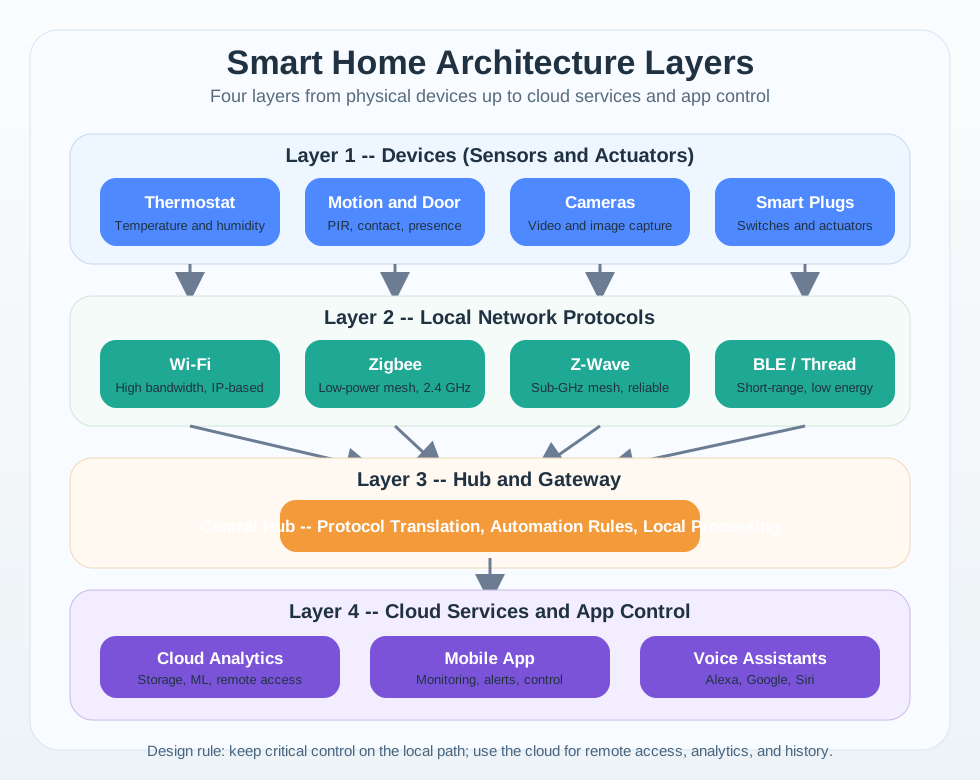
Read Figure 9.1 upward from climate, lighting, security, and appliance devices. Low-rate lights and sensors can use Zigbee mesh, locks and switches may use their local-control path, cameras need higher Wi-Fi capacity, and Thread or Matter supports newer local integration. A hub can process commands when the Internet is absent, while cloud services add remote access or heavier analysis. Voice assistants and phone apps are interfaces, not control owners. The layers help assign failure behavior: a broken cloud link should not silently remove essential local safety or manual control.
Figure 9.1 shows the control layers. The next section asks whether the first few devices pay for themselves and which one should come first.
9.12 Smart Home Energy Optimization
Figure 9.2 answers the ordering question this section opens with: which device should a household buy first?
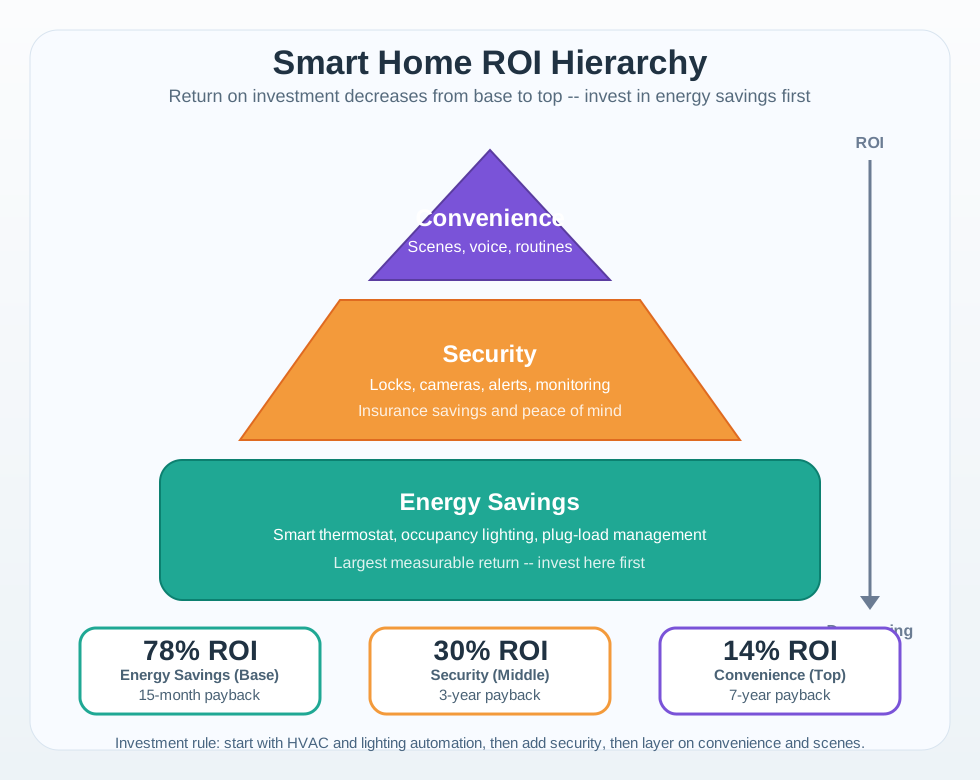
The pyramid in Figure 9.2 is built so the widest tier is the one to buy first. Energy devices sit at the base, with a thermostat, occupancy lighting and plug-load control, and the shortest payback of the three at a little over a year. Security sits above it, where the return is smaller and slower and part of the value is insurance and reassurance rather than a metered saving. Convenience scenes sit at the top with the longest payback by far. The arrow up the side says why the shape matters, because return falls as you climb. Nothing here argues against voice routines. It argues that they are the third purchase, funded by what the base tier already saved.
9.13 Smart Home Energy ROI
Figure 9.3 shows why the cost of a smart-home upgrade is never just the price of the device doing the work.

Three items appear in Figure 9.3, but only two of them save energy. The bulbs on the right are the controllable load: they dim, they switch, and they are what a payback sum usually counts. The round unit on the left does none of that. It is the hub, and it holds the schedules, speaks the low-power radio the bulbs use, and gives the phone app something to talk to. It has to be bought once, powered all the time, and kept working for the savings to continue. The worked example below therefore puts that coordinating hardware in the system total, beside the thermostat, plugs, and sensors.
Scenario: A homeowner evaluates a smart home energy management system integrating smart thermostat, smart plugs, and occupancy sensors.
Given:
- Current annual electricity bill: $2,400 ($200/month average)
- HVAC: 45% of total ($1,080/year)
- Plug load: 25% ($600/year)
- Lighting: 15% ($360/year)
- Smart home components:
- Ecobee smart thermostat: $249
- 8 smart plugs ($20 each): $160
- 6 smart bulbs ($15 each): $90
- SmartThings hub: $130
- Total investment: $629
Expected Savings (industry benchmarks):
- Smart thermostat: 18% HVAC reduction = $194/year
- Smart plugs (phantom load): 7% plug load = $42/year
- Occupancy-based lighting: 35% = $126/year
- Total: $362/year
Result:
- Simple payback: $629 / $362 = 1.74 years (21 months)
- 5-year net savings (with 3% rate increases): $1,293
Key Insight: The smart thermostat alone delivers 54% of total savings, making it the largest-dollar-savings starting point in this household example.
 Checkpoint: Residential ROI
You now know:
- The worked starter system costs $629 and saves $362/year across thermostat, plugs, bulbs, and hub.
- HVAC dominates the household bill in this example: 45% of $2,400/year is $1,080/year.
- The smart thermostat is the first investment to justify: 18% HVAC savings gives about $194/year, a 78% first-year ROI, and roughly a 15-month payback.
9.14 Thermostat Savings Math
Let’s calculate the HVAC savings physics behind the 18% reduction:
Given: The example HVAC bill is $1,080/year. At an illustrative electricity price of $0.154/kWh, this represents about 7,013 kWh/year. Assume this household achieves an 18% HVAC energy reduction after installing the thermostat: savings are about 1,262 kWh/year, or $194/year. This is a scenario estimate, not a result derived from the occupied/setback hours.
9.15 Interactive Calculators
9.15.1 Smart Home ROI Calculator
9.15.2 Scene Reliability Calculator
9.15.3 Voice Assistant Latency Calculator
9.15.4 False Alarm Reduction Calculator
9.16 Home Automation Scene Design
9.17 Scene Complexity
Scenario: Design a “Good Night” scene with 22 devices across multiple protocols.
Desired Actions:
- Turn off 12 smart lights (Zigbee)
- Lock 3 door locks (Wi-Fi)
- Set thermostat to sleep mode (Wi-Fi)
- Arm security system (Wi-Fi)
- Close garage door (Wi-Fi)
- Turn off 4 entertainment devices (Zigbee)
Analysis:
- Zigbee devices (16): 100-500 ms response, local mesh
- Wi-Fi devices (6): 500-2000 ms response, cloud dependency
- Total scene completion: ~8.3 seconds
Reliability Calculation:
- Local Zigbee (99.5% uptime): 0.8 failures/month
- Cloud Wi-Fi (98% uptime): 3 failures/month
- Scene success rate: 81.8%
Design Solution:
- Split into “essential” (Zigbee-only, 99.5% reliable) and “extended” (Wi-Fi devices)
- Essential scene handles lights and plugs
- Extended scene handles locks, security, garage
Key Insight: Reliability degrades exponentially with device count. 5 Wi-Fi devices at 98% each = 90.4% combined success. Minimize cloud dependencies for critical automations.
Scene reliability explains why a “works in the demo” automation can still disappoint at home. The same path logic applies to voice assistants, where every cloud hop adds latency before the actual device changes state.
9.18 Voice Assistant Latency Optimization
Inspect Figure 9.4 to find which stage dominates a fast cloud-assisted voice command and what local processing could remove.
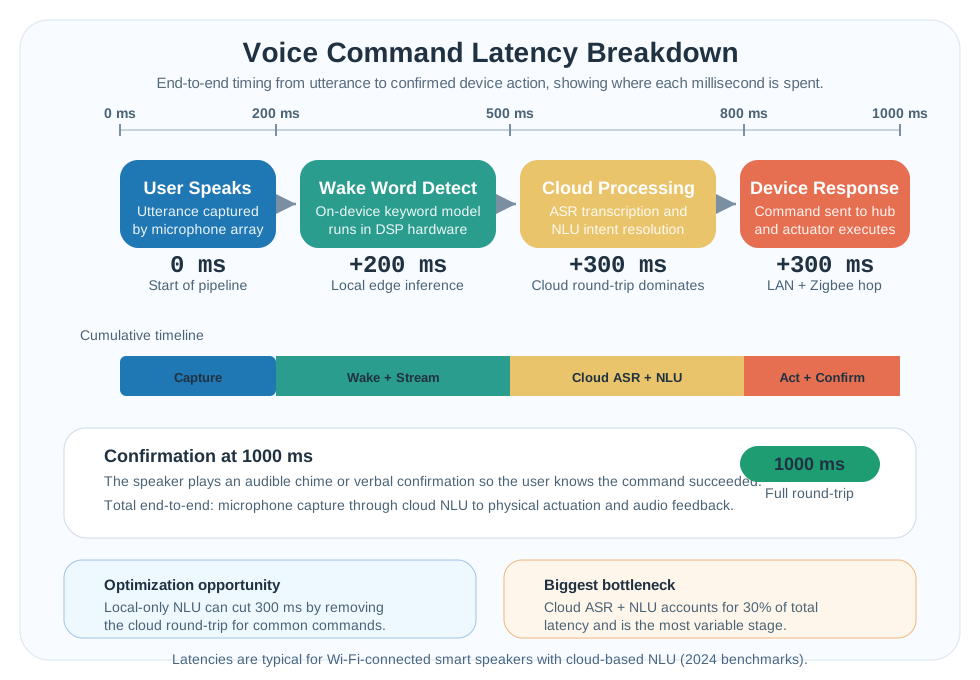
Read Figure 9.4 along the cumulative timeline from speech capture and local wake-word detection to cloud transcription and intent resolution. Device actuation then crosses the LAN and Zigbee path before audible confirmation arrives at 1000 ms. The cloud stage consumes 300 ms, and 300 ÷ 1000 × 100 = 30% of the end-to-end delay; it is also the most variable stage. Local-only intent processing could remove that round trip, but only if the device can support the model and the command set without weakening recognition or privacy controls.
9.19 Voice Assistant Response Time
Problem: “Alexa, turn on living room lights” takes 3-4 seconds.
Current Latency Breakdown:
- Wake word detection: 150 ms
- Audio to AWS + processing: 1,200 ms
- Alexa to Hue cloud: 350 ms
- Hue cloud to local bridge: 600 ms
- Bridge to Zigbee bulbs: 250 ms
- Total: 2,550 ms
Optimization - Enable Local Voice Control:
- Eliminate Hue cloud hop: -350 ms
- Eliminate NAT traversal: -600 ms
- Echo commands Bridge directly on LAN, adding a 200 ms direct LAN hop
- New total: 1,800 ms (about 29% improvement)
Further Optimizations:
- Geofence-triggered routines: Pre-warm lights before arrival
- Future Thread/Matter: 550 ms (with local speech processing)
Key Insight: The biggest quick win is eliminating cloud-to-cloud hops. Use local LAN control (Alexa Local Voice Control, Google Local Home SDK) to halve response times.
9.20 Smart Security False Alarm Reduction
Inspect Figure 9.5 to see how four different controls reduce false alarms while preserving detection of real events.
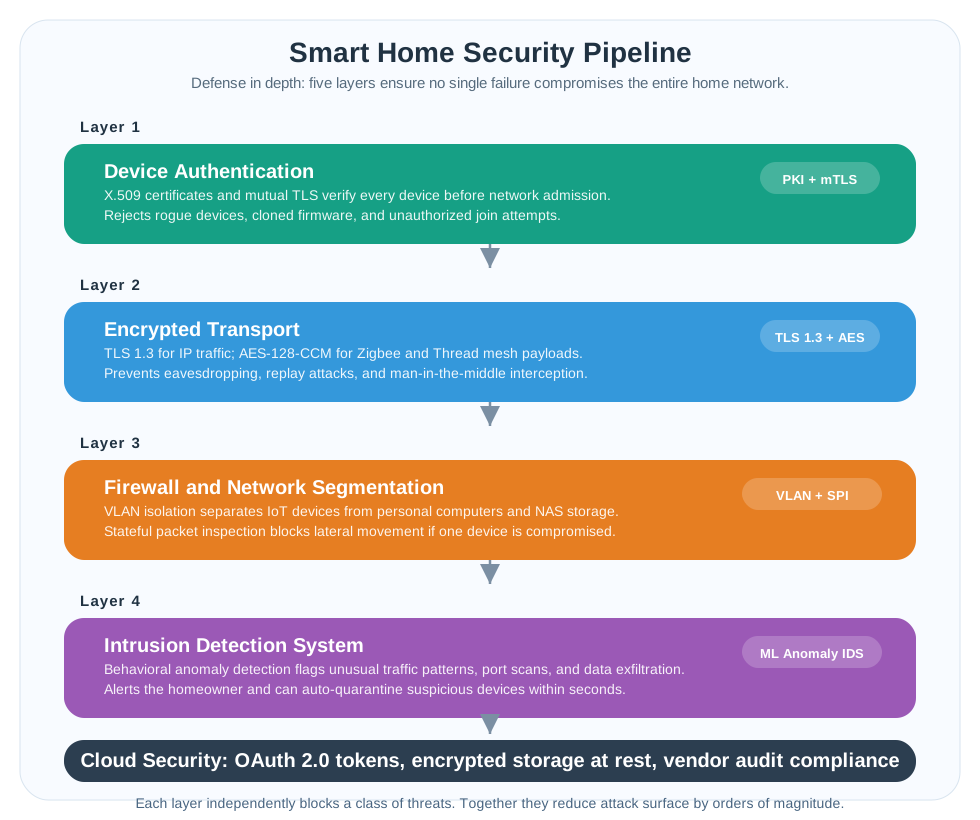
Start Figure 9.5 with 18 false alarms per week and use the log to identify causes. Pet-immune hardware removes about 8.1 alarms and relocation removes 3.6, leaving roughly 6.3. Requiring two sensors cuts that remainder by 30%, to about 4.4; person detection halves it to about 2.2, close to the reported 2.3. Each layer attacks a different failure mode, so their effects compound. The accompanying precision increase matters only because the trial also reports that true-positive detection remained at 100%.
9.21 Security False Alarm Reduction
Problem: 18 false alarms/week causing alert fatigue.
False Alarm Sources (from log analysis):
- Pet movement: 45%
- HVAC air currents: 20%
- Shadows/sunlight: 18%
- Insects on camera: 12%
- Unknown: 5%
Multi-Layer Solution:
- Pet-immune mode: -45% (8 fewer/week)
- Sensor relocation (away from HVAC): -20% (3.6 fewer/week)
- Multi-sensor fusion (require 2+ sensors): -30% of remaining
- AI person detection: -50% of remaining
Result:
- Original: 18 false alarms/week, 11% precision
- Optimized: 2.3 false alarms/week, 47% precision
- 87% reduction while maintaining 100% true positive detection
Key Insight: Layer hardware filtering, environmental optimization, logic fusion, and AI verification. Each layer reduces false positives multiplicatively.
Checkpoint: Reliability and Alerts
You now know:
- A 22-device Good Night scene with 16 Zigbee devices and 6 Wi-Fi devices succeeds about 81.8% of the time because all required devices must respond.
- Local LAN control cuts the voice example from 2,550 ms to 1,800 ms by removing the 350 ms cloud-to-cloud hop and 600 ms NAT traversal.
- False-alarm reduction is layered: 18 false alarms/week can fall to 2.3/week, an 87% reduction, when pet-immune sensing, relocation, multi-sensor fusion, and AI verification work together.
9.22 Commercial Building Automation
Figure 9.6 answers what changes when the smart-home pattern grows into a building whose four subsystems were never designed to talk to each other.
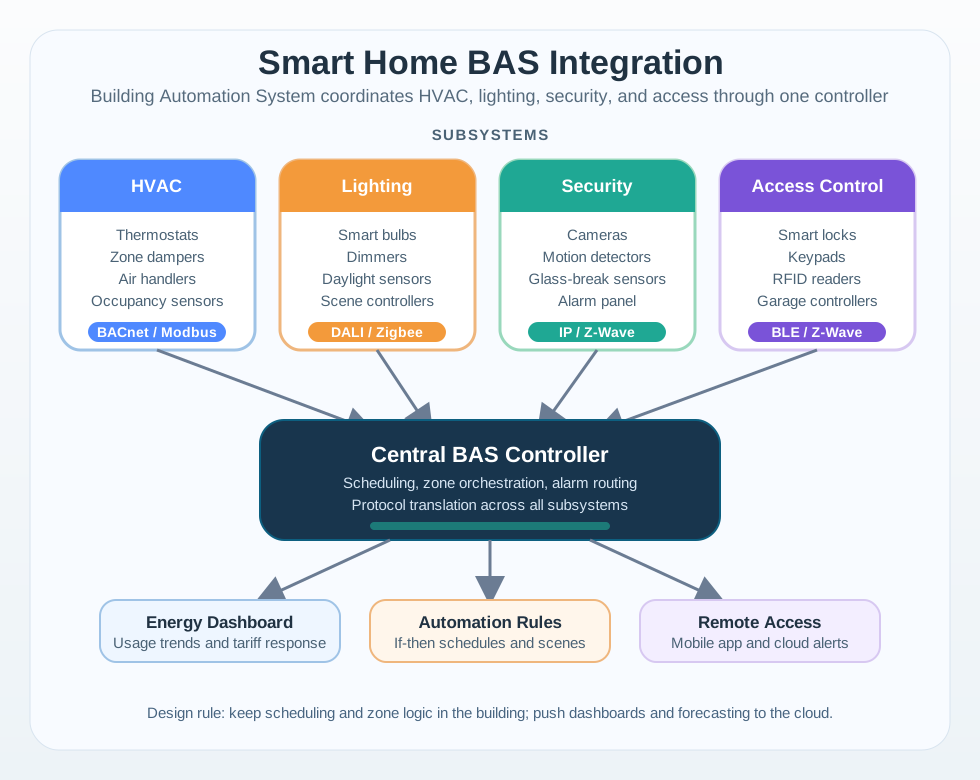
The top row of Figure 9.6 holds four subsystems, and the small note under each one carries the real content. Heating speaks BACnet or Modbus. Lighting speaks DALI or Zigbee. Security and door hardware speak something else again. They meet at one controller, whose first job is translation and whose second is scheduling and alarm routing across all four. Above it sit the outputs a building manager really uses, from an energy dashboard to remote alerts. The line at the foot is the rule worth carrying forward: keep the logic that holds a zone comfortable inside the building, and send only dashboards and forecasts to the cloud.
9.22.1 HVAC Load Optimization
9.23 HVAC Occupancy Sensing
Scenario: 50,000 sq ft office building retrofit with occupancy sensors.
Given:
- Current HVAC: 450,000 kWh/year, $54,000/year
- Average occupancy: 67.5% (varies by hour)
- Sensor system cost: $45,000 (90 sensors + BMS integration)
Savings Calculation:
- Energy wasted on unoccupied zones: 32.5%
- HVAC savings with zone control: 22.75% = 102,375 kWh
- Additional setback savings: 6.25% = $3,375/year
- Total annual savings: $15,660 (29% reduction)
ROI:
- Payback: 2.87 years
- 10-year NPV: $75,895 (169% return)
Key Insight: Buildings with variable occupancy (universities, co-working spaces) see the highest savings. HVAC zones must align with occupancy patterns.
9.23.1 Demand Response Revenue
9.24 HVAC Demand Response
Scenario: 120,000 sq ft office building participates in utility demand response.
Given:
- HVAC: 400 tons, 280 kW average during peak
- Thermal storage: 2,400 ton-hours ice capacity
- DR program: 15 events/year, 4 hours each
- Incentives: $0.50/kWh + $50/kW/year capacity payment
Strategy: Pre-cool to 68F before peak, coast during DR events.
Revenue Calculation:
- Curtailment revenue: 12,000 kWh x $0.50 = $6,000
- Capacity payment: 200 kW x $50 = $10,000
- Pre-cooling energy penalty: $252
- Net annual revenue: $15,748
Key Insight: Buildings with thermal mass (concrete, masonry) can store “coolth” like a battery. The revenue opportunity is highest in regions with aggressive DR programs (California, Texas, PJM territory).
9.24.1 LED Lighting Retrofit
9.25 Daylight Harvesting LED Retrofit
Scenario: 75,000 sq ft mixed-use building lighting upgrade.
Current State:
- 1,200 T8 fluorescent fixtures at 32W = 38,400W
- 196,224 kWh/year, $21,584/year
Proposed System:
- LED fixtures at 14W = 16,800W (56% reduction)
- Daylight harvesting on 40% (perimeter)
- Occupancy sensors on 25% (back-of-house)
- System cost: $156,000
Savings Breakdown:
- LED-only: 110,376 kWh = $12,141/year
- Daylight harvesting: 8,584 kWh = $944/year
- Occupancy sensors: 8,585 kWh = $944/year
- Utility rebate: $10,204 (first year)
- Total: $14,029/year + $10,204 rebate
Result: 65% energy reduction, about 10.4-year simple payback after the stated rebate and energy savings; a shorter payback would require quantified avoided maintenance savings.
9.26 Smart Home Protocol Comparison
Figure 9.7 asks its questions in the order a designer meets them, not in the order a radio data sheet lists them.
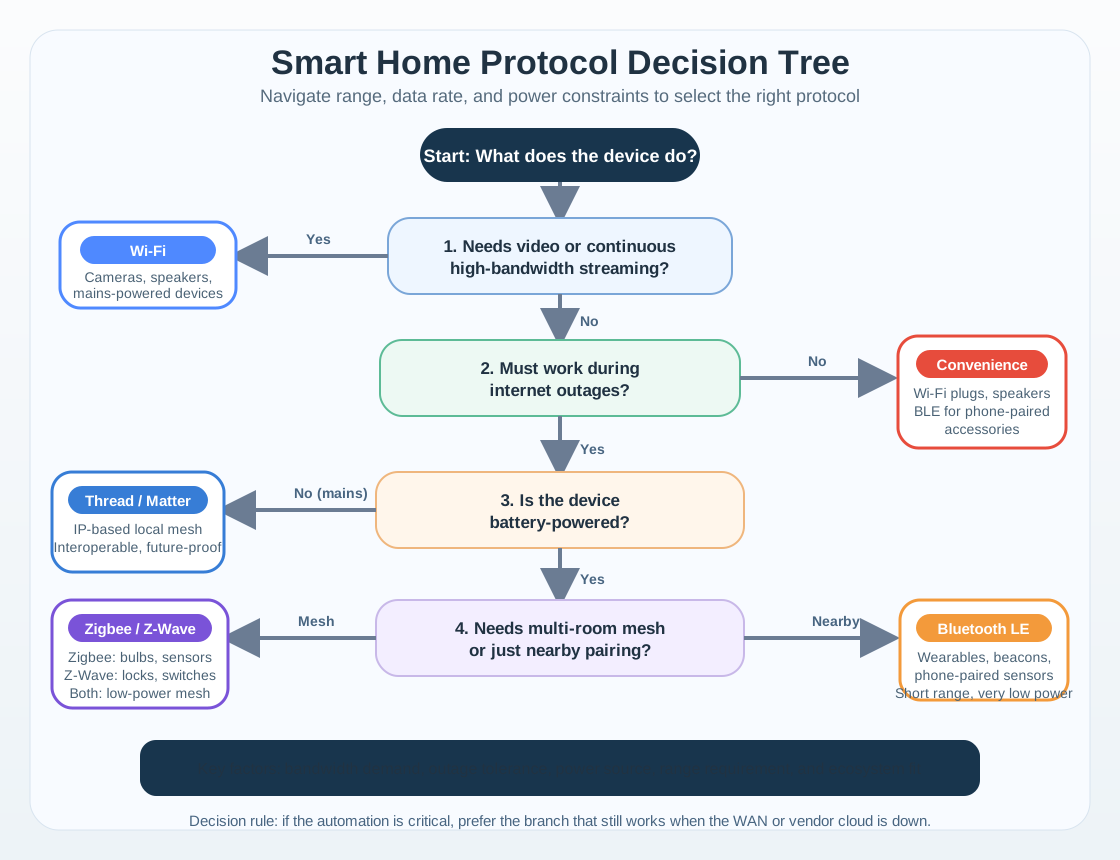
The first question in Figure 9.7 is about bandwidth, and it is deliberately blunt. Cameras and speakers need Wi-Fi, so they leave the tree at once. Everything that remains meets the second question, which asks whether the device must still work when the internet is down. That is a reliability question, not a radio question, and it is the branch the chapter cares about. Only then does the tree ask about batteries, and after that about range. Mains devices that need local control reach Thread or Matter, battery devices spread across rooms reach Zigbee or Z-Wave, and a single nearby accessory reaches Bluetooth. The rule printed at the foot sums it up. Critical automation should sit on a branch that survives a cloud outage.
9.26.1 Protocol Quick Reference
- Zigbee: 10-100m mesh range, very low power, 100-500 ms latency, low cloud dependency with a local hub
- Z-Wave: 30m mesh range, low power, 100-500 ms latency, low cloud dependency with a local hub
- Wi-Fi: 50m range, high power, 500-2000 ms latency, high cloud dependency for most devices
- Thread: 10-100m mesh range, very low power, 50-200 ms latency, no cloud dependency for local control
- Matter: range and power depend on the underlying transport, 50-500 ms latency, low cloud dependency with local-first control
- Bluetooth: 10m range, very low power, 100-300 ms latency, low cloud dependency
Key Insight: For reliability and speed, prefer local protocols (Zigbee, Thread, Matter) over cloud-dependent Wi-Fi. Cloud devices have 98% uptime; local devices achieve 99.5%+.
9.27 Matter Multi-Admin and Migration Notes
Matter is most useful when it is treated as an interoperability layer, not just another radio. A Matter device can be commissioned into multiple ecosystems at once, so a household can use Apple Home, Google Home, Alexa, and Samsung SmartThings without replacing the same lamp, lock, or sensor.
For migration, replace devices in dependency order: start with non-critical lights and plugs, then add Thread border routers and sensors, and leave locks, alarms, HVAC, and leak shutoff controls until local fallback has been tested. Mixed Zigbee, Z-Wave, Wi-Fi, Thread, and Matter homes are normal during transition; document which hub owns each automation so scenes do not fail silently.
Commercial buildings raise the same design question at a larger scale: who owns the control path, and can the next operator understand it? That is why the remaining sections move from protocols into tradeoffs, pitfalls, and review.
9.28 Smart Home Tradeoffs
9.29 Cloud vs Local Processing
Option A: Cloud-based smart home platform (Alexa, Google Home) - Voice recognition works reliably, easy setup, automatic updates, but requires internet for everything including local device control.
Option B: Local-first platform (Home Assistant, Hubitat) - Works during internet outages, faster response, full privacy, but requires technical setup and self-managed updates.
Decision factors: Technical comfort level, internet reliability, privacy requirements, and whether voice control is essential.
9.30 Ecosystem vs Vendors
Option A: Single ecosystem (all Apple HomeKit, all Amazon Alexa) - Seamless integration, consistent interface, reliable automations, but vendor lock-in and limited product selection.
Option B: Multi-vendor with integration hub - Best-of-breed devices, price flexibility, but complex setup and potential interoperability issues.
Decision factors: Household technical skills, budget, importance of specific devices, and tolerance for troubleshooting.
9.31 Common Pitfalls
9.32 Avoid Over-Automation
The Mistake: Installing dozens of smart devices and complex automations before understanding actual usage patterns.
Why It Happens: Enthusiasm for technology outpaces practical need assessment. Marketing promises exceed realistic value.
The Fix: Start with 2-3 high-impact devices (thermostat, a few smart bulbs). Monitor for 3 months before expanding. Let actual friction points guide additional purchases.
9.33 Pitfall: Ignoring Household Buy-In
The Mistake: Deploying smart home technology that other household members find confusing, unreliable, or invasive.
Symptoms: Family members use manual overrides, disable automations, or complain about “the house is broken.”
The Fix: Involve all household members in device selection. Ensure manual controls always work. Create simple, predictable automations before complex ones. Respect privacy concerns about cameras and tracking.
9.34 Common Misconceptions
9.35 Smart Homes Can Work Offline
The Belief: If the internet goes down, the entire smart home stops working.
The Reality: It depends entirely on protocol and platform choice. Zigbee and Z-Wave devices communicating through a local hub (like SmartThings or Hubitat) continue operating without internet. Thread/Matter devices are designed for local-first operation by default. Only cloud-dependent Wi-Fi devices (some smart plugs, cameras streaming to cloud) lose functionality during outages. A well-designed smart home should have all critical automations (lighting, locks, thermostat schedules) running locally, with cloud used only for remote access and voice assistant NLU processing.
9.36 More Devices Not Smarter
The Belief: Adding more connected devices proportionally increases home intelligence and convenience.
The Reality: As shown in the scene reliability calculation, adding devices introduces multiplicative failure risk. A 22-device scene across two protocols achieves only 81.8% reliability. Each additional device also increases network congestion, maintenance burden, and potential security attack surface. A focused deployment of 8-12 high-impact devices (thermostat, key lighting zones, locks, one or two sensors per room) often outperforms a 40-device installation in both reliability and user satisfaction. The goal is solving specific friction points, not maximizing device count.
9.37 Climate Limits Savings
The Belief: A smart thermostat saves 18% everywhere, regardless of location or climate.
The Reality: The 18% figure is an average across US households. Savings vary dramatically by climate zone, home construction, and existing HVAC efficiency. Homes in extreme climates (Minnesota winters, Arizona summers) with poor insulation may save 25-30%, while homes in mild climates (San Diego, Honolulu) with newer construction may save only 8-12%. The ROI calculation must account for local energy costs ($0.10/kWh in Louisiana vs. $0.30/kWh in Connecticut) and heating degree days. Always use local utility data for accurate payback estimates.
Checkpoint: Scaling the Design
You now know:
- A 50,000 sq ft office retrofit can save $15,660/year on HVAC, a 29% reduction with a 2.87-year payback, when occupancy patterns align with zones.
- A 75,000 sq ft lighting retrofit in the worked example saves 65% energy and reaches a 5.2-year payback with rebate and avoided maintenance.
- The practical migration rule is conservative: start with non-critical lights and plugs, then prove local fallback before moving locks, alarms, HVAC, or leak shutoff.
9.38 Applied Review
9.39 Hub vs Cloud Smart Homes
When setting up a smart home, you must choose between hub-based systems (SmartThings, Hubitat, Home Assistant) and cloud-only systems (Ring, Wyze, TP-Link Kasa). This decision affects reliability, privacy, cost, and complexity.
- Internet outage: hub-based systems keep local automations working; cloud-only systems may stop working.
- Response time: hub-based systems usually respond in 100-500 ms through local processing; cloud-only systems often need 500-2000 ms for cloud round trips.
- Privacy: hub-based systems can keep data local unless shared; cloud-only systems send more data to the vendor cloud.
- Setup complexity: hub-based systems require moderate hub setup and pairing; cloud-only systems are usually app-first and easier to start.
- Device compatibility: hub-based systems can span Zigbee, Z-Wave, and Wi-Fi; cloud-only systems are more limited to a vendor ecosystem.
- Monthly cost: hub-based systems are often $0 after hub purchase; cloud-only systems often charge $3-10/month for features.
- Technical knowledge: hub-based systems need intermediate routing and IP comfort; cloud-only systems are beginner-friendly.
Decision Guide:
- Choose Hub-Based if: You value reliability during internet outages, have 10+ devices, want local privacy, or have technical skills
- Choose Cloud-Only if: You prioritize simplicity, have fewer than 5 devices, don’t mind cloud dependency, or need plug-and-play setup
Hybrid Approach: Many users start with cloud-only devices (Ring doorbell, Nest thermostat) and add a hub later (Home Assistant) to integrate them locally while keeping cloud features as backup.
Real Numbers: A hub-based system with 20 devices has 99.5% uptime (local processing) vs 98% for cloud-only (AWS outages, internet issues). Over a year, that’s about 175 hours of downtime (cloud) vs 44 hours (hub) — a 4x difference.
9.40 How It Works: Smart Home Scene Execution
The big picture: When you say “Alexa, good night,” your smart home executes a complex choreography involving multiple devices, protocols, and fallback mechanisms.
Step-by-step breakdown:
- Voice processing: Echo device detects wake word locally (150 ms), sends audio to AWS for natural language understanding (1,200 ms). - Real example: Amazon processes 100+ million voice commands daily with 95%+ accuracy.
- Scene triggering: AWS identifies “good night” scene, sends control commands to your local hub and individual devices simultaneously. - Real example: A 12-device scene sends commands in parallel, not sequential, to minimize total execution time.
- Device execution: 8 Zigbee lights turn off via local mesh (250 ms), 2 Wi-Fi devices (lock, thermostat) execute via cloud (1,500 ms), 2 Z-Wave switches close via hub (300 ms). - Real example: Total scene completion takes ~2.3 seconds with mixed protocols, or 800 ms with Zigbee-only.
Why this matters: Understanding the execution flow reveals why local protocols (Zigbee, Thread) achieve 99.5% reliability vs 98% for cloud-dependent Wi-Fi - and why mixing protocols in one scene creates multiplicative failure risk.
9.41 Quiz: Smart Home Concepts
9.42 Interactive Quiz: Sequence the Steps
9.43 Label the Diagram
9.44 Code Challenge
9.45 Summary
Smart home and building automation success depends on:
- Starting simple: Smart thermostat delivers 50%+ of residential energy savings
- Protocol choice: Local protocols (Zigbee, Thread) outperform cloud Wi-Fi for reliability
- Scene design: Reliability degrades exponentially with device count and protocol diversity
- False alarm reduction: Layer hardware, environmental, logic, and AI filtering
- Commercial buildings: Occupancy-responsive HVAC and demand response generate substantial ROI
- Household buy-in: Technology must work for everyone, not just the enthusiast
9.46 In 60 Seconds
Smart home IoT automates lighting, HVAC, security, and energy management, achieving 15-30% energy savings and improved comfort through occupancy sensing and adaptive control loops that require careful local-processing fallback design.
9.47 Knowledge Check
9.48 Quiz: Smart Home IoT
9.49 What’s Next
- Application Domains Overview: compare smart-home decisions with other IoT application domains.
- Smart Cities: city-scale building automation and urban IoT.
- Smart Grid: home-to-grid energy integration and demand response.
9.50 Key Takeaway
Smart home IoT is judged by reliability and user experience, not by device count. Local control, privacy, interoperability, and graceful failure matter as much as cloud automation.