6 IoT Domain Requirements: Data, Regulation, and Selection
More
Depth: Practitioner
Progress saves as you read. Mark sections complete as you go; your progress appears in the sidebar.
- Podcast audio coming soon
- Character narration audio coming soon
6.1 Choose From the Whole Requirement Set
A device can meet its response and battery targets yet generate more data than its network can carry. Regulation can also delay a technically working product. This chapter connects data volume, compliance work and technology selection so that the design fits the service and its operating budget. It is part 2 of 2; Latency, Scale, and Power establishes the first requirement dimensions.
Consider the city’s proposed 10,000 smart parking sensors across downtown. A private LoRaWAN network needs gateways and a team to operate them; NB-IoT uses a carrier network and charges recurring subscriptions. A cheaper sensor can therefore produce a more expensive service. The team must compare daily bytes, infrastructure, maintenance, permitted data handling and lifetime cost together.
The problem is choosing a feasible system before committing to a favorite radio. We will size a manufacturing data path, account for domain regulation, narrow technologies against all six dimensions, then return to the parking deployment with a cost comparison and a weighted selection framework.
KEY CONCEPTS
- Data volume
Daily bytes constrain transport and processing.
- Regulation
Applicable obligations need evidence, time and budget.
- Trade-offs
A shortlist must satisfy the whole requirement set.
- Lifetime cost
Compare purchase, operation and replacement together.
6.2 Learning Objectives
By the end of this chapter, you will be able to:
- size an IoT data path from volume and timing evidence
- include regulatory cost and delay in requirements
- select domain technology with explicit trade-offs
6.3 Size the Data Path Before Choosing It
Daily data volume determines which links can carry the measurements and where processing belongs. The following bands are starting points for comparison, rather than guarantees about a particular network:
| Per-device daily data | Example workload | Candidate path and processing |
|---|---|---|
| Very low, under 1 kB | Temperature or soil moisture | LoRaWAN or Sigfox; edge processing usually unnecessary |
| Low, 1–100 kB | Smart parking or occupancy | NB-IoT or Wi-Fi; cloud processing usually fine |
| Medium, 100 kB–10 MB | Wearable biometrics or building automation | Wi-Fi or cellular; cloud or edge processing |
| High, 10–100 MB | Industrial vibration or traffic monitoring | Wired Ethernet or 4G/5G; edge processing preferred |
| Very high, 100+ MB | Video surveillance or high-frequency sensors | Usually wired Ethernet and edge processing |
6.4 Manufacturing PdM Data Volume
A manufacturing predictive-maintenance example shows how fleet volume accumulates. Each vibration sensor samples at 100 Hz with 4 bytes per sample: 100 × 4 = 400 bytes/second. Across 500 sensors, that becomes 200 kB/second, or about 17 GB/day raw. Here edge processing means processing near the sensors; sending only anomalies reduces this example to 1% of the raw volume, about 170 MB/day.
At the assumed cloud charge of $0.10/GB, the rounded raw volume costs $1.70/day, versus $0.017/day after processing. Annual charges are approximately $620 versus $6: a 100× reduction in this data charge. That is a reason to evaluate edge computing economically, but the saving alone does not establish that edge hardware and maintenance pay for themselves. Cloud capacity is not the obstacle in this example; the issue is the cost and bandwidth of moving unnecessary raw data. Smart Manufacturing develops the real-time, high-volume industrial setting.
The earlier scale and power constraints still apply: personal deployments have 1–10 devices, while city deployments have 5,000+. Wi-Fi at 100–200 mW differs from LoRaWAN at 20–50 mW with roughly 0.03% duty cycle for brief periodic uplinks, not 1%. Volume calculations must fit that operating pattern.
6.5 Budget for Applicable Regulation
A network shortlist is incomplete until the team identifies which obligations apply to its intended use and market. Healthcare medical-device review and applicable HIPAA privacy work can add development time and cost. Automotive functions may need International Organization for Standardization (ISO) 26262 functional-safety work and testing responsive to NHTSA expectations. Utilities and smart-grid projects may face NERC CIP cybersecurity requirements and utility-commission approval where applicable.
Industrial projects must account for OSHA safety and operational technology (OT) security standards according to the site and system. Agriculture requirements vary by product and location, including environmental certifications. Consumer products may need FCC radio authorization, UL electrical testing and work on voluntary privacy expectations, depending on the product and market. These are distinct obligations; radio performance alone establishes none of them.
The contrast between fitness trackers and medical wearables makes the planning consequences concrete. A general-wellness tracker may be outside active U.S. Food and Drug Administration (FDA) device regulation. A wearable with medical claims is classified by intended use and may need FDA review as well as applicable FCC authorization. In the illustrative comparison, a fitness tracker takes 6–12 months to develop and a medical wearable 18–36 months. Evidence and human-subject study requirements depend on claims, risk and pathway: a clinical trial or IRB study is not automatic.
Fitness trackers can offer best-effort measurements; medical claims may need evidence for accuracy such as ±0.1°C temperature or ±2 bpm heart rate. Privacy duties also depend on context: HIPAA obligations arise for covered entities and business associates, rather than every device that records health data. Where HIPAA applies, the Security Rule uses risk-based safeguards; encryption is an addressable specification and audit controls are required. Some Class II devices need a 510(k), but clinical testing is most often not required, as the FDA’s 510(k) training explains.
Consumer trackers retail around $50–200; medical wearables may retail around $500–2,000 with different product-liability exposure, including risks associated with clinical use. A $150 tracker on a 12-month cycle cannot simply acquire a medical label. The original comparison’s 200–500% cost uplift is a planning illustration, not a universal multiplier. Reimbursement, margins and retention may change, as the transition to ECG features illustrates, but the business case still needs product-specific evidence. Healthcare IoT connects clinical risk, reliability and applicable FDA pathways.
The standalone checks use the knowledge-check module.
6.6 Narrow Technologies Against All Six Dimensions
With data and regulation accounted for, compare the full requirement envelope. This matrix preserves the chapter’s illustrative domain targets; a real service must validate its own limits, especially the meaning of reliability.
| Domain | Latency | Reliability | Scale | Power | Data volume | Regulation |
|---|---|---|---|---|---|---|
| Autonomous vehicles | Under 10 ms | 99.999% | Personal | Vehicle | Very high | Very high |
| Healthcare monitoring | Under 1 s | 99.99% | Personal–building | Battery/mains | Medium | Very high |
| Industrial M2M | Under 50 ms | 99.9% | Building–campus | Mains | High | High |
| Smart cities | Under 1 min | 99% | City | Battery/solar | Low–medium | Medium |
| Smart agriculture | Under 1 hour | 95% | Campus/field | Solar/battery | Very low | Low |
| Smart home | Under 1 s | 99% | Home | Mains/battery | Low | Low |
| Environmental monitoring | Under 1 hour | 95% | City/regional | Solar | Very low | Low |
The decision tree turns that comparison into five narrowing questions. Start with the tightest constraint, then validate every remaining dimension before accepting a candidate.
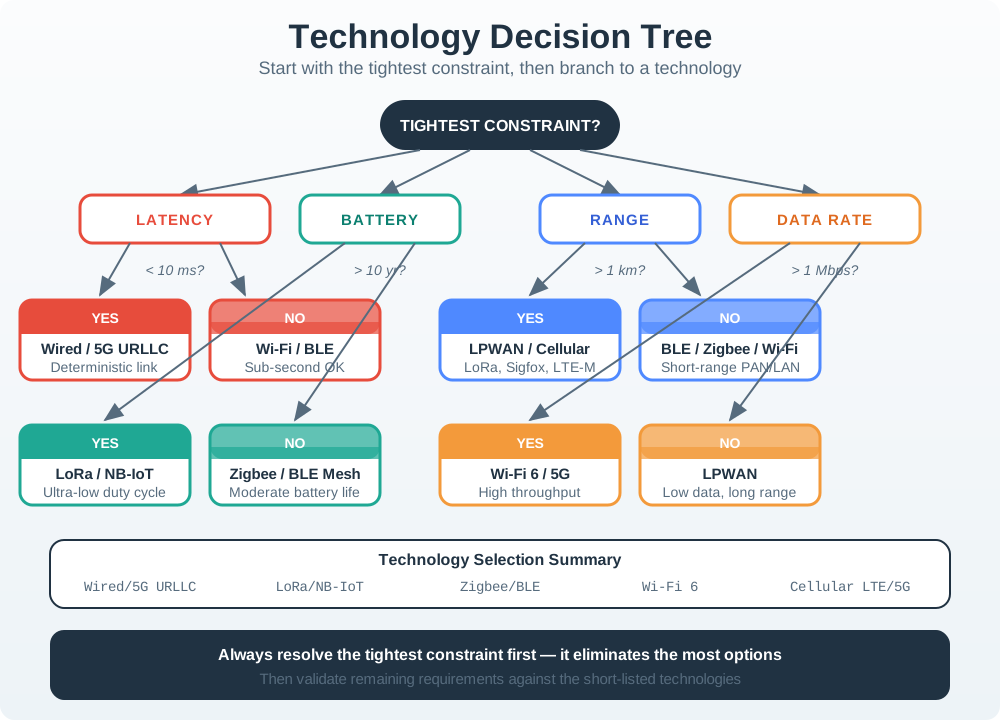
Start with latency: under 50 ms suggests edge compute and preferably wired paths. Under 1 s allows edge or cloud with Wi-Fi or cellular. Under 1 minute or longer can allow cloud and low-power wide-area networks (LPWAN). Next, Power source compares mains, long-life battery and solar options against their supply limits. Deployment scale then separates local consumer links, gateway infrastructure and carrier or city-scale networks. Data volume compares daily bytes: under 1 kB suggests LoRaWAN or Sigfox; 1–100 kB suggests NB-IoT or Wi-Fi. Finally, check regulation and all remaining requirements before accepting any candidate. These are screening categories, not guaranteed response times. Transportation & V2X examines the under-10-ms collision-avoidance case.
For power, mains supply admits Wi-Fi, Ethernet and cellular without the same battery constraint. Long-life battery examples shortlist LoRaWAN, NB-IoT and Sigfox; solar examples favor LoRaWAN or Sigfox with a careful budget. Those lists are not exclusive technical limits. For scale, under 50 devices can use consumer Wi-Fi, Bluetooth or Zigbee; 50–5,000 points toward LoRaWAN gateways or Wi-Fi infrastructure; 5,000+ suggests carrier NB-IoT or city-scale LoRaWAN.
For daily bytes, under 1 kB invites LPWAN evaluation, 1–100 kB favors NB-IoT or Wi-Fi in this tree, and 100+ kB workloads point toward Wi-Fi, cellular or wired paths. Volume alone cannot prove a technology mandatory. Finally, regulation adds assurance and schedule work: the tree’s healthcare/automotive 2–3× time-and-cost allowance is illustrative; industrial work needs OT security integration; consumer work needs applicable standard compliance.
A useful shortlist may contain 3–5 viable options, rather than one universal winner. Wi-Fi suits existing smart-home and hospital infrastructure, and industrial high-volume workloads with wired power. Agriculture is harder: the example assumes 50–100 m range, 100+ access points (APs) across 50 hectares and batteries draining in weeks. Remote environmental sites lack infrastructure and power. A 50,000-streetlight city example estimates 500+ APs with nominal 100 m spacing; an actual count requires a coverage design, since device count and spacing alone cannot establish it.
LoRaWAN has the opposite limitations. The cited 0.3–50 kbps range does not suit continuous ECG/video workloads as a group, industrial video needs Mbps rather than kbps, and the example’s 1–2-second delay misses voice-control response targets. These workload assumptions need checking rather than turning into universal exclusions. Smart Agriculture develops the remote, ten-year-battery case, while Smart Cities connects city-scale choices to an 80% sensor-coverage threshold.
6.7 Make Trade-Offs and Failure Costs Explicit
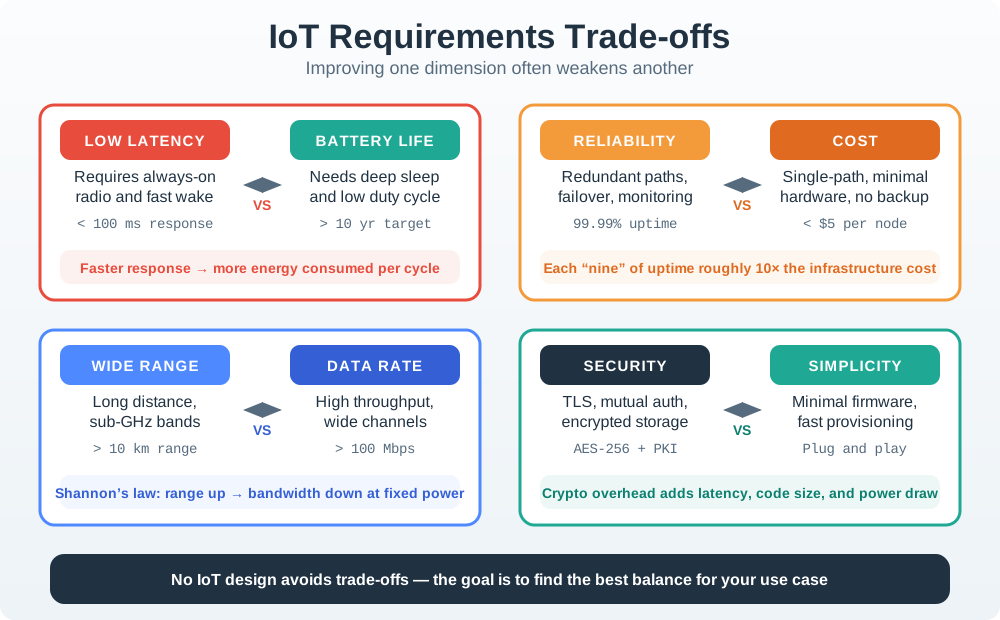
Even a feasible candidate cannot optimize every dimension. A response under 100 ms can require frequent radio wakes that conflict with a ten-year battery target. Redundant paths and failover add hardware and operating cost to nodes intended to cost only a few dollars. Long-range, narrow-channel links reaching ten kilometres do not also carry video streams. Strong security adds handshakes, code and energy demands. The design review must say which side each service prioritizes.
6.8 Domain Requirements Pitfalls
Latency evidence must include the tail. A 200 ms average cloud round trip can hide 2–5-second spikes under load, unacceptable for an industrial safety deadline. Specify P99, the 99th-percentile latency, rather than only the average. Likewise, a temperature sensor rated ±0.1°C cannot establish system accuracy: signal conditioning, analog-to-digital converter (ADC) resolution and firmware rounding all contribute error.
Maintenance also changes the comparison. With 10,000 sensors and two-year batteries, the source’s annualized model replaces 5,000 batteries/year at $15 including labor: $75,000/year. Its separate claim that paying $5 more for a ten-year battery saves $350,000 needs an explicit horizon and replacement schedule; it is not the result of the following ten-year comparison.
6.9 Parking Sensor Battery-Replacement Math
For that comparison, option A costs $40 per Wi-Fi sensor, or $400,000 upfront, plus $15 × 5,000 × 10 = $750,000 in annualized replacement costs. Total ten-year cost is $1,150,000. Option B costs $60 per LoRaWAN sensor, or $600,000, with no battery replacement within the assumed ten years. The difference is $550,000, or $55/sensor, about 48%. This is total cost of ownership (TCO): purchase plus the stated operating and replacement costs over a defined period. Boundary-year replacements must use the same convention on both sides.
Finally, plan for changes to applicable rules. The EU AI Act (2024), GDPR enforcement and new US state privacy laws motivate compliance hooks from the start. A 3–5-year planning horizon should include reassessment; it does not mean consumer devices automatically become medical devices. Medical-device status depends on intended use and applicable law.
6.10 Return to the City’s Five-Year Cost Decision
The 10,000 downtown parking sensors now provide a fuller comparison between private LoRaWAN and carrier NB-IoT. All prices below are scenario assumptions. Both options include a magnetic sensor and ten-year battery, with 2% annual sensor replacement. The city center covers 5 km²; the LoRaWAN design assumes 25 gateways and 5% annual gateway failures.
| Initial expenditure | LoRaWAN | NB-IoT |
|---|---|---|
| Sensors | 10,000 × $185 = $1,850,000 | 10,000 × $165 = $1,650,000 |
| Gateways | 25 × $2,400 = $60,000 | Uses existing cellular towers |
| Gateway installation (mounting, power, networking) | 25 × $800 = $20,000 | No local gateway installation |
| Server setup | $15,000 once | Included in stated alternative |
| Total capital expenditure | $1,945,000 | $1,650,000 |
NB-IoT saves $295,000 upfront, but the operating costs reverse the comparison. LoRaWAN has no per-device carrier subscription; server, power and maintenance expenses continue. LoRaWAN uses unlicensed spectrum.
| Annual operating expenditure | LoRaWAN | NB-IoT |
|---|---|---|
| Server license / cloud management | $12,000 self-hosted | $8,000 carrier platform |
| Sensor replacements | 200 × $185 = $37,000 | 200 × $165 = $33,000 |
| Gateway replacements | 1.25 × $2,400 = $3,000 expected | None |
| Network monitoring and updates | $8,000 | Included in stated alternative |
| Gateway power/connectivity | 25 × $300 = $7,500 | None |
| Device connectivity (subscription includes data allowance) | No carrier fee | 10,000 × $3/month × 12 = $360,000 |
| SIM management | None stated | 10,000 × $0.50/year = $5,000 |
| Annual total | $67,500 | $406,000 |
Over five years, LoRaWAN costs $1,945,000 + ($67,500 × 5) = $2,282,500. NB-IoT costs $1,650,000 + ($406,000 × 5) = $3,680,000. LoRaWAN saves $1,397,500, about 38%. Annual savings are $338,500 (about $338K); dividing $295,000 by $338,500 gives 0.87 years, or 10.4 months. Under these assumptions, the higher initial investment pays back in under 11 months.
The decision also needs sensitivity analysis. At $1.50/device/month, NB-IoT connectivity becomes $180,000/year. Adding $46,000 in other costs gives $226,000/year and $2,780,000 over five years. LoRaWAN still saves $497,500, about 18%.
At 50,000 sensors and 100 gateways, LoRaWAN capital expenditure is $9,585,000, including the $15,000 setup. Annual operations are $12K + $185K + $12K + $8K + $30K = $247,000; five-year operations are $1,235,000, making TCO $10,820,000. NB-IoT starts at 50,000 × $165 = $8,250,000. Its five-year operations are ($1.8M + $25K + $8K + $165K) × 5 = $9,990,000, giving $18,240,000 TCO. The difference is $7,420,000, about 40.7% (roughly $7.4M or 41%).
Cost does not settle ownership and resilience. Private LoRaWAN gives the city control of its data handling without a carrier transport path, customization of network parameters, and gateways reusable for air-quality or waste sensors. It can operate during cellular outages if its own dependencies remain available. The city needs radio frequency (RF) troubleshooting expertise, owns uptime without a carrier SLA, and must plan gateway replacement every 7–10 years.
NB-IoT offers faster deployment through existing towers and a contract-defined service-level agreement (SLA) and support. It can offer useful underground/indoor coverage, but the site must prove that coverage. Procurement avoids local RF-network operation. Risks include carrier dependence, SIM changes when switching where required, contract renewal and price changes, data passing through carrier infrastructure, and service sunset that may require sensor replacement.
In this framework, LoRaWAN merits attention above 5,000 devices, on 5+ year projects, with capable city IT staff, sovereignty needs and planned reuse. NB-IoT merits attention below 2,000 devices, for 1–3-year pilots, limited RF expertise, fast deployment or difficult indoor coverage. These are scenario screening rules. For the stated 10,000-sensor case, LoRaWAN’s approximately $1.4M saving and 11-month payback support selection, provided the city can operate the network.
6.11 Record a Repeatable Selection Decision
After excluding infeasible options, use weighted scoring to compare requirements fit (50%), cost alignment (30%) and complexity match (20%), for 100 points total. Complexity match asks whether the team can implement and operate the system. A good cost score cannot excuse failure of a mandatory requirement.
The smart-agriculture example scores 85/100 for fit, 90/100 for cost and 80/100 for complexity. Their weighted contributions are 42.5, 27.0 and 16.0, totaling 85.5/100. Use 75 or above as a strong-candidate band, 60 to below 75 for careful evaluation and risk analysis, and below 60 to reconsider the approach. The scorecard also flags a weakest dimension below 70 for improvement.
The repeatable sequence is to identify the tightest of the six constraints, eliminate technologies that cannot meet it, evaluate survivors against all six, compare cost, maturity and vendor ecosystem, then validate the selection in a focused pilot. Record a measurable service outcome, a requirement envelope of limits, and validation evidence with representative tests, traceable results and an acceptance decision. That chain explains why the city chose its system and what would trigger reconsideration.
6.12 Knowledge Check: IoT Domain Requirements
Summary
Latency ranges from under 10 ms to hours across these examples; reliability needs explicit failure controls and an operating model. Scale changes infrastructure ownership, power removes infeasible choices, data volume shapes transport and processing, and applicable regulation adds assurance work, cost and time. Retention, consent and local rules can change the feasible design too.
The parking comparison shows why purchase price is insufficient: the stated private LoRaWAN option costs more initially but has 38% lower five-year TCO. Weighted scores help compare feasible candidates; measured validation must establish whether the chosen system meets the service requirements.
Start with requirements, then compare feasible technologies over the whole operating period. Keep the assumptions, trade-offs and evidence visible in the decision.
