13 Smart Cities: Shared Infrastructure and Deployment
More
Depth: Practitioner
Progress saves as you read. Mark sections complete as you go; your progress appears in the sidebar.
- Podcast audio coming soon
- Character narration audio coming soon
13.2 Learning Objectives
By the end of this chapter, you will be able to:
- compare smart-lighting, waste, platform, and coverage trade-offs
- decide which infrastructure and data can be shared across services
- plan privacy, maintenance, interoperability, and public-value evidence
13.3 Make Powered Poles Useful and Safe
Parking showed why dense sensing needs an honest service boundary. Street lighting adds another constraint: powered poles can become city-wide infrastructure, but safety and maintenance rules must lead the technology choice. Poles provide continuous electricity for gateways and high-power sensors, height for wide-area coverage, mounting and connectivity points for multiple sensor types, and a presence on virtually every block.
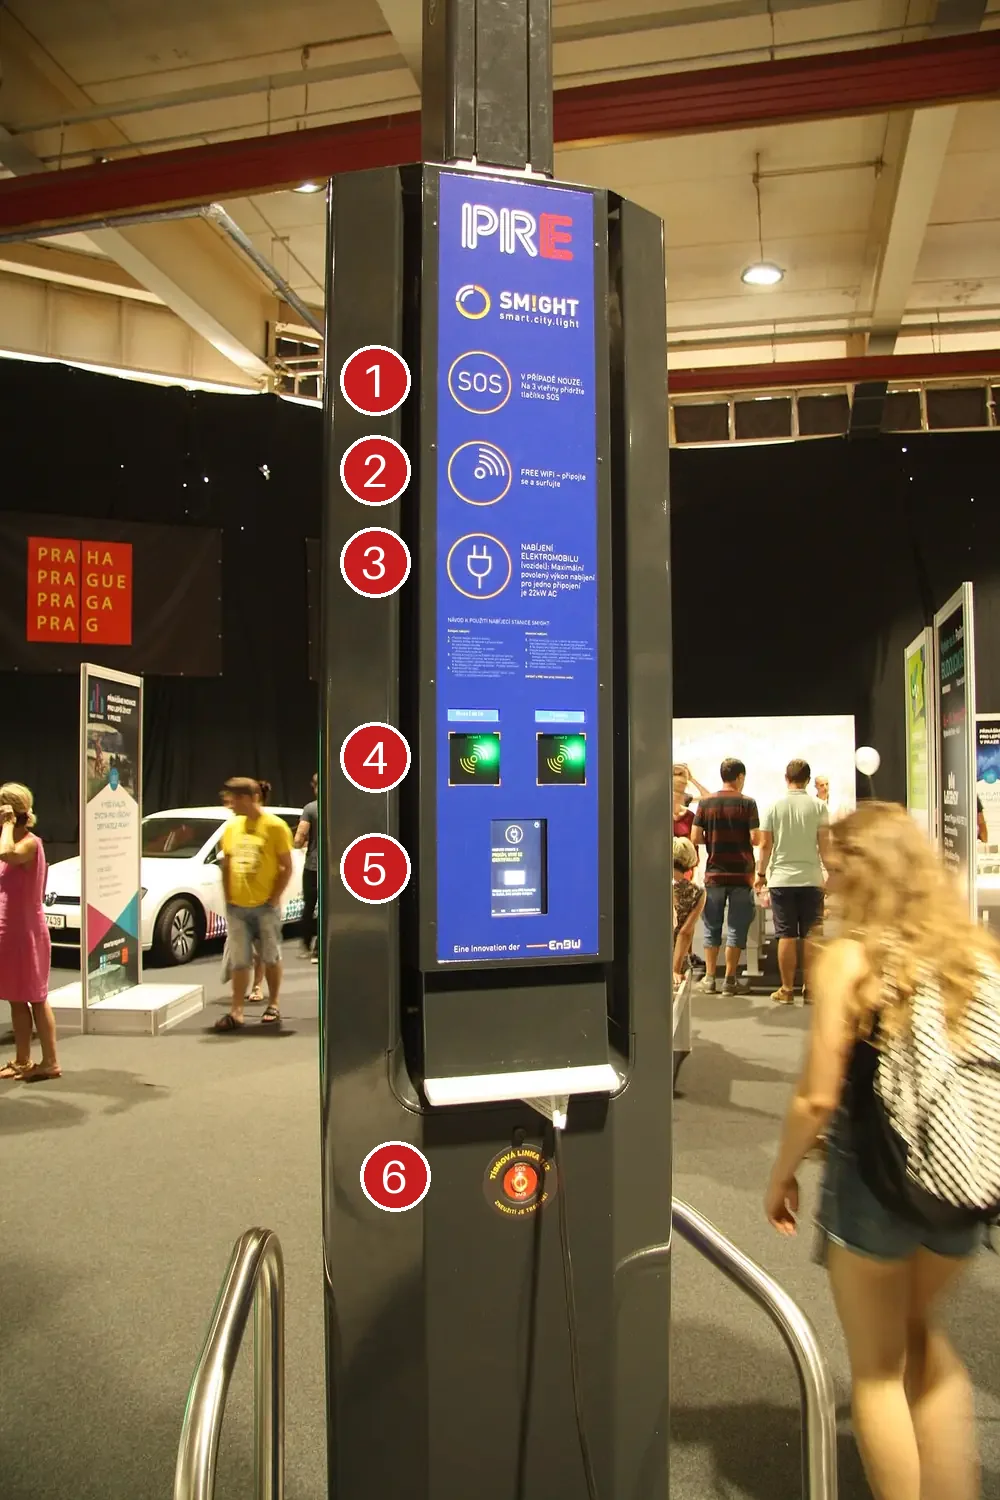
The smart-lamp column in Figure 1 makes that sharing concrete. Work down its face using the numbers on the photo: (1) an emergency call, (2) public Wi-Fi, and (3) vehicle charging share one pole, with a charging cable running from the base. (4) Two contactless reader pads and (5) a card panel bring payment and identity into street furniture. (6) A red emergency button has its own labelled line. Each service has a different owner, uptime promise, and privacy question, yet they share one mast, power feed, and maintenance visit. Physical convenience does not settle those responsibilities.
13.4 DALI and OLC Architecture
A Digital Addressable Lighting Interface (DALI) bus controls luminaires locally. It supports up to 64 control gear devices per line, bidirectional status queries, individual or group addressing, and 254 logarithmic dimming levels across a nominal 0.1–100% range, subject to the device’s minimum supported level. Diagnostics can include lamp failure, operating hours, and power consumption where the gear supports them.
Keep that local control separate from the wide-area path to central management. LoRaWAN uses gateways rather than a mesh of street lights. Daily dimming schedules can be distributed over the network; motion sensors can trigger temporary full brightness locally for pedestrian safety. An emergency override’s timing must be validated rather than assumed to be real-time over LoRaWAN. Adaptive controls reduce energy through dimming: the DOE discussion of adaptive street lighting reports potential savings of more than 50% for adaptive systems.
13.5 Video: Smart Street Parking
The Smart Street Parking video complements the pole example by showing how curbside sensing supports a city service. To connect lighting decisions to electrical demand, Smart Grid and Energy examines grid modernization and demand response; Smart Home and Building Automation applies related optimization patterns at building scale.
13.6 Smart Lighting Energy Savings
A 60 W LED at 50% average brightness is modeled as 30 W effective power, an 80% reduction from a 150 W high-pressure sodium lamp. Static LED replacement alone gives 60%. These are model assumptions, including a linear relationship between dimming and power, rather than measurements of every luminaire. The worked project later in this chapter uses a 15-year LED lifetime and shows maintenance contributing about 34% of gross annual benefit, within the original calculator’s approximate 30–35% range.
13.7 Simplify Waste Collection Before Adding Sensors
Lighting starts with powered assets; bins put measurement and battery life first. Smart waste management uses ultrasonic fill-level readings to change collection routes. An ultrasonic fill-level sensor estimates distance by timing a returning echo without touching the material. A distance estimate becomes a useful fill state only after calibration for its container.
Figure 2 shows the mounting problem. The small white sensor head sits on a bracket above a water-treatment channel, aimed down without contacting the water. The bracket, mounting height, clear line of sight, and armoured cable matter as much as the electronics. Sharp, wet, or sticky rubbish can be measured without contact, but foam, debris, and angled loads scatter echoes. The dark uneven surface illustrates why an uncalibrated reading cannot simply be treated as a trustworthy percentage full.

The chapter’s waste stack combines ultrasonic sensing with 10–15 cm accuracy, temperature sensing for fire detection, and tilt sensing for overflow or vandalism investigation. LoRaWAN or NB-IoT carries readings, with a modeled 5–10-year battery life that must fit reporting and field conditions. Route optimization, fill-level prediction, and seasonal pattern recognition feed fleet management, citizen reporting apps, and recycling tracking. The Smart Waste video shows how LoRaWAN fill-level data can support more efficient collection.
Dublin Airport illustrates the order of work. Custodians collected 840 bins four times daily because they could not see their fill state. The redesign first consolidated them into 80 larger triple stations, then installed 300 CleanCAP sensors, later called CleanFLEX, across stations and remaining bins. Stations combined ultrasonic sensing, cellular IoT connectivity, and solar power. Ecube Labs reports that daily collections fell from 3,360 to 240: about 93% from those counts, or 92.8% as reported by Ecube.
The lesson is to simplify the physical service footprint, instrument the assets that remain, and change routes from measured fill state. The reduction combines consolidation and sensing; attributing all of it to a radio or sensor would conceal the service redesign. Both lighting and waste now give the city a reason to ask which supporting infrastructure should be shared.
13.9 Choose Coverage, Ownership, and Reporting Together
Coverage is a service promise, not just a circle on a map. The separate coverage calculator estimates gateways from city area, a coverage radius, and an overlap multiplier. Its area calculation is useful for an initial budget; installed sensor positions still need surveys. Gateway infrastructure can represent less than 10% of the modeled deployment cost, making 1.5–2× overlap worth evaluating. Parking, waste, air-quality, and lighting sensors can share the same gateways if coverage and capacity support their combined workload.
13.10 LoRaWAN vs NB-IoT City Rollout
The chapter’s private LoRaWAN option assumes $2–5/device/year, city ownership of infrastructure and data, unlicensed spectrum, and no carrier dependency. It requires upfront gateways at roughly $1,000–3,000 each and an assumed 2–5 km radius. The carrier NB-IoT option avoids a city radio-network build and offers carrier-managed reliability with service-level agreements (SLAs), at $5–15/device/year and with dependence on operator coverage and pricing. Better building penetration is a possibility to survey, particularly in underground parking, rather than a guaranteed result.
Compare deployment scale, installed coverage, data sovereignty, and long-term cost. Test the assumed 5,000-device threshold above which LoRaWAN economics may improve, and the assumed 3–5-year payback. A working outdoor gateway does not establish a path through concrete to a buried parking sensor. Equally, a surveyed existing LoRaWAN network carrying small bin readings every four hours may avoid per-device carrier fees; it still needs gateway power, operation, and maintenance funding.
Platform ownership is another choice. A centralized platform offers one dashboard across parking, lighting, waste, and water, easier cross-domain analytics, and simpler vendor management. Its risks include a single point of failure, vendor lock-in, broad privacy exposure, and departmental resistance to losing control. A federated architecture connects departmental systems through application programming interfaces (APIs), preserving expertise and data ownership and allowing incremental adoption. Data minimization can reduce privacy exposure, while interoperability work, duplicate infrastructure, and harder cross-domain analysis remain costs.
Choose between these approaches using organizational culture, privacy requirements including GDPR data minimization, procurement constraints, and the expected value of cross-domain analysis. A single large contract and multiple smaller contracts create different management obligations. Shared data contracts need not require every city system to be centralized.
Reporting cadence follows the service decision. Sub-minute streaming supports adaptive traffic signals, timely parking guidance, and immediate leak detection, with higher infrastructure costs, more complexity, and possible operator overload. Hourly or daily batches suit trend analysis, strategic planning, and many municipal decisions, with lower cost and simpler auditing. Urban planning may use monthly aggregates; emergency-response optimization needs timely information. Test the assumed 3–5× real-time infrastructure cost against budget, staff capacity, and citizen expectations rather than buying speed for every sensor.
13.11 Put Maintenance and Privacy Into Procurement
The calculators can make investment look compelling while leaving its operating obligations invisible. A common failure is buying thousands of sensors with 3–5-year project budgets and no maintenance allocation. Installation costs and immediate returns dominate the proposal; political cycles favor visible new projects over sustaining existing assets. Maintenance is then treated as an unwanted operating expense.
Use the chapter’s recommended planning allowance of 15–20% of initial deployment cost annually for upkeep, battery replacement, and calibration, then validate it against the actual asset lifecycle. Require at least five years of supplier support, include sensor lifecycle management in procurement, and fund a dedicated IoT operations team instead of simply adding duties to existing IT staff. Remote diagnostics should identify failing sensors before the service loses quality.
The same procurement process must address data silos. Separate departmental budgets, vendors, and IT systems can produce independent dashboards for parking, air quality, traffic cameras, and waste. Specialized procurement and restrictive governance can prevent useful sharing even when the sensors are nearby. Establish standard APIs and a shared data platform such as Barcelona’s Sentilo before deploying domain-specific devices. Create cross-functional teams and upfront data-sharing agreements that state which observations may be correlated. Start with 2–3 high-value cross-domain uses and measure their value before expanding.
A shared pole also creates an easy route to privacy creep: an apparently small upgrade adds a camera or a vendor-bundled capability before policy catches up. The resulting symptoms include public backlash, challenges under GDPR, CCPA, or local privacy rules, personally identifiable information (PII) collected without a documented purpose, and inconsistent retention across sensor types.
Privacy by Design sets permitted collection and use before installation. Document every data type’s purpose and retention period, conduct Privacy Impact Assessments (PIAs) for new installations, and publish a sensor registry with collection capabilities. Establish a citizen privacy board to approve new deployments and publish an annual transparency report explaining collection and use. Differential privacy, edge processing, and aggregate-only analytics are techniques to evaluate within those rules.
13.12 Privacy-Preserving Video Analytics
Video analytics shows how that decision changes the architecture. Process frames at the edge, discard or mask them locally, and send aggregate events such as pedestrian counts, queue lengths, traffic flow, or safety incidents. Keeping raw faces and license plates out of city-wide storage can reduce bandwidth by orders of magnitude and make the purpose understandable: measuring civic conditions. The usefulness of a count does not require unrestricted retention of the identifiable scene.
13.13 Connect Observations to Accountable Public Value
Interoperability connects otherwise separate services through standard APIs. Without it, cities can accumulate 5+ citizen apps, redundant sensors measuring the same parameters, and emergency services without unified situational awareness. Sentilo illustrates a city-wide data platform through which parking observations can inform traffic routing and traffic observations can trigger adaptive lighting.
Require vendors to expose data through FIWARE NGSI-LD or similar open standards, and establish a Chief Data Officer with authority across departments before sensor deployment. The chapter recommends allocating 15–20% of smart-city investment to integration infrastructure, separately from the annual maintenance allowance. Its suggested 30–50% improvement in individual-deployment ROI is a planning claim to validate against measured cross-domain benefits, rather than a guaranteed return.

Follow the value chain all the way to an outcome. Collection captures parking occupancy, traffic-camera counts, waste fill, and light or motion events. Transport carries them over LoRaWAN, cellular, or mesh networks as appropriate to the service. Processing at the edge or in cloud and machine-learning systems produces events, patterns, predictions, and optimizations. Action changes citizen guidance, traffic control, collection routes, or infrastructure settings. Value is the resulting reduction in congestion, CO₂ emissions, or operating cost. Raw telemetry is evidence from the first stage, rather than proof of the last.
The protocol labs provide separate practice with pub/sub messaging for smart-city platforms. Use the Design Studio to trace a complete air-quality and traffic service from observations to accountable action.
Barcelona, Spain, brings the domains together. The chapter describes in-ground magnetic parking sensors with NB-IoT; current occupancy can guide drivers toward available spaces and reduce circling. Cisco’s Barcelona case profile is reported here as showing a $50 million annual increase in parking-fee revenue. Keep that revenue separate from congestion or emissions savings.
The lighting example uses LoRaWAN-connected adaptive lights with motion sensing, remote dimming, fault detection, and integrated air-quality sensors. Its electricity and maintenance benefits require comparison with existing lamps and schedules. The waste example combines ultrasonic sensors and LoRaWAN with optimized routes; fullness alerts can prevent overflows and improve cleanliness when staff act on them. Reduced trips and associated vehicle emissions depend on actually changing fixed collection schedules.
The water example uses pressure and flow sensors plus acoustic monitoring to detect leaks. Tracking network pressure and consumption also supports irrigation control. The same case profile is reported as showing $58 million in annual smart-water savings; it does not establish an investment figure or the previously asserted €75 million return. Sentilo connects all four domains, and an open-data portal gives citizens access to real-time city metrics. The profile also reports 47,000+ smart-city technology jobs. These are separate reported outcomes, rather than one audited citywide savings total.
For our city, the transfer is the chain of responsibility: a street asset supplies a place-specific observation, municipal infrastructure adds context and policy, and an operations service owns the dispatch, control change, or public update. Shared infrastructure earns its value only when the final action and outcome can be reviewed.
13.14 Audit Lighting Economics Before Choosing Finance
The shared platform still needs an investment case for each service. In the worked lighting scenario, a city of 250,000 people upgrades 15,000 high-pressure sodium (HPS) lights across 80 km². The comparison uses 150 W HPS lamps operating an average 12 hours/day at $0.12/kWh. It proposes 60 W LED fixtures with smart control and a 15-year lifetime, compared with three-year HPS bulb replacement.
The model gives 81.7% energy savings and approximately five-year simple payback. Read the calculation boundaries before using those results: lamp power is modeled from dimming level, maintenance follows assumed failures, and financing and software costs affect the city’s retained cash. The details below keep the calculation available without letting it replace the service-design argument.
Current System (HPS):
- 15,000 street lights city-wide
- Power consumption: 150W per light
- Operating schedule: Dusk to dawn (average 12 hours/day)
- Annual energy cost: $0.12/kWh
- Maintenance: Replace bulbs every 3 years at $45/bulb + $60 labor
- Annual energy: 15,000 × 0.15 kW × 12 hrs × 365 days = 9,855,000 kWh
Smart LED Option:
- LED fixtures: $280 per light (includes luminaire, driver, LED module)
- LoRaWAN controller: $85 per light (dimming, remote control, diagnostics)
- Gateways: 35 needed at $2,400 each (covers city’s 80 km² area)
- Installation: $120 per light (includes removal of HPS, mounting, commissioning)
- Network management software: $18,000/year
- Power consumption: 60W at 100% brightness (60% reduction vs. HPS)
- Maintenance: LED lifespan 15 years (vs. 3 years for HPS)
Adaptive dimming energy model
The modeled twelve-hour schedule uses 7 hours at 40%, 3 hours at 70%, and 2 hours at 30%; a field schedule still needs validation. Motion sensors brighten lamps to 100% when pedestrians are detected.
Weighted average power consumption:
- 40% brightness for 7 hours: 24W × 7 = 168 Wh
- 70% brightness for 3 hours: 42W × 3 = 126 Wh
- 30% brightness for 2 hours: 18W × 2 = 36 Wh
- Daily average: 330 Wh = 0.33 kWh per light per day
Annual energy (smart LED): 15,000 lights × 0.33 kWh/day × 365 days = 1,806,750 kWh
Comparison:
- HPS annual: 9,855,000 kWh
- Smart LED annual: 1,806,750 kWh
- Savings: 8,048,250 kWh (81.7% reduction!)
Annual energy cost savings: 8,048,250 kWh × $0.12/kWh = $965,790/year
Calculate Maintenance Cost Savings
HPS maintenance (per 3-year cycle):
- Bulb replacements: 15,000 × $45 = $675,000
- Labor: 15,000 × $60 = $900,000
- Annual average: $525,000/year
Smart LED maintenance:
- Assumed LED failure rate: 0.5%/year
- Annual replacements: 75 lights × ($280 + $120) = $30,000/year
- Annual average: $30,000/year
Annual maintenance savings: $525,000 - $30,000 = $495,000/year
Calculate Initial Investment
Capital Expenditure:
- LED fixtures: 15,000 × $280 = $4,200,000
- LoRaWAN controllers: 15,000 × $85 = $1,275,000
- Gateways: 35 × $2,400 = $84,000
- Installation: 15,000 × $120 = $1,800,000
- Network server software: $50,000 (one-time setup)
- Total CapEx: $7,409,000
Calculate ROI and Payback Period
Total annual savings:
- Energy: $965,790
- Maintenance: $495,000
- Total: $1,460,790/year
Net first-year cost:
- Initial investment: $7,409,000
- Annual operations: $18,000 (software)
- First-year savings: $1,460,790
- Net year 1: -$5,966,210
Payback period: $7,409,000 / $1,460,790 = 5.07 years
Simple payback is about 5.1 years before financing and operating-cost adjustments; later years still incur software operating costs.
Calculate 15-Year Net Present Value
Assuming 3% discount rate and 2% annual electricity price inflation:
15-year cumulative savings:
- Energy savings grow 2%/year from $965K base
- Maintenance savings constant at $495K/year
- Discount at 3%/year to present value
- Present value of gross savings: $19.057M over 15 years
Minus present value of software operations and initial investment: $19.057M - $0.215M - $7.409M = $11.433M, about $11.43M net benefit
Effective ROI: 154% discounted return over equipment lifetime
Additional Benefits (Quantified)
Light quality improvements:
- Specify LED color temperature and test visibility, glare, and color rendering at the actual street before claiming a safety benefit.
- Any avoided-crash benefit needs a stated baseline crash cost and evidence linking the lighting design to crash reduction; exclude it from the modeled $1.46M annual operating savings until measured.
Remote diagnostics:
- LoRaWAN controller reports failures, with installed reporting latency to be verified
- Reduces response time from 7 days (citizen complaint) to <24 hours
- Prevents “dark street” complaints, improves public safety perception
Carbon reduction:
- 8,048,250 kWh reduction × 0.5 kg CO₂/kWh (grid average)
- 4,024 metric tons CO₂ avoided annually
- Equivalent to removing 875 cars from roads
Data-driven city planning:
- Real-time energy consumption data
- Identifies malfunctioning lights when diagnostic reports arrive
- Optimizes dimming schedules based on actual traffic patterns
Financing Options
Option A: Upfront Capital
- City pays $7.4M from municipal bonds
- Keeps all $1.46M annual savings
Option B: Energy Service Company (ESCO)
- ESCO finances 100% of project
- The city pays the ESCO $1.2M/year for seven years from the modeled $1.46M annual gross savings; about $260K/year remains before other costs.
- After year 7, the city owns the system and keeps subsequent savings.
Option C: Leasing
- Lease payments: $850K/year for 10 years
- City keeps $610K/year savings ($1.46M - $850K)
- After 10 years, city owns equipment
- Benefit: Predictable costs, immediate cash flow positive
13.15 Match Finance to the Benefits the City Keeps
The example’s $495K annual maintenance reduction is about 34% of its $1.46M gross annual savings. LEDs alone save 60% of baseline energy; modeled adaptive control adds 21.7 percentage points to reach 81.7%. A fifteen-year LED lifetime avoids four intermediate three-year HPS replacement cycles. At $900K labor per full cycle, that is $3.6M gross avoided HPS labor before LED repair costs, rather than $2.1M.
The same 35 gateways may serve parking, waste, and air-quality devices if surveyed capacity and coverage allow. Financing can remove the upfront capital barrier, but the $1.2M ESCO payment or $850K lease must be compared with retained savings after the $18K annual software charge and other costs. Cash-flow claims follow those assumptions, rather than the financing label alone.
The separate parking exercise returns to 8,000 downtown spaces and tests whether a reduction from 14 to 4 minutes of search time creates the modeled benefit. It assigns driver time and fuel benefits as public value; adoption must be tested in an honestly bounded pilot. In that model, time value outweighs fuel savings by about 9:1. Coverage alone cannot establish that drivers will use or trust the guidance.
13.16 Validate the Smallest Service and Its Recovery
The financial case does not excuse an overbuilt prototype. Adding features before validating core needs can waste weeks when user testing reveals that simpler interactions were wanted. Define and test a minimum viable service, then add complexity in response to validated requirements. A bounded pilot should measure accuracy, freshness, maintenance, adoption, and savings before additional domains join the shared platform.
Security belongs in the initial design review, including prototypes. Hardcoded credentials, unencrypted channels, and absent firmware signing become expensive architectural problems when prototype patterns enter production. Shared infrastructure increases the importance of resolving those patterns before multiple departments depend on them.
Finally, test sensor failures, connectivity outages, and cloud unavailability explicitly. Devices need a safe, locally functional fallback during outages. The operations service should know what evidence it has lost before sending guidance or dispatching work. Low-confidence observations should not trigger a trusted alert: the separate code challenge uses a confidence cutoff of 0.8 and alerts only when an accepted value crosses the high or low service threshold.
These checks connect the first parking pilot to the larger programme. They test a supported service boundary and its recovery, rather than relying on installation totals. When 60% coverage and low trust are the only facts, the cause remains unknown; investigate accuracy, data age, app discoverability, enforcement, representation of uncovered spaces, and user needs before blaming a radio or a user preference.

13.17 Summary
Lighting, waste, parking, air quality, and water can share infrastructure while retaining distinct service responsibilities. Powered poles and gateways support reuse; calibrated sensing, surveyed coverage, and appropriate reporting cadence make observations useful. Shared platforms need open interfaces, departmental ownership rules, and purpose-limited data access.
Investment evidence must distinguish deployment savings, operating savings, public benefits, and municipal cash. Fund maintenance, calibration, batteries, and supplier support; set privacy rules before adding capabilities. Validate the smallest useful service and its recovery before expanding. Treat the infrastructure as a platform for continuous improvement rather than a one-time technology project.
Share assets where the evidence supports reuse, and keep every service’s owner, data purpose, failure response, and measured outcome explicit.
Transportation and Connected Vehicles carries the city-service story into V2X communication and autonomous mobility.