21 Transportation and Vehicles
More
Depth: Practitioner
Progress saves as you read. Mark sections complete as you go; your progress appears in the sidebar.
- Podcast audio coming soon
- Character narration audio coming soon
21.1 Two Messages, Two Responsibilities
Transportation IoT connects moving assets so people can route, maintain, insure, recover, and coordinate them. Its evidence concerns location, condition, timing, and handoff. The difficult part is deciding what that evidence permits someone to do.
Picture two messages from one bus. A crash warning must reach nearby road users at once; a fuel report can wait for the fleet office. Both are transport data, but a late result has a very different cost in each case. A school bus stopping for passengers could warn equipped cars nearby, including a car around a corner. That possibility depends on compatible equipment, coverage, and timely reception.
Start with the use case. Name the moving parties, the action, the time limit, and the safe result when data is missing. A trip card should name the road event, sender, receivers, oldest useful message, acceptable position error, and owner of the final choice. Keep separate cards for a safety alert, a service report, and a fleet trend.
Walk the alert through a tunnel, a street of tall buildings, a crowded road, and a quiet road. Compare sender and receiver timestamps. Keep lost and late messages in the record rather than hiding them in an average. Test after a unit restarts and during a network gap. A fast average does not establish the worst case, and a large data set does not remove blind spots.
Keep safety data, driver data, and business data under separate rules. Record location error, delay, loss, and who may act on each message. Review who can be tracked, how long routes must be kept, and who can correct a bad record. Passing a radio test does not settle privacy or support responsibilities.
An FHWA report cites $121 billion in 2011 congestion costs across 85 U.S. urban areas, including delay and excess fuel; this historical cost describes the problem, not today’s V2X market. source Fleet benefits likewise need a named result: TELUS reported fuel-economy improvement of more than 10%, rather than a guaranteed saving for every fleet. source
The problem is choosing a path whose timing, authority, and fallback fit the action. We will first separate those responsibilities, then compare the four V2X modes and their radios, trace collision warnings, and test fleet economics. Along the way, we will examine ten safety applications, the Institute of Electrical and Electronics Engineers (IEEE) 802.11p/WAVE stack, GPS accuracy, and OBD-II compatibility.
KEY CONCEPTS
- Telematics
Global Positioning System (GPS), accelerometer, and on-board diagnostics (OBD-II) evidence supports vehicle tracking, driver behaviour, and engine diagnostics.
- Electronic Logging Device
An ELD records truck-driver hours of service electronically under the FMCSA mandate.
- Over-the-air update
OTA delivers firmware or maps wirelessly without a physical connection or dealership visit.
- Geofence alert
An alert reports when an asset enters or exits a defined geographic boundary.
- Dynamic route optimisation
Live traffic, weather, and delivery constraints inform rerouting to reduce fleet travel time.
- Cold-chain logistics
Continuous condition monitoring supports temperature-controlled transport from origin to destination.
- Vehicle-to-Everything
V2X exchanges safety information among vehicles, infrastructure, pedestrians, and networks.
21.2 Learning Objectives
By the end of this chapter, you will be able to:
- Explain the four V2X communication modes (V2V, V2I, V2P, V2N) and their use cases
- Compare DSRC and C-V2X technologies for vehicular communication
- Identify the ten critical V2X safety applications and their impact
- Analyze the IEEE 802.11p/WAVE protocol stack for vehicular networks
- Diagnose common pitfalls in GPS accuracy and OBD-II compatibility
21.3 Separate Safety from Fleet Operations
Connected transport systems combine vehicle safety, fleet operations, passenger information, logistics, maintenance, charging, and road infrastructure. A useful design separates safety-critical messages from operational telemetry. A crash warning, traffic-signal phase, emergency-vehicle alert, cold-chain temperature excursion, depot charger schedule, and delivery ETA can all use IoT data, but they do not have the same latency, privacy, authority, fallback, or audit needs. Treat the vehicle as a moving edge system that crosses ownership boundaries many times a day.
Figure 1 answers where the line falls between messages that must arrive now and messages that can wait.
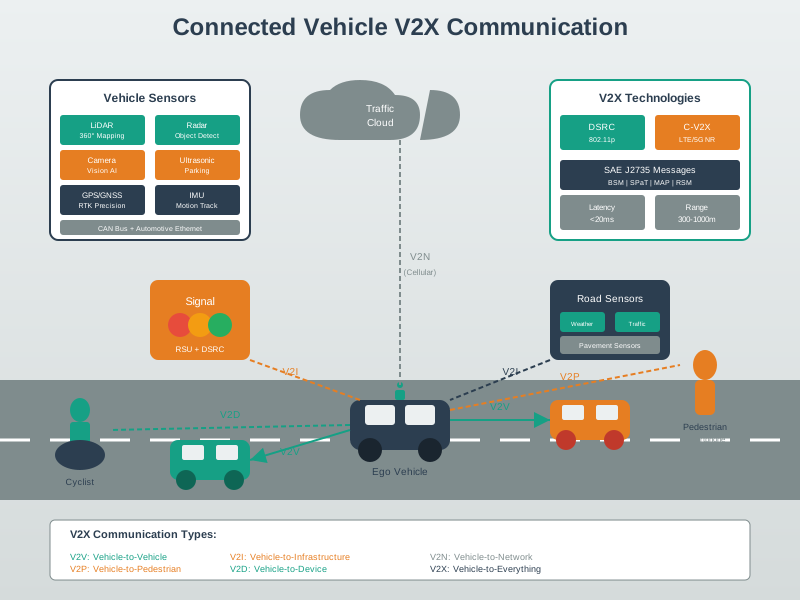
The vehicle sits at the centre of Figure 1, carrying its own sensors and sharing position, speed and brake state. Read the upper group first. Three short-range links reach a nearby car, a roadside signal and a pedestrian’s phone, and all three carry warnings that are only useful while they are fresh. The note beside them is the practical part, because it asks how old a message is and whether local sensors agree before the car acts on it. Now read the lower path. One cellular link carries a fleet report to the cloud, and it can tolerate delay without harm. The figure keeps those groups apart on purpose. Mixing a fuel report into the same queue as a crash warning is how timing budgets fail.
Starting from Figure 1, ask which action changes. Does the driver need a warning, the vehicle need a control input, the dispatcher need a route change, the maintenance team need a work order, the charger need a schedule, or the customer need a delivery update? The answer determines which data path is allowed. A V2V blind-intersection warning needs local, low-latency broadcast and message freshness checks. A fleet fuel-efficiency report can tolerate cloud latency but needs clean trip, driver, vehicle, and route context. A refrigerated trailer exception needs proof of condition, door events, probe calibration, route segment, custody handoff, and escalation ownership.
- Safety question: is the message advisory, driver-facing, automated, or part of a regulated vehicle function?
- Fleet question: which vehicle, driver, route, cargo, trailer, charger, or maintenance workflow does the event affect?
- Fallback question: what happens when global navigation satellite system (GNSS), cellular, roadside units, cloud services, or the vehicle gateway are unavailable?
A strong transport IoT design is therefore explicit about who may act on each signal. Drivers, dispatchers, maintenance technicians, warehouse teams, charging operators, insurers, emergency services, and customers all see different slices of the same moving asset. Good design prevents one slice from pretending to be the whole system: the dashboard should not hide stale GNSS fixes, the route engine should not override safety constraints, and the over-the-air (OTA) service should not treat a parked passenger vehicle and a loaded delivery truck as equivalent rollout targets.
21.6 Choose Among Four V2X Modes
With the action and authority recorded, choose who needs to communicate. At an intersection, another car can report a red-light conflict through V2V, a traffic signal can supply its phase through V2I, a pedestrian’s smartphone can support a V2P warning, and a network service can relay a black-ice report from 2 miles ahead through V2N. A signal might announce green in 5 seconds. These reports extend awareness beyond the bus’s own sensors; their timing and coverage still require checking.
V2X encompasses four primary communication modes, each addressing different safety and efficiency needs:
- V2V (Vehicle-to-Vehicle)
- Connection: Car to Car (VANET)
- Primary purpose: Collision avoidance, platooning, cooperative driving
- Illustrative latency target: <10 ms
- Key challenge: Fast topology changes (highway speeds = 30m/s relative motion)
- V2I (Vehicle-to-Infrastructure)
- Connection: Car to Roadside Units
- Primary purpose: Traffic signal priority, hazard warnings, tolling, parking guidance
- Illustrative latency target: <100 ms
- Key challenge: Deployment cost (retrofit existing infrastructure)
- V2P (Vehicle-to-Pedestrian)
- Connection: Car to Smartphones
- Primary purpose: Pedestrian detection, crosswalk warnings, vulnerable road user alerts
- Illustrative latency target: <100 ms
- Key challenge: Privacy concerns, smartphone battery drain, adoption rate
- V2N (Vehicle-to-Network)
- Connection: Car to Cloud
- Primary purpose: Navigation, OTA updates, infotainment, fleet management
- Illustrative latency target: <1 second
- Key challenge: Bandwidth costs and cellular coverage gaps; the 4 TB/day example is raw sensor production, not required V2N upload traffic
VANET (Vehicular Ad-hoc Network): The foundation of V2V communication
- Topology: Highly dynamic - vehicles join/leave network at 100+ km/h
- Challenge: Traditional ad-hoc routing protocols (AODV, DSR) designed for slower-moving nodes
- Solution: Geographic routing (GPSR) and beacon-based approaches
VANET designs also expose a naming problem. A host-centric TCP/IP path is brittle when the useful information is tied to a road segment, hazard, or traffic state rather than to one fixed server address. Content-centric or information-centric forwarding can name the warning, map update, congestion record, or parking state directly, then cache or forward it near vehicles that need it. Whatever forwarding model is used, the safety record still needs scope, freshness, signature, privacy boundary, and expiry rules so stale or forged content is not treated as road truth. Figure 2 zooms into that safety work for one blind-intersection V2V warning.
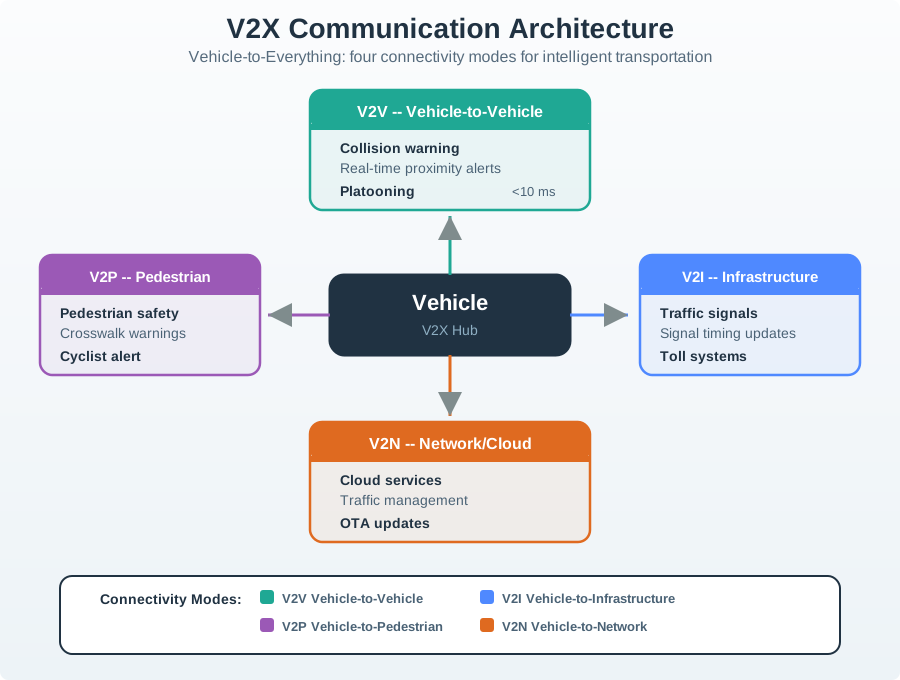
Figure 2 zooms into V2V, one of the four V2X modes listed above, because a collision warning makes message freshness concrete. The local sensor sight-line is blocked at the intersection, while the direct V2V path carries the chapter’s safety fields without a cloud hop. Read the figure from the BSM record to the receiver checks: message age or freshness, signature or trust, confidence, and agreement with local sensors all matter before the warning is acted on. The 300–1000 m DSRC range and <10 ms link-latency values describe the direct radio path; they are not a substitute for those application checks. The worked chapter scenario then compares a warning at 1.8 s before impact with a 0.6 s unaided surprise reaction, giving 3× the reaction time and about 33 m of additional reaction distance at 100 km/h.
21.7 Add Connected Awareness to Local Sensing
Vehicle safety has evolved through three distinct stages, each enabled by progressively more sophisticated IoT technologies:
- Passive Safety
- Era: 1960s-1990s
- Key technologies: Mechanical engineering
- What it does: Minimize injury during collision
- Industry players: Traditional automakers
- Active Safety
- Era: 2000s-2010s
- Key technologies: Sensors, electronics, semiconductors
- What it does: Prevent collision or minimize impact before collision
- Industry players: Traditional automakers plus electronics suppliers such as Bosch and Continental
- Connected Mobility
- Era: 2015s-present
- Key technologies: V2X, 5G, AI, cloud
- What it does: Coordinate with environment to avoid collision entirely
- Industry players: Traditional automakers plus tech companies such as Google, Tesla, and telecom operators
The distinction matters when local sensors cannot establish what is ahead.
Sensor Limitations:
- Cameras fail in fog, heavy rain, direct sunlight
- LIDAR range limited to ~200m, blind to occluded objects
- Radar cannot read traffic signs and may have difficulty distinguishing pedestrians from other objects
V2X Advantages:
- Sees around corners: Receives warnings from vehicles beyond line-of-sight
- Predictive: Knows what traffic signals will do 10-15 seconds ahead
- Collaborative: Vehicles sharing sensor data can extend one another’s view of road conditions, although model quality depends on coverage and data quality.
- Visibility complement: Radio warnings can remain useful in fog or blizzards, but this does not establish fail-safe operation
The “Sensor Fusion + V2X” Approach: Leading automakers now combine:
- Local sensors (camera/LIDAR/radar) for immediate surroundings (0-200m)
- V2V/V2I for extended awareness (200m-2km ahead)
- V2N for strategic route planning (entire trip)
Figure 3 answers why V2X counts as a new capability rather than a better sensor.
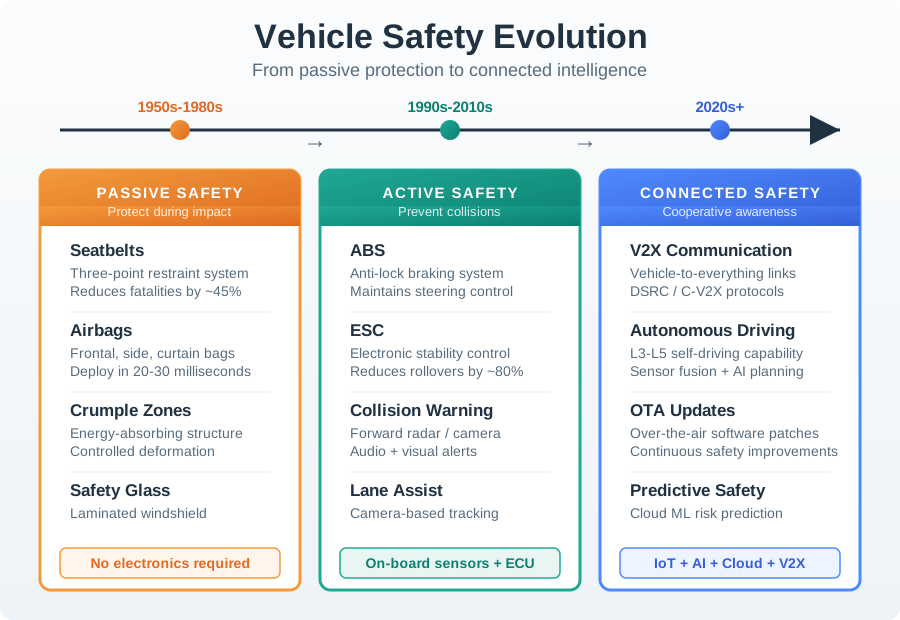
Read the middle band of Figure 3 rather than the dates. Each era is defined by when it acts. Passive safety works during the crash and only limits injury. Active safety works just before the crash, using sensors and electronics to brake or warn. Connected mobility works beyond line of sight, and that is a different capability again, because no camera or radar on the car can see around a building. The argument for V2X is that one row. The closing note guards against the obvious misreading, because the eras stack rather than replace. A connected car still has belts and airbags, and it still brakes on its own. V2X adds the case none of the earlier layers could reach.
Figure 3 demonstrates a fundamental shift in safety philosophy: from minimizing injury during crashes (passive) to preventing crashes through prediction (connected). Each era builds on the previous—connected vehicles still have airbags, while warnings may help avoid a crash by receiving warnings from vehicles they cannot see.
The same separation appears across a connected journey. Summon uses GPS, cellular, and cloud scheduling to send a user’s location to dispatch: tapping an app can bring a vehicle in minutes. Route combines V2I and traffic sensors to choose a path through congestion. Travel uses V2V and DSRC/C-V2X for inter-vehicle coordination, including cooperative highway platoons. Connect uses 5G, Wi-Fi, and infotainment for work, entertainment, and climate interaction. Arrive uses parking sensors and V2I to supply availability and support self-parking. Each step needs its own permission and fallback.
21.8 Trace a Blind-Intersection Warning
To understand how V2X saves lives, follow Figure 4 through a potential intersection collision being prevented:
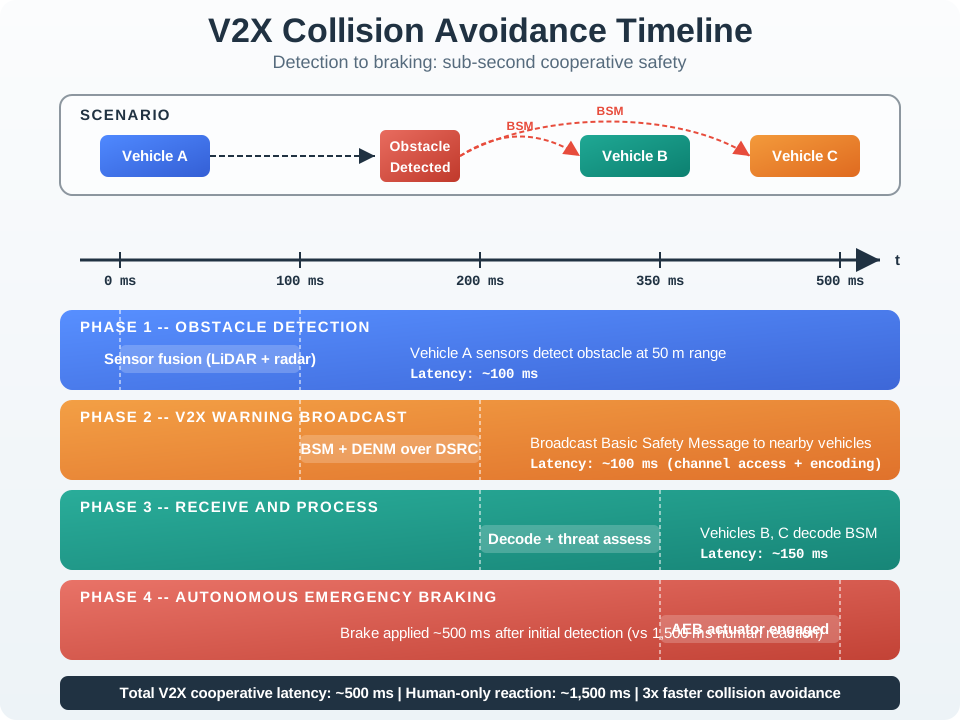
Figure 4 illustrates why V2X requires <10 ms latency: with vehicles approaching at combined speeds of 100+ km/h, every millisecond matters. The Basic Safety Message (BSM) broadcast every 100 ms provides continuous position updates, enabling collision prediction 2-3 seconds before impact—enough time for both automated systems and human drivers to react.
The big picture: Two vehicles approaching an intersection at 100 km/h (28 m/s each) have ~2 seconds before collision. The example uses continuous position broadcasts and predictive algorithms to warn about the conflict; prevention still depends on the response.
Step-by-step breakdown:
- Continuous broadcasting: Each vehicle transmits Basic Safety Messages (BSM) via DSRC every 100 ms containing GPS position, speed, heading, acceleration. - Message-size example: A reviewed DSRC study describes 320–350-byte average BSMs sent 10 times per second; channel congestion still depends on vehicle density and security overhead. source
- Collision prediction: Vehicle B receives Vehicle A’s BSM, calculates intersection point of trajectories, determines time-to-collision is 1.8 seconds. - Real example: The worked example assumes a trajectory calculation below 5 ms using simple kinematics; it does not remove the receiver’s confidence and local-sensor checks.
- Warning escalation: At 1.8s: visual dashboard alert. At 1.2s: audible warning. At 0.8s: pre-charge brakes for emergency stop. - In this collision scenario: An assumed 1.8-second warning lead gives a driver time to respond; actual reaction and braking time vary. The figure’s roughly 500 ms automated response and 1,500 ms human-only response are a separate illustrative comparison from the 1.8 s versus 0.6 s warning windows.
Why this matters: The <10 ms DSRC latency is critical - at 100 km/h, a vehicle travels 28 meters per second. A 100 ms delay (like cellular network) means the car travels 2.8 meters before responding. V2X warns drivers about collisions they literally cannot see around blind corners.
21.9 Match Warnings to Ten Crash Patterns
V2X enables ten critical safety use cases that address the most common crash scenarios:
- Intersection Collision Warning
- Prevents: T-bone crashes at intersections
- How V2X helps: Warns if another vehicle will enter your path
- Impact: FHWA recorded 10,148 US traffic fatalities involving an intersection in 2018; intersection warnings target only a subset of these events. source
- Lane Change Assistance
- Prevents: Blind-spot collisions
- How V2X helps: Alerts if a vehicle is in the blind spot during lane changes
- Impact: Potential reduction in blind-spot conflicts; quantify prevention only from a named evaluation.
- Rear-End Collision Warning
- Prevents: Following-too-close crashes
- How V2X helps: Warns if closing speed is too fast for safe stopping
- Impact: 1,700,000 rear-end crashes per year
- Emergency Vehicle Warning
- Prevents: Accidents involving ambulances and police vehicles
- How V2X helps: Alerts drivers to yield and provides direction plus distance
- Impact: 6,500 crashes per year involving emergency vehicles
- Cooperative Merging
- Prevents: Highway merge collisions
- How V2X helps: Coordinates gap creation for merging vehicles
- Impact: 300,000 merge-related crashes
- Emergency Brake Warning
- Prevents: Multi-car pile-ups
- How V2X helps: Propagates hard-braking alerts to following vehicles
- Impact: Critical in low-visibility conditions
- Wrong Way Drive Warning
- Prevents: Head-on collisions
- How V2X helps: Alerts a driver entering a highway exit or one-way street in the wrong direction
- Impact: 355 deaths per year from wrong-way driving
- Signal Violation Warning
- Prevents: Red-light-running crashes
- How V2X helps: Warns if a vehicle will enter the intersection on red
- Impact: 165,000 crashes per year from red-light running
- Hazardous Location Warning
- Prevents: Crashes at known danger zones
- How V2X helps: Alerts approaching vehicles to black ice, sharp curves, or accidents ahead
- Impact: Variable, depending on the hazard location
- Control Loss Warning
- Prevents: Skidding and rollover accidents
- How V2X helps: Shares traction-loss data with nearby vehicles
- Impact: NHTSA cited control loss in 18% of fatal crashes in a 2011–2015 light-vehicle analysis; warning effectiveness is a separate question. source
Total Potential Impact:
V2X can warn about selected conflicts; avoided crashes and lives saved depend on deployment, driver response, and measured effectiveness.
- For scale, NHTSA estimated $340 billion in total US motor-vehicle crash economic costs in 2019; V2X avoided costs require deployment and effectiveness assumptions. source
21.10 Choose a Radio for the Required Path
The bus’s warning and fleet report need different wireless paths. These are the chapter’s comparison ranges, not guarantees for every radio or deployment.
| Technology | Frequency | Transmit power | Range | Data rate | Transport role |
|---|---|---|---|---|---|
| Bluetooth (BLE) | 2.4 GHz | 10 mW | 10–50 m | 1–3 Mbps | V2P pedestrian detection; V2S in-vehicle links |
| Zigbee (802.15.4) | 2.4 GHz | 10–100 mW | 10–100 m | 20–250 kbps | V2S sensor networks; V2R parking sensors |
| DSRC (802.11p) | 5.9 GHz | 20–33 dBm | 300–1000 m | 3–27 Mbps | Historical direct V2V/V2I safety messaging |
| Cellular Uu (LTE/5G) | Licensed cellular | 23 dBm | 1–10 km | 10–100+ Mbps | V2N network services; network-mediated V2I |
| 60 GHz mmWave | 60 GHz | 10–100 mW | 1–10 m | 1–7 Gbps | V2V high-speed data exchange |
C-V2X PC5 uses a direct sidelink in the region’s designated ITS spectrum; its range, power, and throughput require a separate deployment-specific link budget.
Apply the requirements before comparing advertised speed.
For Safety-Critical V2V (<10 ms latency required):
- DSRC (802.11p): Legacy direct messaging with no infrastructure handshake; check regional spectrum and deployment status
- C-V2X PC5 (sidelink): Direct vehicle-to-vehicle, no network needed
- Bluetooth/Zigbee: Too short range, not designed for high-speed mobility
- Cellular (network-based): Infrastructure dependency, latency too high
For Infrastructure Communication (V2I):
- C-V2X: PC5 sidelink exchanges nearby safety messages directly without cellular coverage; Uu uses cellular networks for V2N and cloud services.
- DSRC: Dedicated roadside units (RSU), reliable but expensive deployment
For In-Vehicle Networks (V2S):
- CAN bus: Legacy standard, 1 Mbps
- Automotive Ethernet: 100 Mbps-1 Gbps, replacing CAN in modern vehicles
- Bluetooth/Zigbee: Wireless sensor integration (tire pressure, aftermarket OBD-II)
The “Hybrid Approach”: Region-specific deployments may support DSRC or C-V2X, so verify the local spectrum rules and installed technology before planning interoperability:
- Ensure interoperability across different regions (EU uses ITS-G5/DSRC, China mandates C-V2X)
- Provide redundancy for safety-critical functions
- Use C-V2X Uu for cellular network services and direct PC5 sidelink where deployed; treat DSRC as a historical U.S. deployment being phased out
The technology table is a menu, not a decision by itself. The design question is still whether the message must work with no infrastructure, tolerate cloud latency, protect a vulnerable road user, or feed a fleet workflow.
For the bus’s local processing target below 10 ms, Edge/Fog Computing explains why a cloud round trip of 50–200 ms is unsuitable. Mobile/Wireless Networking explains the cellular infrastructure behind V2N, while Cellular IoT develops LTE-V2X and 5G-V2X. Bluetooth Fundamentals supplies the BLE background for smartphone-based V2P detection.
21.11 Understand Immediate Broadcast and Its Limits
DSRC is a historical U.S. 5.9 GHz deployment. The FCC moved 5.850–5.895 GHz to unlicensed use and reserved 5.895–5.925 GHz for C-V2X, phasing out DSRC. A legacy stack remains useful to understand, but it is not a current deployment recommendation. C-V2X PC5 supports direct sidelink messaging without network coverage; Uu supports cellular network services.
Wi-Fi Fundamentals introduces the MAC/PHY from which 802.11p developed. The important vehicle distinction is immediate broadcast without an association handshake. A 100 ms BSM repetition interval describes how often messages repeat, not how long two cars remain in range.
21.12 DSRC/WAVE Protocol Stack
DSRC (Dedicated Short Range Communications) is a historical technology for V2V and V2I safety applications, particularly in North America; Europe uses the related ITS-G5 profile. Its stack description is useful for understanding deployed and legacy systems. It’s built on two key IEEE standards:
IEEE 802.11p: Physical and MAC Layer (based on Wi-Fi, but optimized for vehicles)
- Frequency
- 802.11p (DSRC): historically used 5.850–5.925 GHz in the U.S.; the FCC now reserves only 5.895–5.925 GHz (30 MHz) for ITS using C-V2X, with DSRC being phased out.
- 802.11n (Wi-Fi): 2.4/5 GHz ISM bands
- Why different: Historical DSRC spectrum was set aside for safety messaging; current U.S. spectrum use follows the FCC’s revised allocation.
- Channel Width
- 802.11p (DSRC): 10 MHz
- 802.11n (Wi-Fi): 20/40 MHz
- Why different: Robust in high Doppler (vehicles at 200+ km/h)
- Data Rate
- 802.11p (DSRC): 3-27 Mbps (typically 6 Mbps)
- 802.11n (Wi-Fi): 54-600 Mbps
- Why different: Reliability over speed for safety messages
- Association
- 802.11p (DSRC): None required
- 802.11n (Wi-Fi): WPA2 handshake (seconds)
- Why different: No association handshake is needed before a safety broadcast.
- Range
- 802.11p (DSRC): 300-1000m
- 802.11n (Wi-Fi): 50-100m
- Why different: Early warning for high-speed scenarios
- Latency
- 802.11p (DSRC): <10 ms
- 802.11n (Wi-Fi): 20-100 ms
- Why different: Real-time safety requirements
Key Innovation: 802.11p eliminates the association handshake. Vehicles can broadcast safety messages upon entering range; at 100 km/h each, two approaching vehicles have several seconds across a 300 m radio range, not only 100 ms.
IEEE 1609 (WAVE - Wireless Access in Vehicular Environments): Upper Layer Protocols
- IEEE 1609.2 (Security): Digital signatures on safety messages, certificate management, and privacy protection; a 5-minute pseudonym change is an illustrative policy, not a universal requirement
- IEEE 1609.3 (WSMP): Lightweight protocol, connectionless, priority queuing for safety messages
- IEEE 1609.4 (Multi-channel): The historical U.S. WAVE plan included safety Channel 172 and service channels within 174–184; CCH 178 had the control-channel role.
- SAE J2735 (Message Set): 20+ standardized message types including Basic Safety Message (BSM) broadcast every 100 ms
Inspect Figure 5 to see how a safety message moves from its application format to a radio link designed for immediate broadcast.
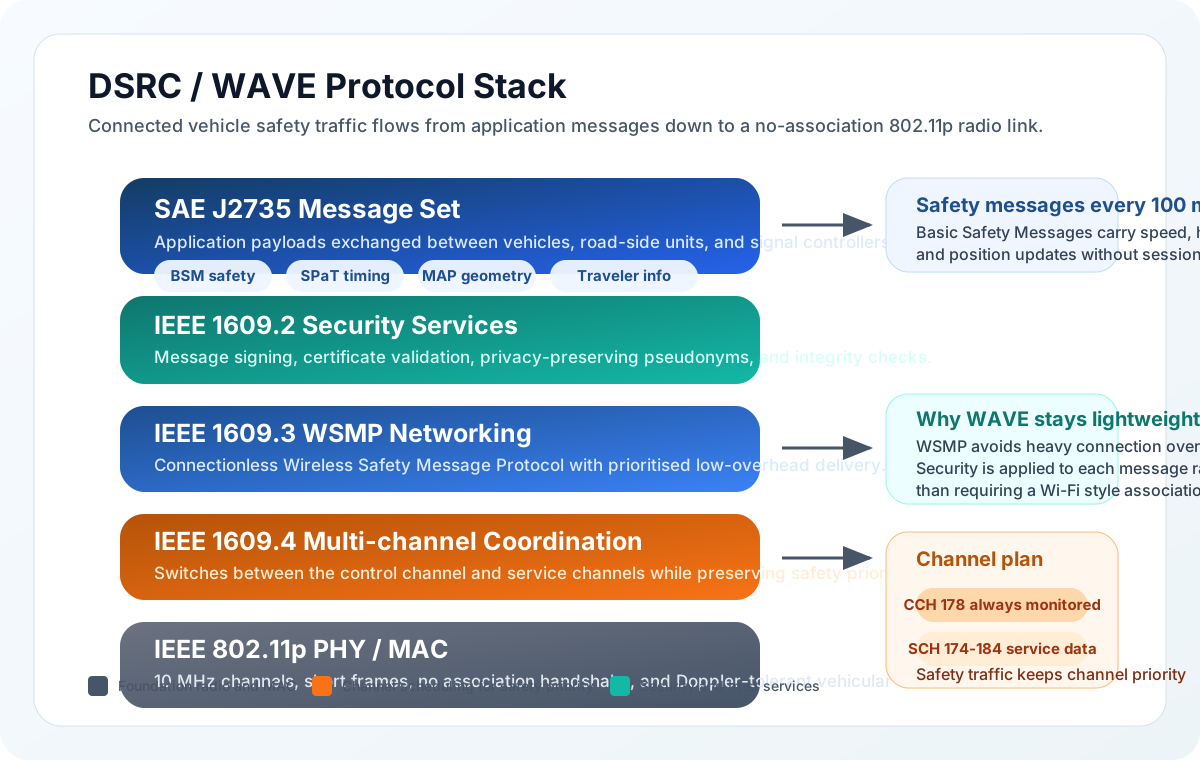
Trace one safety message down the stack. Check its deadline. Read Figure 5 downward from the SAE J2735 message set. A Basic Safety Message can repeat every 100 ms, while IEEE 1609.2 signs each safety message and manages certificates and privacy. WSMP supplies lightweight, connectionless network delivery with priority for safety traffic. IEEE 1609.4 separates safety and service channel roles, and 802.11p broadcasts without an association handshake. That bottom feature supports latency below 10 ms, but the complete path still depends on timely signing, channel access, and application processing; radio speed alone does not guarantee a safe response.
The historical DSRC/WAVE stack in Figure 5 was designed for low-latency safety messaging. Unlike Wi-Fi, there’s no association handshake—vehicles broadcast Basic Safety Messages (BSM) immediately upon entering range. In the historical U.S. WAVE channel plan, the Control Channel (CCH 178) carried safety-critical messages, while service channels carried non-urgent data.
Moving from 2.4 to 5.9 GHz costs 7.81 dB at the same distance, while DSRC’s 20–33 dBm transmit power can repay that penalty. Moving from 5.9 to 60 GHz adds 20.1 dB of frequency loss; widening 10 MHz to 2.16 GHz adds 23.3 dB of thermal-noise bandwidth. A simplified 43.5 dB combined penalty maps the chapter’s 300–1000 m DSRC range to roughly 2.0–6.7 m, within its 1–10 m mmWave comparison range.
21.13 Test Position and Vehicle Compatibility
The bus can have a suitable radio and still deliver unusable evidence. Test the position estimate and the vehicle interface before relying on either for a warning or a fleet report.
The mistake: Designing vehicle tracking and navigation systems that assume consistent GPS accuracy, failing to account for signal degradation in urban environments where tall buildings create “canyons” that block or reflect satellite signals.
Symptoms:
- Vehicle position jumping erratically between buildings or appearing on parallel streets
- Position errors of 50-200 meters in downtown areas versus 3-5 meters in open areas
- Navigation instructions arriving too late for turns in dense urban cores
- Fleet management showing vehicles inside buildings or on wrong roads
Why it happens: GPS signals require line-of-sight to multiple satellites. Tall buildings block direct signals and create multipath reflections where signals bounce off surfaces, arriving at the receiver with incorrect timing. In one urban-canyon GNSS field study, some epochs had only 1–4 line-of-sight satellites despite more satellites being detectable by reflected paths, degrading positioning. source
The fix: Use multi-constellation receivers (GPS + GLONASS + Galileo + BeiDou) to increase visible satellites. Implement sensor fusion combining GPS with inertial measurement units (IMU), wheel odometry, and map matching. Use dead reckoning to bridge GPS outages in tunnels and urban canyons.
Prevention: Test navigation systems in your target deployment cities, not just suburban test tracks. Specify GPS receivers with multipath rejection algorithms for urban applications. Design applications to degrade gracefully when position uncertainty exceeds thresholds.
Figure 6 is worth a close look before the pitfall is named, because everything standard about this device is on the outside.

Look first at the black trapezoid plug on the cable in Figure 6. That shape and its sixteen pin positions are fixed by the standard, which is why any dongle mates with any car built to it. Now look at the opened case in the middle. A small microcontroller, a handful of indicator lamps and a short ribbon are all that sit between the plug and the host lead, so the interpreting is done by firmware on that one chip. Finally note the cable running off to a laptop or logger. Nothing in this picture is specific to a make or model. The socket is common and the electronics are generic, so the vehicle-specific behaviour lives entirely in bus messages the dongle has to get right.
The mistake: Assuming all vehicles have standardized OBD-II port behavior, leading to fleet telematics devices that work on some vehicles but fail, cause dashboard warnings, or drain batteries on others.
Symptoms:
- Check Engine lights appearing after telematics device installation
- Devices working on newer fleet vehicles but failing on older models
- Vehicle batteries draining overnight when parked with device connected
- Inconsistent data quality across mixed vehicle fleets
Why it happens: While OBD-II physical connectors and basic emissions protocols are standardized, manufacturers implement proprietary extensions, different CAN bus speeds (250 kbps vs 500 kbps), and varying power management behaviors. Some vehicles provide constant 12V power to OBD port (drains battery), others switch power with ignition.
The fix: Use OBD devices with vehicle-specific compatibility databases and firmware. Implement passive-only CAN bus monitoring (read-only) rather than active queries that may confuse vehicle ECUs. Add low-power sleep modes with ignition detection to prevent battery drain.
Prevention: Request detailed vehicle compatibility lists from telematics vendors, including specific model years and trim levels. Avoid devices that require active CAN bus communication unless absolutely necessary. Include OBD compatibility testing in your vehicle procurement specifications.
Misconception 1: “V2X replaces onboard sensors (cameras, LIDAR, radar).” V2X is a complement to onboard sensors, not a replacement. Sensors provide high-resolution, real-time perception of the immediate environment (0-200m), while V2X extends awareness beyond line-of-sight (200m-2km). A vehicle still needs its own sensors to detect unmarked potholes, debris, or animals that no other connected device has reported. The industry consensus is “sensor fusion + V2X” for redundancy and maximum safety coverage.
Misconception 2: “C-V2X is strictly better than DSRC because it uses newer cellular technology.” C-V2X and DSRC serve overlapping but distinct roles. DSRC (802.11p) has a critical advantage for safety: it requires zero infrastructure. Two vehicles on a remote highway with no cellular coverage can still exchange collision warnings via DSRC. C-V2X’s network-based mode (Uu interface) depends on cellular infrastructure availability. C-V2X PC5 sidelink does support direct communication, but DSRC has over a decade of field-tested deployment. A design must verify installed technology and regional interoperability rather than assume both radios are present.
Misconception 3: “Connected vehicles generate too much data for existing networks to handle.” While a single autonomous vehicle generates up to 4 TB/day of raw sensor data, this data is processed locally on the vehicle. The actual V2X network traffic is modest: a Basic Safety Message (BSM) is only 300-400 bytes, broadcast 10 times per second. In the U.S., the FCC now reserves 30 MHz for ITS using C-V2X, while DSRC’s former 75 MHz allocation has been revised. Fleet cloud aggregation and local channel congestion are different sizing problems; small BSMs do not eliminate congestion when vehicle density and security overhead rise.
21.14 Turn Fleet Telemetry into a Decision
The slower message from the bus now has its turn. Its fuel report creates value when a dispatcher, driver, or maintenance technician changes the next trip. That needs a complete operational path, even when milliseconds are not decisive.
Beyond V2X safety applications, connected vehicle IoT enables comprehensive fleet management:
Inspect Figure 7 to follow vehicle evidence through the in-vehicle, network, and cloud boundaries to an action for a driver or fleet manager.
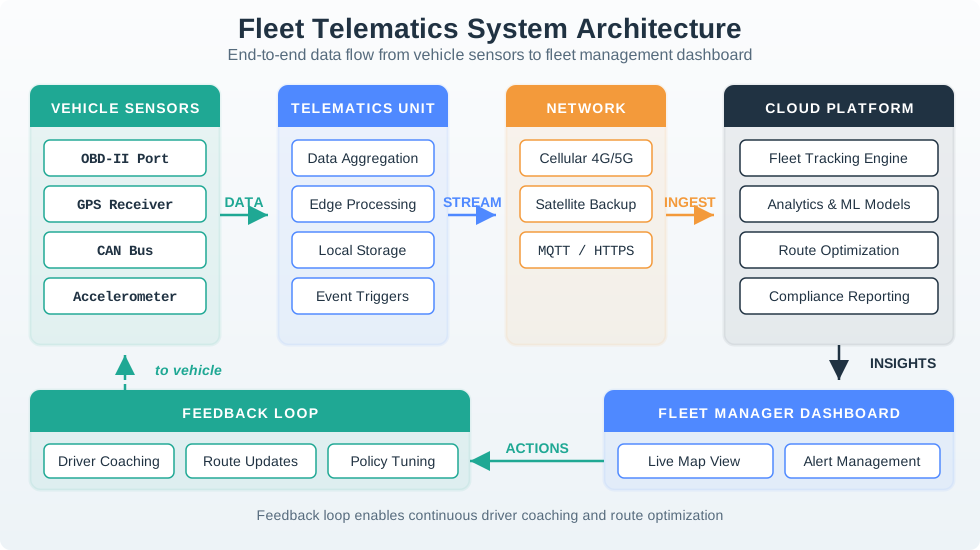
Read Figure 7 from GPS, driving behavior, engine codes, and fuel use into the in-vehicle unit. An OBD-II dongle or factory TCU collects the signals, while edge processing can clean or reduce them before transmission. Cellular carries routine fleet traffic; satellite is an option where remote coverage justifies its cost. The cloud then turns vehicle data into tracking, geofence alerts, maintenance forecasts, route changes, or coaching. The return path matters: telemetry creates value only when an output reaches the person who can change the next trip.
Figure 7 shows how vehicle data flows from onboard sensors through an edge processing unit, over cellular networks to a cloud platform, and finally to actionable outputs for fleet managers and drivers.
Key Capabilities:
- Real-time tracking: GPS position, route adherence, geofencing alerts
- Driver behavior: Harsh braking/acceleration, speeding, phone usage detection
- Vehicle diagnostics: Engine codes, predictive maintenance, fuel consumption
- Compliance: Hours of service (ELD mandate), temperature monitoring (cold chain)
Technology Stack:
- In-vehicle unit: OBD-II dongle or factory-integrated telematics control unit (TCU)
- Connectivity: Cellular (4G/5G), satellite for remote areas
- Cloud platform: Route optimization, reporting, driver coaching
- Integration: Dispatch systems, ERP, customer notifications
ROI Drivers:
- Route optimization and driver coaching can improve fuel economy; TELUS reported more than 10% improvement since 2019 in a telematics-enabled fleet program. source
- Predictive maintenance can reduce costs; Interstate Batteries reported approximately 10% lower maintenance costs after telematics deployment. source
- For a fleet pilot, set a 15% utilization-improvement target from real-time vehicle-use visibility and check it against the baseline.
- Telematics-based insurance can reduce premiums when a policy offers it; State Farm’s qualifying business program lists a 10% initial participation discount and behavior-based renewal pricing. source
21.15 Evaluate the 120-Vehicle Investment
The following budget is a worked decision, not a promised return for the bus fleet. Preserve the baseline before comparing a pilot: fuel, maintenance, insurance, utilisation, and incident counts measure different outcomes. A diagnostic alert should be checked against technician-confirmed faults, and a cost reduction should be checked against maintenance records. The evidence must connect a report to a useful operational response.
Keep the timing of cash flows visible as well. Device installation is an upfront expense; connectivity and platform charges recur. Insurance savings begin later than fuel and maintenance savings, and a deferred vehicle purchase occurs once. Mixing these categories can make a sound project appear to repay faster than the assumptions support. The calculator lets you change those assumptions on its separate page.
Scenario: A regional delivery company with 120 vehicles (mix of vans and trucks) is evaluating a telematics investment. Current annual fleet costs: $4.2M.
Given:
- Fuel: $1.68M/year (40% of fleet costs)
- Maintenance: $630K/year (15% of fleet costs)
- Insurance: $504K/year (12% of fleet costs)
- Vehicle utilization: 68% (32% idle or underused)
- Accident rate: 4.2 incidents per 100 vehicles/year
Investment:
- Upfront devices and installation: $95 + $45 per vehicle, $16,800 total
- Annual connectivity and platform: $8 + $12 per vehicle/month, $28,800/year total
- First-year total cost: $45,600
Savings calculation under the stated assumptions:
-
Fuel reduction (12% from route optimization + driver coaching):
- $1.68M x 12% = $201,600/year
- Sources: 7% from optimized routes, 3% from reduced idling, 2% from smoother driving
-
Maintenance reduction (22% from predictive analytics):
- $630K x 22% = $138,600/year
- Sources: Early detection of engine codes, optimized oil change intervals, tire pressure monitoring
-
Insurance reduction (15% from telematics-based policy):
- $504K x 15% = $75,600/year
- Requires 6 months of driving data before insurer applies discount
-
Utilization improvement (68% to 76%):
- 8% improvement on 120 vehicles = 9.6 vehicles worth of capacity recovered
- Deferred purchase of 4 vehicles at $45K each = $180,000 (one-time)
Result: Savings after all discounts activate are $415,800 per full year. Because the insurance discount starts after six months, first-year gross benefit is $378,000 against first-year cost of $45,600, or 8.3x gross benefit/cost. Under the default assumptions, simple upfront payback is about 20 days: $16,800 upfront devices and installation divided by $311,400 in annual fuel and maintenance savings after $28,800 annual service costs. Including deferred vehicle purchases, first-year benefit is $558,000.
Key Insight: In this scenario, fuel savings alone ($201,600) exceed first-year cost. The insurance discount takes six months to activate; under the default assumptions, simple upfront payback is about 20 days after accounting for annual connectivity and platform costs.
21.16 Putting Numbers to It
Let’s break down the route optimization fuel savings physics:
Given: Fleet drives 3 million miles/year at 8 MPG average, and diesel costs $3.50 per gallon.
Baseline fuel consumption is 3,000,000 miles divided by 8 MPG, or 375,000 gallons per year. At $3.50 per gallon, that baseline fuel cost is $1,312,500 per year.
Route optimization reduces miles driven by 5% and improves MPG by 7% through smoother driving. The new distance is 3,000,000 x 0.95 = 2,850,000 miles, the new efficiency is 8 x 1.07 = 8.56 MPG, and the new consumption is about 332,944 gallons. At $3.50 per gallon, that becomes $1,165,304 per year.
Total fuel savings: $1,312,500 - $1,165,304 = $147,196 per year, which is lower than the worked example’s $201,600 because that example also includes idle reduction and driver coaching.
21.17 Separate Evidence from Market and Safety Claims
The connected vehicle revolution is driven by massive economic and safety imperatives:
Market Size:
- A January 2025 Grand View Research forecast put the global automotive V2X market at $155.17 billion by 2030. source
- In that January 2025 forecast, projected annual growth is 42.2% CAGR from 2025 to 2030. source
- 200+ million connected cars expected
The Cost of Inaction:
- FHWA cites $121 billion in congestion-related delay and excess-fuel costs for 2011 across 85 US urban areas. source on:
- Unnecessary travel time (congestion)
- Excess fuel consumption
- Idling in traffic
- Inefficient routing
Safety Impact:
- NHTSA’s 2005–2007 crash survey assigned a driver critical pre-crash reason in 94% of sampled crashes; the finding does not establish that driver error caused those crashes.
- V2V potential: US DOT said the technology could address up to about 80% of crashes involving two or more vehicles; that is a target population, not an 80% reduction. source
- NHTSA estimated $340 billion in total US motor-vehicle crash economic costs in 2019; this is not an estimate of V2X savings. source
Claims of 2+ million crashes prevented, 10,000+ lives saved, and $60+ billion avoided annually in the U.S. need a supporting evaluation. These figures cannot serve as established V2X outcomes without deployment and effectiveness evidence. Likewise, 200+ sensors, up to 4 TB/day of raw vehicle sensor data, and a 99.999% uptime target describe a demanding design example; they do not establish one universal requirement for connected vehicles. Raw sensor production is distinct from uploaded fleet traffic.
Use the decision tree to return from those aggregate claims to the bus’s two actual messages.
Figure 8 closes the chapter by turning the DSRC and C-V2X comparison into two questions a project can actually answer.
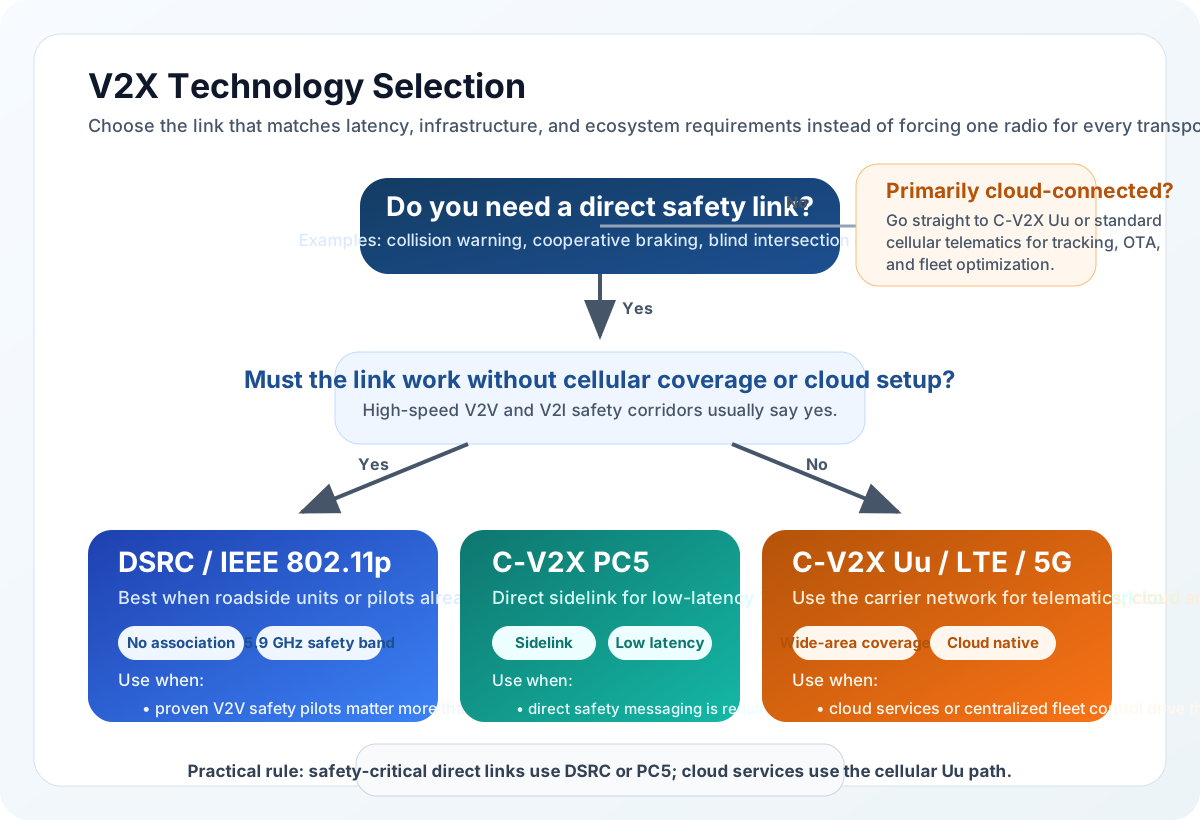
The first fork in Figure 8 asks whether the application needs a direct safety link, and it says what that means: collision warning, braking, blind intersections. Answer no and the tree leaves the safety branch entirely, sending telematics and fleet work to carrier cellular, where wide coverage and cloud access matter more than milliseconds. Answer yes and the second fork asks whether the link must work with no carrier at all. Both direct options can work without a carrier; that question separates a direct safety path from a network path, rather than choosing between DSRC and PC5. The line at the foot states the result plainly. Safety traffic rides a direct link, cloud traffic rides the carrier network, and most deployments need both rather than a single winner.
Figure 8 summarizes the technology selection process for V2X applications. For safety-critical V2V communication, both DSRC and C-V2X PC5 work without infrastructure dependency. For cloud-connected services, C-V2X Uu leverages existing cellular networks.
The next operational boundary is charging: Smart Grid and Energy connects EV infrastructure to grid integration. Smart Cities places traffic management in urban mobility systems. Smart Manufacturing follows automotive production and supply-chain optimisation.
Summary
The bus’s crash warning and fuel report begin with different actions, deadlines, and authority. V2V, V2I, V2P, and V2N connect different participants. Direct DSRC or C-V2X PC5 paths can support nearby safety exchange; Uu carries network services. Regional spectrum and installed equipment constrain the choice. A fast radio still needs fresh, trusted evidence, local sensor checks, and a bounded response.
Fleet telematics combines vehicle diagnostics, location, connectivity, and operational workflows. GPS uncertainty and OBD-II compatibility affect the evidence before it reaches a dashboard. Savings depend on a measured baseline and on people acting: distinguish a modeled benefit from a reported fleet result, a delayed discount from an immediate saving, and a deferred purchase from recurring income. In TELUS’s case, fuel economy improved by more than 10%; delivery reliability still depends on fleet operations. source
Choose the transport path from the action it must support, then prove freshness, authority, and fallback across the whole trip. Message delivery alone does not prove safe driving or fleet savings.
Next, Smart Grid and Energy follows EV charging from the vehicle into grid operations.
