23 IoT Case Studies: Smart Parking Design
More
Depth: Practitioner
Progress saves as you read. Mark sections complete as you go; your progress appears in the sidebar.
- Podcast audio coming soon
- Character narration audio coming soon
23.1 Start With Barcelona’s Parking Decision
A smart-parking system must do more than detect a car. It must give drivers useful availability information, connect that information to city operations, and remain affordable as sensors and software age. Barcelona’s deployment of 3,800 parking sensors across downtown neighborhoods provides a running case for examining those decisions. This chapter follows the platform behind that service, separates reported outcomes from planning assumptions, and works through the five-year budget.
Barcelona faced economic challenges following the 2008 recession, with high unemployment and declining tourism. The city needed to modernize infrastructure, improve citizen services, attract technology investment, and reduce operational costs. Its urban environment served about 1.6 million residents and roughly 7.9 million hotel tourists in 2014. 2014 tourism statistics
The problem extended beyond parking bays. Legacy infrastructure had to accommodate devices from multiple vendors and integrate 20+ municipal services. Budgets required demonstrable returns, citizens needed privacy, and the city needed an open, scalable platform that avoided vendor lock-in. A successful parking pilot therefore had to fit a much larger service architecture.
Building on IoT Case Studies: Transferable Evidence, we will trace the architecture, examine the results, and calculate lifecycle cost before deciding what transfers. The aim is to evaluate the sensor design contract through range, error, power, and interface evidence, then validate the Barcelona lessons against a concrete scenario and pass criteria. For the wider set of application choices, the applications module index provides context.
KEY CONCEPTS
- Occupancy evidence
A detected vehicle must become useful availability information.
- Open interfaces
Sentilo connects varied devices to shared city services.
- Lifecycle cost
Installation, maintenance, and integration belong in the budget.
- Transferable lessons
Local results need constraints and measures before reuse.
23.2 Learning Objectives
- Evaluate design contract: smart parking sensors with range, error, power, and interface evidence.
- Validate barcelona lessons learned with a concrete scenario and pass criteria.
23.3 Connect Devices Through a Shared Platform
Barcelona’s answer was Sentilo, meaning “sensor” in Esperanto: an open-source platform for managing heterogeneous IoT devices. A shared middle layer lets city services consume sensor data without building a separate integration for every device vendor. Figure 1 follows that separation through four layers.
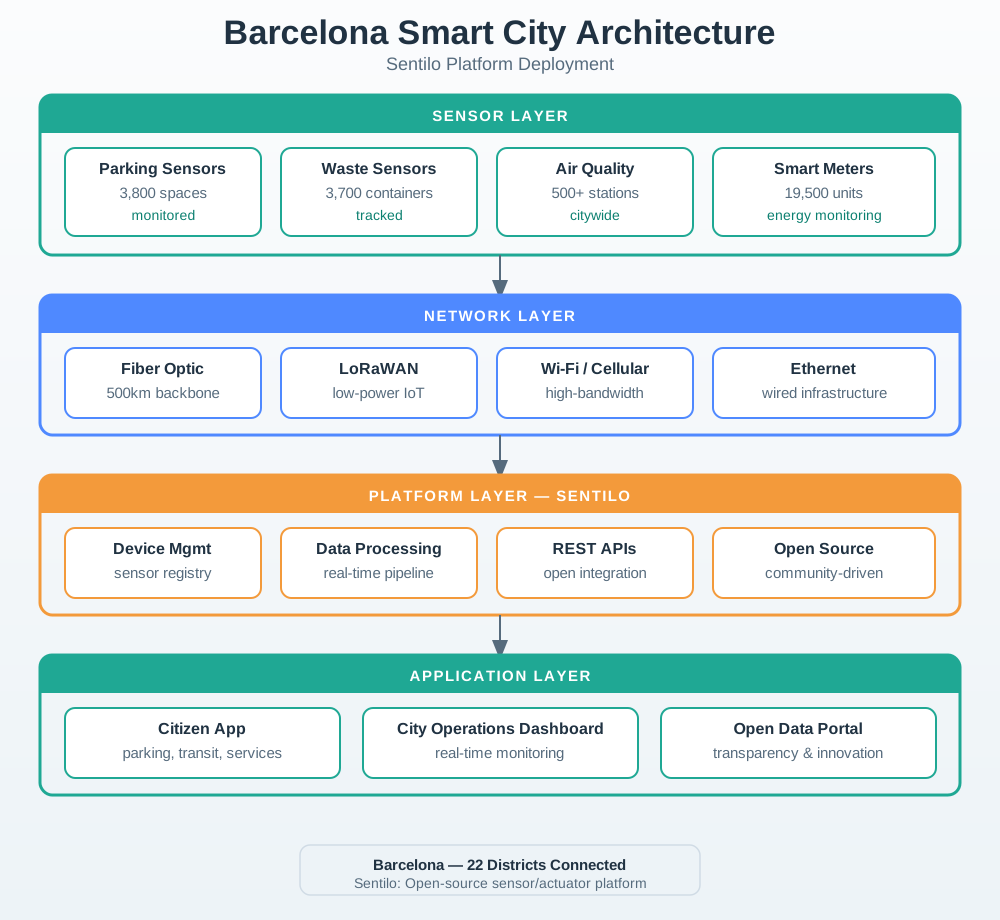
Read the numbered layers from the top. Parking bays and water meters supply different feeds, with different vendors and message formats. The network carries sparse readings over low-power radio and bulk traffic over city-owned fiber. Sentilo normalizes messages and exposes open interfaces; city operations, citizen apps, and the open data portal then draw on those feeds. That middle layer keeps applications independent of individual devices.
23.4 Barcelona Technologies Used
The technology choices below show how the case combines sensing, transport, storage, and analytics. LPWAN means low-power wide-area network; LoRaWAN supplies that role here. REST APIs expose application interfaces. The interfaces support interoperability, but the city still has to integrate the workflows around them.
| Component | Technology | Justification |
|---|---|---|
| Middleware Platform | Sentilo (Open Source) | Vendor-neutral, scalable, extensible, community-driven |
| Backbone Network | 500km Fiber Optic | High bandwidth, low latency, reliable, city-owned |
| LPWAN | LoRaWAN | Low power, wide coverage, ideal for sensors |
| Parking Sensors | Magnetic/Ultrasonic | Reliable vehicle detection, battery-operated |
| Waste Management | Ultrasonic Fill Sensors | Non-contact, accurate, low maintenance |
| Lighting | Networked LED with Dim Control | Energy efficient, remote control, lifespan 15+ years |
| Air Quality | NO2, PM2.5, CO2 sensors | Multi-parameter, research-grade accuracy |
| Communication | MQTT, REST APIs | Standard protocols, interoperable |
| Data Storage | PostgreSQL + TimescaleDB | Time-series optimization, SQL compatibility |
| Analytics | Apache Spark, Hadoop | Big data processing, machine learning |
23.5 Design Contract: Smart Parking Sensors
The platform decision does not replace sensor validation. Smart Parking Sensor Contracts follows magnetometer occupancy sensing, LoRaWAN reporting, adjacent-bay crosstalk, per-sensor baseline calibration, event-driven state updates, recovery heartbeats, and the metadata operators need before scaling. That evidence chain is where a general architecture becomes a reviewable parking design.
23.6 Build Infrastructure Before Expanding Services
The rollout moved from a shared network to core services and then wider applications. This order matters: installing more sensors cannot compensate for unreliable connectivity or an integration platform that does not yet work.
Phase 1, infrastructure (2011–2013), deployed 500 km of fiber connecting city facilities, established the Sentilo platform architecture, and piloted services in the 22@ innovation district. The initial deployment included 1,000 sensors.
Phase 2, core services (2014–2016), added real-time availability for 3,800 parking spaces, fill-level monitoring for 3,700 waste containers, 1,100 adaptive LED streetlights, and 500+ air-quality sensors.
Phase 3, expansion (2017–2019), included smart irrigation with 19,500 connected water meters, real-time information at 500 bus stops, and tourist-information-system integration. The city continued using and expanding the Open Data BCN portal, launched in 2011.
Several architectural choices supported this expansion. Sentilo’s modular design allowed services to consume data without device-specific integration. Local gateways supplied edge processing for real-time decisions such as traffic-light adjustments. RESTful APIs with OAuth2 authentication supported third-party developers, while public APIs let startups build citizen services. These choices connect the infrastructure investment to the ecosystem that uses it.
23.7 Separate Reported Results From Expected Benefits
Once the services operate, the next problem is deciding what their results establish. Cost savings, additional revenue, environmental effects, and operational improvements answer different questions. Keeping them separate makes the case useful for a new city’s design review.
Reported financial outcomes:
- Water Management: Barcelona was reported to save $58 million annually using smart water technology; the cited amount is not specifically a smart-irrigation result. Cisco city case profile
- Energy: Barcelona’s smart lighting system has been reported to save the city $37 million each year; the associated 30% reduction is not documented in that account. Cisco digital-cities paper
- Waste Collection: Fill-level sensing can inform collection routes and reduce unnecessary trips.
- Parking Revenue: Barcelona’s deputy mayor reported a $50 million annual increase in parking-fee revenue using smart parking technology. Cisco city case profile
- Documented annual figures: $58M reported smart-water savings; $37M reported smart-lighting savings; $50M additional parking-fee revenue. Do not total these as “savings”; the waste figure is unverified.
23.8 Putting Numbers to It
The cited accounts report separate annual figures for smart-water savings, smart-lighting savings, and increased parking-fee revenue. They should not be summed as one savings total. The $87M waste figure, $232M combined total, and 0.15–0.3 synergy multiplier lack the evidence needed for a Barcelona worked calculation.
Operational Improvements:
- Parking Search Time: Real-time space availability can help drivers plan a shorter search for parking.
- Waste Collection Efficiency: Optimized routes can avoid unnecessary collections when fill-level data are reliable.
- Air Quality: Traffic management can be assessed through measured NO2 concentration changes in designated pilot zones.
- Streetlight Maintenance: Remote fault detection can reduce the effort needed to locate failed luminaires.
Economic Impact:
- 47,000 new jobs created in smart city sector
- 1,200+ startups engaged with open data platform
Environmental Impact:
- 8,000 tons/year CO2 savings from smart lighting
- 12,000 tons/year CO2 savings from waste optimization
- Water consumption: At launch, Barcelona projected about 25% less irrigation water use for its telemanaged parks and gardens; this was a projected reduction, not a city-wide measured result. City press release
These measures need their own scope and evidence. A projected irrigation reduction is different from measured city-wide water savings, just as additional parking-fee revenue is different from a driver’s time saving. That distinction also matters when assigning benefits to the 3,800-sensor budget below.
23.9 Budget for the Full Five-Year Service
A total cost of ownership (TCO) includes acquisition and the costs of keeping a service running over a stated period. Use the Barcelona scenario’s 3,800 sensors to work through a five-year planning model. The arithmetic is reviewable; the prices, failure rates, and benefit assumptions below are example inputs rather than an audited Barcelona expenditure record.
Initial Investment (Year 0):
- 3,800 sensors @ $250 each = $950,000
- Installation labor (per sensor: 2 hours @ $50/hr) = $380,000
- LoRaWAN gateways (1 per 200 sensors = 19 gateways @ $2,000) = $38,000
- Software platform integration = $150,000
- Total Year 0: $1,518,000
Annual Operating Costs (Years 1-5):
- Sensor battery replacement (20% per year, $15 labor + $5 battery) = $15,200/year
- Gateway connectivity (19 gateways @ $30/month cellular) = $6,840/year
- Cloud hosting (AWS for 3,800 sensors @ $0.50/sensor/month) = $22,800/year
- Software licensing and support = $25,000/year
- Staff (1 full-time equivalent (FTE) IoT technician @ $65K loaded cost) = $65,000/year
- Total annual operating: $134,840/year
Hidden Costs Often Forgotten:
- Sensor replacement (5% fail per year, $250 + $100 labor) = $66,500/year
- Network troubleshooting (10 days/year @ $500/day) = $5,000/year
- Software updates and bug fixes (quarterly) = $12,000/year
- Data integration maintenance (parking app, city systems) = $18,000/year
- Total hidden costs: $101,500/year
5-Year TCO Calculation:
| Year | Investment | Operating | Hidden | Annual Total | Cumulative |
|---|---|---|---|---|---|
| 0 | $1,518,000 | $0 | $0 | $1,518,000 | $1,518,000 |
| 1 | $0 | $134,840 | $101,500 | $236,340 | $1,754,340 |
| 2 | $0 | $134,840 | $101,500 | $236,340 | $1,990,680 |
| 3 | $0 | $134,840 | $101,500 | $236,340 | $2,227,020 |
| 4 | $0 | $134,840 | $101,500 | $236,340 | $2,463,360 |
| 5 | $0 | $134,840 | $101,500 | $236,340 | $2,699,700 |
5-Year TCO: $2,699,700 (56% of this is initial investment, 44% is ongoing costs)
Per-Sensor TCO: $2,699,700 / 3,800 = $710 per sensor over 5 years ($250 hardware + $460 in installation, shared infrastructure, integration, and recurring costs)
A return on investment (ROI) compares net benefit with cost.
Revenue and ROI Analysis:
For a benefit sensitivity example, combine the reported parking revenue with an assumed congestion benefit. These are not verified benefits attributable to this sensor budget:
- Increased parking revenue (better enforcement, higher turnover): +$50M/year
- Reduced traffic congestion (fuel savings, time): ~$30M/year equivalent
- Assumed total annual benefit: $80M/year
- Assumed 5-year benefit: $400M
ROI Calculation:
- 5-year net benefit: $400M benefit - $2.7M cost = $397.3M
- Return on investment: ($397.3M / $2.7M) × 100 = 14,715% over 5 years
- Payback period: $2.7M / $80M per year = about 12 days using the full five-year cost as the numerator; this is a cost-to-benefit ratio expressed in days, rather than a cash-flow payback calculation
The 14,715% result follows from the assumed $400M benefit. It does not establish that this sensor purchase caused a city-wide revenue change or the assumed ~$30M/year congestion benefit.
Key Insights from TCO Analysis:
- Operating costs are nearly half the total: 44% of 5-year TCO is operational, not just initial hardware — budgets that skip it fall short fast
- Hidden costs are 75% of visible operating costs: Many budgets miss sensor replacement, troubleshooting, and integration maintenance
- Staff is the largest listed annual operating item: $325K over 5 years ($65K/year × 5), below the $950K sensor purchase
- TCO per sensor ($710) is 2.8× the sensor cost ($250): For this example, a planning approximation is total 5-year cost of 3× initial sensor hardware
Common Budgeting Mistake: A naive budget might estimate $950K (sensors) + $38K (gateways) + $150K (software) = $1.14M total. The modeled 5-year TCO is $2.7M — 2.4× the naive estimate. Omitting those costs risks a funding shortfall in Year 2–3 as operations accumulate.
The split is 56.2% initial investment and 43.8% recurring operating and hidden costs, rounded above to 56% and 44%.
The calculation audit walks through the same budget and corrects the investment/operating split.
23.10 Turn the Deployment Into Design Decisions
The useful lessons connect a local choice to a decision another team can review. Barcelona’s case suggests seven such decisions, each with a different owner and evidence requirement.
Choose open standards early. Proprietary platforms can create vendor lock-in and limit innovation. The case describes open-source Sentilo adoption and contributions by 20+ cities worldwide, with MQTT and REST enabling diverse vendor participation. Open APIs and vendor-neutral middleware support long-term flexibility. They do not remove development, customization, maintenance, procurement, or integration costs, and source openness alone does not determine code quality.
Fund infrastructure before scaling services. The 500 km city-owned fiber backbone provided a foundation for services and independence from telecom contracts. Reliable connectivity must precede expansion; otherwise deployed sensors cannot deliver useful data consistently.
Use visible early results to build support. Parking and lighting are described as delivering visible results within 6 months, with early savings of $20M in the first year funding expansion. Citizen-facing apps built engagement and political support. Treat those case claims as items to validate before adopting a quick-ROI promise for a different city.
Design privacy and security from the start. The case describes privacy-oriented architecture before GDPR requirements, anonymization pipelines intended to prevent personal data collection, and ongoing security audits and penetration testing. Early privacy design alone does not establish that an architecture is GDPR-compliant. NIST’s report supports embedding privacy requirements in IoT architecture rather than adding them afterwards.
Invite citizens and developers into the service. The case links the open data portal to 1,200+ startups building services. Citizen feedback shaped priorities, while hackathons and challenges extended innovation beyond city resources. Open APIs and data portals enable external participation; the startup count does not prove every startup used Sentilo.
Budget for organizational integration. More than 20 municipal departments brought different IT systems. Legacy systems needed custom adapters and middleware, and cross-department integration required training and organizational change. A network installation budget alone cannot cover that work.
Plan maintenance and periodic reviews. For planning, assume a 10–15% annual budget for maintenance and upgrades, then revise it against actual asset lifetimes and contracts. Sensor lifespans varying from 3–7 years require replacement planning. Technology evolution also requires architecture reviews and funding for refreshes.
23.11 Test Which Lessons Transfer
Use the same evidence frame across cases. First name the operational pain point, user group, and decision the system improves. Then trace sensors, connectivity, edge or cloud processing, application workflow, and data ownership. Check measured cost, uptime, maintenance, adoption, or service quality separately from claimed outcomes. Finally, identify which choices depend on local context and which principles apply elsewhere.
Barcelona illustrates cloud-centric service integration through open APIs and city-wide fiber. Parking, waste, lighting, irrigation, and air quality share a dense urban environment with municipal departments, citizens, startups, and regulators. Success depends on ecosystem coordination as well as sensor deployment.
Volkswagen provides a different comparison: high-value robots, edge analytics, and factory resilience. Its edge-first processing keeps maintenance-alert latency below 10 ms, with technicians, manufacturing execution system (MES) workflows, and plant leadership as central stakeholders. Trust, false-positive control, and clear payback determine whether the workflow helps production.
23.12 Incremental Examples
A beginner can extract demand sensing, public communication, and maintenance planning from smart parking before adding advanced analytics. An intermediate review of predictive maintenance links sensor evidence, downtime cost, alert thresholds, and technician workflow. An advanced cross-case review separates shared architecture patterns from domain-specific constraints.
Local budgets, regulations, user behavior, and existing infrastructure can determine whether a result transfers. Application Domains Overview compares those constraints, while IoT Business Model Case Studies connects deployment evidence to business-model evidence. A useful transfer note records the decision logic and its limits clearly enough for another team to judge.
23.13 Summary
Barcelona’s parking service sits within a wider architecture of shared infrastructure, open Sentilo interfaces, and coordinated municipal services. Reported water and lighting savings, parking-fee revenue, and projected environmental effects need separate measures and scopes. The Cisco city case profile supports the $58M annual smart-water savings and $50M annual parking-fee revenue figures. The five-year parking model totals $2,699,700, with 56.2% initial investment and 43.8% recurring costs; its benefit calculation depends on assumptions that need validation.
Transfer the design reasoning: connect sensor evidence to an operational decision, fund the full service lifecycle, and check whether the local conditions support the claimed result.
Next, Volkswagen Predictive Maintenance and Cross-Case Lessons applies the evidence frame to an industrial workflow.
