7 Wearable IoT: Validation and Design Trade-offs
7.1 Start With the Story
A wearable fits the chosen body location and users are willing to wear it. That still does not prove its readings, battery promise, or sleep and health claims. The team now needs tests that expose motion, drift, sampling, and validation limits before release.
7.2 Overview
This route turns common wearable failures into battery, accuracy, artifact, sleep-validation, and sensor-selection decisions.
This is part 2 of 2. Review Wearable IoT: Placement and Adoption when you need the first route.
7.3 Learning Objectives
By the end of this chapter, you will be able to:
- diagnose wearable accuracy and battery-life overclaims
- evaluate motion artifact, drift, and sleep-validation evidence
- choose wearable sensors within wellness and clinical boundaries
7.4 Chapter Roadmap
Follow the original sections below in order. They begin at the reviewed split boundary and keep every worked example, figure, check, and supporting banner with the section that owns it.
7.5 Common Wearable Pitfalls
Now the chapter turns to failure modes: overclaimed accuracy, fast battery drain, and drifting signals.
7.6 Common Pitfall: Data Accuracy Assumption
The mistake: Treating consumer wearable data as clinical-grade measurements and making health decisions based on readings with significant error margins.
Symptoms:
- Users panicking over heart rate “anomalies” that are sensor artifacts
- Sleep stage percentages treated as precise when they have 20-30% error
- Step counts varying by 15-25% between devices worn simultaneously
The fix: Understand each sensor’s accuracy specifications. Use trends over time rather than individual readings. Consult healthcare providers before acting on concerning readings.
7.7 Practice: Wearable Accuracy Claim Triage
A team wants to launch a wrist wearable that reports resting heart-rate trend, sleep quality trend, fall-risk alerts, and “detects dehydration before symptoms.” Before approving the feature list, classify each claim by the evidence it needs.
- Resting heart-rate trend: frame as a wellness trend over 7+ days. Compare against a reference monitor across resting, walking, cold-weather, and loose-strap cases.
- Sleep quality trend: frame as relative sleep consistency, not exact sleep stage diagnosis. Validate trend direction against diary or lab subset data, then show uncertainty in the UI.
- Fall-risk alert: frame as a safety assist that asks for confirmation. Test sensitivity, false positives, missed falls, battery drain, and emergency-contact fallback.
- Dehydration detection: do not claim detection without clinical validation. Require a validated biomarker, protocol review, and clinical evidence before user-facing advice.
Review rule: if the action could change medication, diagnosis, emergency response, or clinical care, treat it as a regulated health claim until proven otherwise. If the action only helps a user notice a pattern, label it as a wellness trend and communicate uncertainty.
7.8 Battery Life Overestimate
The mistake: Selecting wearables based on advertised battery life without understanding that GPS, always-on displays, and continuous heart rate dramatically reduce runtime.
Symptoms:
- Device dying mid-workout with GPS enabled
- Marketed “7-day battery” lasting only 2 days
- Users disabling health features to extend battery
The fix: Calculate expected usage with this power budget worksheet:
Worked Example — Smartwatch Battery Budget (300 mAh battery):
- MCU (active): 5 mA x 6 hours = 30 mAh/day.
- MCU (sleep): 0.02 mA x 18 hours = 0.36 mAh/day.
- Display (active): 15 mA x 3 hours = 45 mAh/day.
- Display (always-on): 3 mA x 21 hours = 63 mAh/day.
- PPG heart rate (continuous): 1.5 mA x 24 hours = 36 mAh/day.
- BLE (periodic sync): 8 mA x 0.5 hours = 4 mAh/day.
- GPS tracking: 25 mA x 0 hours = 0 mAh/day.
- Total with no GPS and no always-on display: 115 mAh/day = 2.6 days.
- Total with always-on display: 178 mAh/day = 1.7 days.
- Total with always-on display and 1 hour of GPS: 203 mAh/day = 1.5 days.
This explains why the same watch can last “7 days” (basic mode with infrequent HR sampling) or “1.5 days” (all features enabled). Always-on display is the single largest battery drain — 63 mAh/day versus 45 mAh/day for active-only display.
7.9 Wearable Battery Estimator
7.10 Understanding the Results
This calculator models the battery drain equation from the worked example above. Key insights:
- Always-on display is the single largest drain: adds ~60 mAh/day (20% of a 300mAh battery)
- GPS tracking uses 25 mA — a 1-hour run consumes 25 mAh (8% of battery)
- Continuous heart rate adds 36 mAh/day (12% of battery)
The “7-day battery life” claim assumes minimal feature usage (no GPS, periodic HR checks, active-only display). Enabling all features reduces battery life to 1.5-2 days.
Design Principle: Target at least 3 days of battery life with typical usage patterns to avoid the “battery life overestimate” pitfall.
 Checkpoint: Battery Evidence
You now know:
- A 300 mAh watch budget in this chapter lands at 115 mAh/day and 2.6 days without GPS or always-on display.
- Always-on display raises the example to 178 mAh/day and 1.7 days; adding 1 hour of GPS reaches 203 mAh/day and 1.5 days.
- The useful design target is not the advertised 7-day claim, but at least 3 days under typical feature combinations.
7.11 PPG Motion Artifact Pitfall
Battery is only one constraint. The next pitfalls ask when to withhold or qualify a metric.
The mistake: Trusting optical heart rate during exercise without understanding that motion creates signal artifacts often larger than the pulse signal.
Look at Figure 7.1 for where an optical reading really comes from, and how easily that contact can move.

Two parts do the work in Figure 7.1. The optical sensor is the small band on the finger, held against the skin by a soft cuff, and a thin cable carries its signal back to the unit on the wrist. The display shows finished numbers, 99 percent oxygen and 55 beats per minute, with no hint of how good the contact behind them was. That gap is the pitfall. The light reaching the detector depends on how firmly the cuff presses, and a swinging arm changes that pressure many times a second. At rest the reading looks clean; in motion, the pressure change can be larger than the pulse itself.
Symptoms:
- Heart rate showing 180 BPM during casual walk (actual ~100)
- Erratic spikes during arm movement
- Calorie burn calculations wildly inaccurate
Why it happens: Arm movement causes sensor shift against skin. Running cadence (150-180 steps/min) matches typical exercise heart rates.
The fix: Wear tighter during exercise. Use chest straps for accurate exercise data. Trust average heart rate rather than instantaneous readings.
7.12 Skin Contact Sensor Drift
The mistake: Expecting consistent biometric readings without accounting for how skin conditions, device positioning, and environmental factors cause sensor drift.
Symptoms:
- Heart rate accurate in morning but erratic by evening
- SpO2 varying 3-5% between readings taken minutes apart
- Electrodermal sensors becoming unresponsive after extended wear
Why it happens: Skin hydration changes, sweat accumulation, device loosening, sunscreen/lotions create optical barriers.
The fix: Clean sensors daily. Verify proper fit before measurements. Use multi-day averages rather than single readings.
7.13 Worked Example: Sleep Tracking Accuracy
7.14 Sleep Accuracy Check
Scenario: A health technology company is launching a sleep tracking feature for their fitness band. They must determine appropriate accuracy claims based on validation against polysomnography (PSG), the clinical gold standard.
Given:
- Sensors: 3-axis accelerometer (100 Hz), optical PPG heart rate (25 Hz)
- Sleep stages: Awake, Light Sleep, Deep Sleep, REM Sleep
- Validation: 120 subjects, 1 night each, clinical sleep lab
Validation Results:
- Overall epoch-by-epoch accuracy: 74% (Cohen’s kappa = 0.58, “moderate agreement”)
- Awake detection: 89% sensitivity, 94% specificity
- Deep sleep: 69% sensitivity, 88% specificity
- REM sleep: 72% sensitivity, 85% specificity
User-Facing Metrics Accuracy:
- Total sleep time: Mean error +12 minutes (overestimates)
- Deep sleep percentage: Mean error 8.1%
- Sleep score correlation: r=0.71 with PSG-derived score
Key Insight: The 74% epoch-by-epoch result does not support clinical claims. A rolling summary may still be useful for wellness, but its performance must be validated directly; the single-night classification accuracy cannot be converted into trend accuracy by averaging.
7.15 Interpreting the Validation Results
The reported measures answer different questions:
- 74% epoch accuracy is the proportion of labelled epochs that matched PSG. Its complement, 26%, is a misclassification rate, not a standard deviation.
- +12 minutes mean error shows bias in total sleep time. Repeating a biased estimate does not remove that bias.
- 8.1% mean error for deep-sleep percentage needs a spread, distribution, and subject-level analysis before a confidence interval can be calculated.
- r = 0.71 measures association between sleep scores; it does not establish agreement or clinical interchangeability.
The familiar formula applies to the standard error of a sample mean under a defined sampling model. It does not allow a classification error rate to be divided by and relabelled as accuracy. Sleep-stage errors may also be correlated across nights and systematic for particular people or stages.
To support a claim about seven-day trends, validate that output directly:
- collect repeated PSG nights across participants and relevant sleep conditions
- predefine the trend outcome, such as change in total sleep time or weekly stage proportion
- report bias and limits of agreement for that outcome, with uncertainty across participants
- examine correlated and subgroup errors rather than assuming independent nights
- test whether the trend crosses a decision threshold reliably enough for the intended wellness use
Communication Strategy:
- Avoid: “Tracks sleep stages with clinical accuracy”
- Use: “Estimates sleep patterns to help you understand your sleep habits”
- Show: Only trends that have been validated against repeated reference measurements
- Disclaim: “Not intended for diagnosis or treatment of sleep disorders”
7.16 Trend-Claim Validation Checklist
Before releasing a weekly sleep trend, require a repeated-night validation set and answer four questions:
- What exact weekly quantity is being estimated?
- What are its bias and limits of agreement against repeated PSG measurements?
- Do errors persist for the same participant, sleep stage, or condition?
- Does the uncertainty preserve the intended wellness decision?
If those results are unavailable, the defensible message is that the product estimates nightly sleep patterns. Do not attach a manufactured weekly accuracy percentage.
Checkpoint: Sleep Accuracy Claims
You now know:
- The sleep validation example uses 120 subjects, 1 night each, and reports 74% epoch-by-epoch accuracy with 0.58 kappa.
- The 26% complement of classification accuracy is not a standard deviation and cannot be divided by to produce a weekly accuracy.
- Weekly trend performance requires repeated-night reference data, bias and agreement analysis, and checks for correlated errors.
7.17 Wearable Sensor Technologies
With the evidence checks in place, the remaining sections move into final review.
- PPG (Optical HR): Measures heart rate via blood volume. Consumer accuracy: +/- 5-10 BPM. Clinical accuracy: +/- 2 BPM.
- Accelerometer: Measures movement, steps, and activity. Consumer accuracy: +/- 10-15% steps. Clinical accuracy: +/- 5%.
- SpO2: Measures blood oxygen saturation. Consumer accuracy: +/- 2-4%. Clinical accuracy: +/- 2%.
- Skin Temperature: Measures body temperature proxy. Consumer accuracy: +/- 0.5C. Clinical accuracy: +/- 0.1C.
- ECG (electrical): Measures heart rhythm. Consumer accuracy: FDA-cleared for AFib. Clinical accuracy: Gold standard.
- Bioimpedance: Measures body composition and hydration. Consumer accuracy: +/- 5% body fat. Clinical accuracy: +/- 3%.
Inspect Figure 7.2 to compare consumer error ranges with the tighter evidence expected for clinical use.
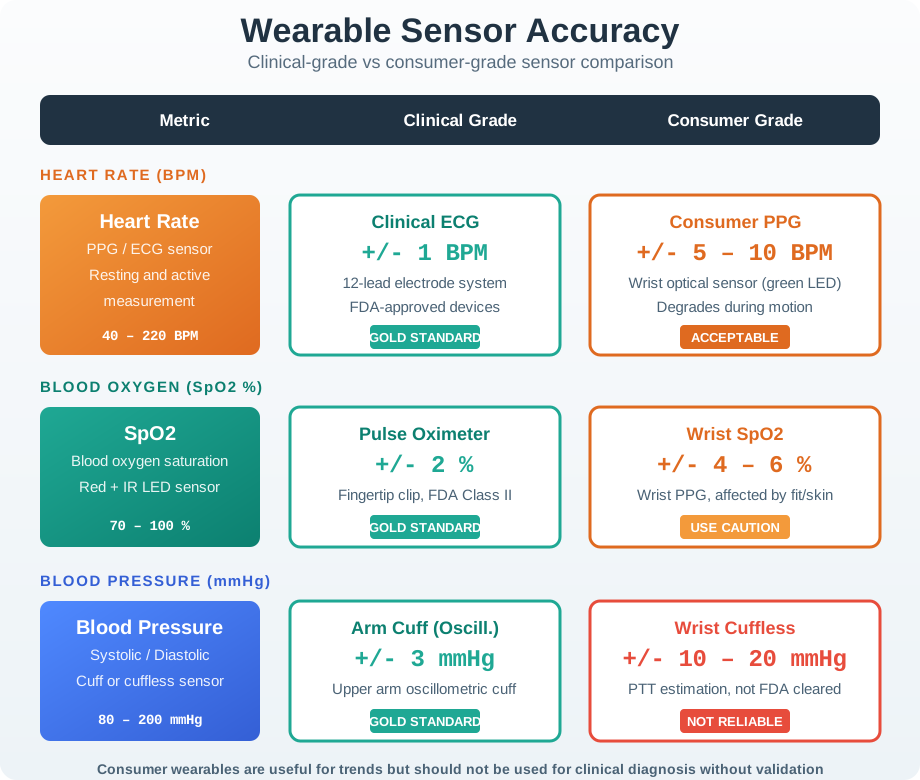
Read Figure 7.2 row by row rather than treating “wearable” as one accuracy class. Consumer optical heart-rate error may be ±5–10 BPM while the clinical target is ±2 BPM; skin temperature narrows from about ±0.5 °C to ±0.1 °C. Step counts, oxygen saturation, ECG, and bioimpedance each use different measures and reference methods. The clinical column is not a software upgrade label. It reflects a claim, population, protocol, and validation burden. Select the sensor and evidence plan from the decision the measurement will support, especially before using a consumer trend for diagnosis.
7.18 AR Glasses: The Next Frontier
AR glasses represent the next evolution in wearable computing, combining:
- Waveguide displays for transparent overlay
- Spatial sensors for head tracking and SLAM
- Bone conduction audio for private listening
- Edge computing for real-time AR rendering
Figure 7.3 answers a question that a feature list hides: where does all of this hardware actually go?

Look along the brow bar in Figure 7.3. A camera opening sits in the centre with smaller sensor openings on either side, all in one narrow strip, because that is the only place on a head-worn device with a steady forward view. Below the strip the dark visor curves across both eyes, and the display optics have to live inside that thin shell without blocking sight. Everything else, from battery to compute to audio, must fit into the arms and the front housing and still be light enough to wear for an hour. The photo is a reminder that head-worn AR is a packaging problem first. Sensing, display, power and weight all compete for the same few centimetres.
Challenges:
- Power consumption (AR processing drains batteries quickly)
- Weight constraints (must be comfortable for all-day wear)
- Social acceptance (lessons from Google Glass)
- Display brightness (outdoor visibility)
7.19 Knowledge Check: Wearable IoT
7.20 Wearable Design Relationships
- 9 Design Principles: These are the prerequisites for sensor accuracy to matter. Related chapter: IoT Stakeholder Perspectives.
- Motion Artifacts: Primary cause of PPG inaccuracy. Cross-module connection: Sensor Signal Processing.
- Battery Power Budget: Constrains always-on features. Cross-module connection: Energy Harvesting.
- Repeated-Measure Validation: Required before claiming that a rolling sleep metric reduces error. Cross-module connection: Data Analytics Methods.
- AR Glasses: Next evolution requiring edge computing. Cross-module connection: Edge Computing.
The wearable IoT design space connects human factors (comfort, aesthetics), sensor engineering (accuracy, drift), power management (battery budgets), and data science (trend detection over point measurements).
7.21 Quiz: Wearable Concepts
7.22 Interactive Quiz: Sequence the Steps
Common Pitfalls
7.23 Avoid Average Body Metrics
Wearable sensors calibrated on average body sizes and skin tones perform poorly on outlier populations—PPG sensors show higher error rates on darker skin tones and very thick wrists. Include diverse body types in user testing panels and validate sensor accuracy across the target demographic range during product development.
7.24 Always-On Sensor Battery Drain
Enabling continuous heart rate, GPS, and SpO₂ monitoring simultaneously can drain a wearable battery in 4-8 hours. Users who experience this revert to periodic-only sensing, defeating the health monitoring purpose. Model power consumption per feature combination during design and set defaults to balanced modes.
7.25 Correlation vs Clinical Validity
A correlation between wristband PPG and stress in a small lab study does not constitute clinical validation. Shipping the feature without proper validation exposes users to misleading health claims and the company to regulatory risk. Follow CLIA or FDA guidance for health claims and clearly label features as ‘wellness’ (not clinical) unless properly validated.
7.26 Label the Diagram
7.27 Code Challenge
7.28 Summary
Wearable IoT success depends on understanding user needs beyond technology:
- 33% abandonment within 6 months demands attention to the nine Endeavour Partners design principles — comfort, aesthetics, battery life, and lifestyle compatibility are prerequisites before sensor quality matters
- Nine design principles (selectable, aesthetic, easy setup, comfortable, robust, intuitive, integratable, lifestyle-compatible, overall utility) form a comprehensive framework for evaluating wearable adoption potential
- Consumer vs. clinical accuracy gap: PPG heart rate (+/- 5-10 BPM consumer vs. +/- 2 BPM clinical), step counting (+/- 10-15%), and sleep staging (74% accuracy) mean consumer devices are wellness tools, not clinical instruments
- Motion artifacts are the primary source of inaccurate exercise heart rate readings — running cadence (150-180 steps/min) overlaps with exercise heart rate ranges, confusing PPG algorithms
- Sensor drift from skin hydration changes, sweat accumulation, and device loosening degrades accuracy over the course of a day
- Trend claims need their own validation: Rolling summaries may reduce random variation, but they do not automatically remove bias or classification errors
- Battery life estimation requires accounting for continuous HR monitoring (-12%/day), GPS usage (-10%/hour), and always-on display (-30% additional) — advertised battery life assumes minimal feature usage
- AR glasses represent the next frontier, combining waveguide displays, spatial sensors, and edge computing, but face weight, power, and social acceptance challenges
7.29 In 60 Seconds
Wearable IoT devices capture continuous biometric data—heart rate, activity, sleep—enabling personalised health insights while balancing battery life constraints, sensor accuracy across diverse body types, and user comfort expectations.
The key insight: A comfortable device with moderate accuracy that gets worn daily provides more value than a precise device that sits in a drawer.
7.30 See Also
Explore related wearable topics across modules:
- Biosensors and Health Monitoring - Sensor technologies for vital sign measurement
- BLE and Wearable Connectivity - Low-power wireless for body-area networks
- Battery Life Optimization - Extending wearable runtime
- Healthcare IoT Applications - Clinical-grade wearable deployments
- Data Privacy and Security - Protecting biometric data
7.31 What’s Next
- Smart Home: Home automation, comfort systems, and energy optimization.
- Healthcare IoT: Clinical-grade wearables and patient monitoring.
- Application Domains Overview: Review domain comparisons and practice checks.
7.32 Key Takeaway
Wearable IoT designs must respect the body, battery, and user context. Accurate sensing only becomes useful when comfort, privacy, clinical validity, and long-term adherence are part of the design.