10 Medication IoT: Integration, Evidence, and Safety
More
Depth: Practitioner
Progress saves as you read. Mark sections complete as you go; your progress appears in the sidebar.
- Podcast audio coming soon
- Character narration audio coming soon
10.1 Make Medication Evidence Usable
A dispenser and sensor can record an event, yet the clinic cannot act until the event reaches the right patient record with its limits intact. This chapter follows that existing medication scenario from device evidence into the care team’s workflow. It asks whether integration, privacy, sensor accuracy, reimbursement, and regulatory planning support the same safety claim.
This is part 2 of 2. Medication IoT: Devices and Verification introduces the device route. Here, the team must map medication evidence into the clinical record, evaluate privacy and accuracy costs, and test return-on-investment assumptions against a medication safety gate. A reminder, an acknowledged delivery, and an ingestion-linked observation each establish different things.
The problem is a gap between recording and acting: a technically strong device may still leave the clinician without usable evidence. Now consider the approaches in order: design the clinical hand-off first, cost its safeguards, validate the measurements, then test the economic and deployment assumptions.
KEY CONCEPTS
- Clinical integration
Map observations into the care team’s record.
- Privacy cost
Budget for safeguards and accountable access.
- Sensor limits
An average error is not a reading guarantee.
- Evidence for value
Separate modeled savings from validated outcomes.
10.2 Learning Objectives
By the end of this chapter, you will be able to:
- map medication evidence into an EHR care workflow
- evaluate privacy, accuracy, and compliance costs
- test return on investment (ROI) and regulatory assumptions with a medication safety gate
10.3 Design the Clinical Hand-off First
An Electronic Health Record (EHR) is the patient’s clinical record. Lack of integration is the central adoption barrier in this scenario: a device whose observations never reach that record remains invisible to the team. A simple device that fits the workflow can be more useful than a sophisticated gadget whose data clinicians never see. Consumer curiosity can fade within months when it produces no clinical hand-off.
Integration crosses several barriers together. Epic, Cerner, and Meditech have architectural histories of 20+ years; legacy interfaces coexist with newer services. U.S. Food and Drug Administration (FDA) clearance, HIPAA compliance, and clinical validation add regulatory work. HL7v2, FHIR, and proprietary APIs fragment the data exchange. Vendor integration charges affect the business case, while liability remains a practical question: who responds if an IoT observation contributes to a missed diagnosis?
FHIR (Fast Healthcare Interoperability Resources) is a healthcare data-exchange standard with RESTful, web-friendly APIs and defined Patient, Observation, and Device resources. The US 21st Century Cures Act framework drives FHIR-based access requirements for applicable certified health IT; it does not mean every device integrates automatically. The source’s Apple HealthKit example points to FHIR-enabled EHR connectivity, but a product-specific export path still needs review. FHIR and Health Data Standards develops the interoperability problem beyond this case.
Start by asking what evidence can enter the clinical record. Follow the architecture from patient devices through an edge gateway, then the cloud platform and FHIR or HL7 mapping, to physician dashboards, nurse alerts, and patient portals. The edge turns a raw event into a bounded observation. Mapping must preserve patient identity, time, units, and provenance. Alert management and audit controls precede the clinical destinations because each destination needs its own permissions and response rules. Encryption protects each hop; semantic mapping and workflow ownership determine whether the evidence is usable.
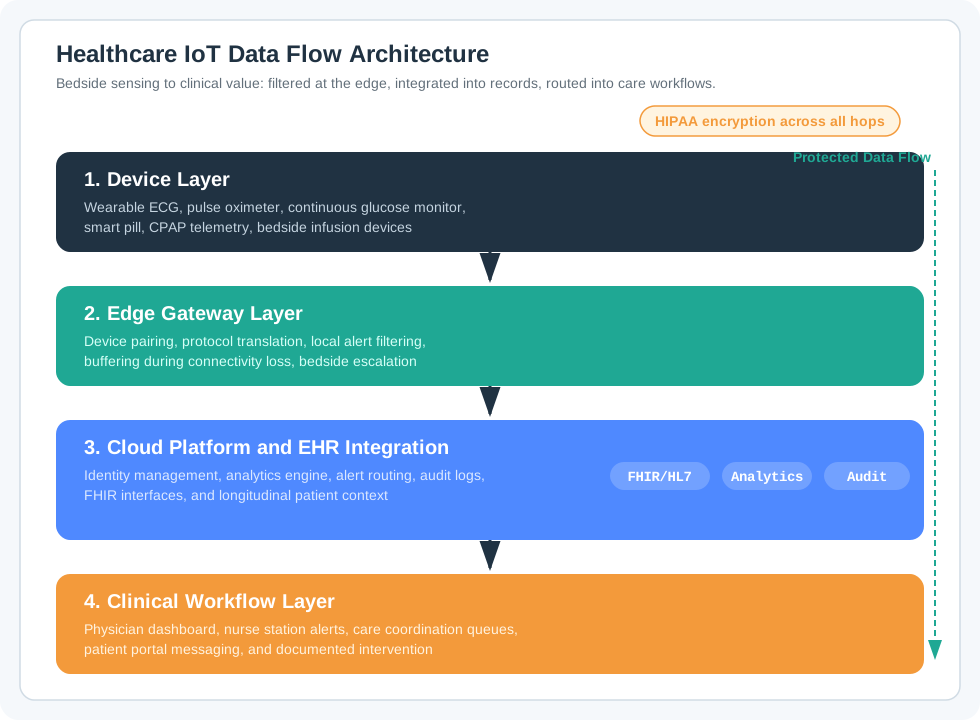
Read the worked vital-sign path from Capture to Route + act. A bedside or wearable device captures a heart-rate signal. Edge Triage checks a patient-specific baseline and produces a bounded observation or alert. Cloud + EHR maps the observation through FHIR or HL7 into clinical context. It combines heart-rate increase, temperature instability, and feeding intolerance for the NICU prediction example. Next, alerts or trends reach a nurse station, physician dashboard, or patient portal. The workflow owns the response. Finally, read Boundary Controls: protect transport and preserve patient identity, time, units, provenance, and audit evidence across every hop. These hand-offs also frame smart-lens readings and medication events.
10.4 Cost the Protected Monitoring Workflow
The regional health system extends the medication workflow into a Remote Patient Monitoring (RPM) program: measurements collected at home support care for heart failure patients. The example uses CMS reimbursement codes CPT 99453–99458 to test whether the program can cover its costs. The figures below are scenario inputs, not current payment guidance.
- Patient devices: Bluetooth-enabled weight scale, blood pressure cuff, pulse oximeter
- Data transmission: Cellular gateway in patient home to cloud platform
- EHR integration: Epic MyChart patient portal + provider dashboard via FHIR R4 API
- Scenario safeguards: protected health information (PHI), meaning identifiable health data, uses encryption at rest (AES-256) and in transit (TLS 1.3)
- CMS RPM billing requirements: Minimum 16 days of data transmission per 30-day period
- Patient population: Average age 68, 40% have limited smartphone proficiency
- Budget: $150/patient/month all-in (device, connectivity, software, support)
First map the protected data path and its four HIPAA touchpoints:
- Device to gateway: BLE with encrypted pairing (device ID only in this example; assess whether that identifier can be linked to a patient)
- Gateway to cloud: Cellular with TLS 1.3 (PHI: vital signs + patient ID)
- Cloud storage: AES-256 encryption, access logging, 6-year retention
- Cloud to EHR: FHIR API over TLS 1.3, OAuth 2.0 authorisation with separate authentication of the calling system
- Total PHI touchpoints: 4 (gateway, cloud ingestion, cloud storage, EHR API)
The example applies the following technical safeguards under the HIPAA Security Rule:
- Access controls: Role-based access (patient, caregiver, nurse, physician, admin)
- Audit controls: Log all PHI access with timestamp, user ID, action, and IP
- Integrity controls: SHA-256 hashing of all transmitted data
- Transmission security: Certificate pinning on gateway, HSTS on web interfaces
The gateway, cloud ingestion, cloud storage, and EHR API are the four touchpoints identified in this scenario. Check controls at each boundary: a protected connection does not determine who may read a stored observation or who must respond to it. SHA-256 hashing detects changes only when the expected hash is itself trusted; a bare hash does not authenticate a sender.
Cost that protection explicitly before comparing it with the budget:
- HIPAA risk assessment: $15,000 (one-time)
- Third-party security audit (SOC 2 Type II): $50,000/year
- Encryption key management (AWS KMS): $1/patient/month
- Audit log storage (7-year retention): $0.50/patient/month
- Security incident response retainer: $5,000/year
- Total HIPAA overhead: ~$4/patient/month (2.7% of budget)
The workflow then gives each protected observation a destination:
- FHIR Observation resources: Blood pressure, weight, SpO2 readings
- FHIR Device resource: Link observations to specific patient device
- Clinical workflow: Abnormal readings trigger Epic In-Basket message to care team
- Patient engagement: MyChart displays daily readings and trend graphs
For the scenario’s billing analysis, keep the payment and activity requirements together:
- CPT 99453: Initial setup and patient education ($19.19 reimbursement)
- CPT 99454: Device supply with daily recordings, 16+ days/month ($55.72/month)
- CPT 99457: 20+ minutes clinical staff time ($48.80/month)
- CPT 99458: Additional 20 minutes ($40.42/month)
- The source example states a maximum monthly reimbursement of $144.94; its four listed rates actually sum to $164.13. The worked margin below retains $144.94 as a separate scenario assumption, not that sum. Setup and recurring payments must also be modeled separately.
Result: The scenario reports documented Business Associate Agreements covering 3 vendors, a passed SOC 2 Type II audit, and bidirectional integration with Epic. The average patient achieves 22 transmission days/month, meeting the example’s 16-day criterion; staff-time and other billing requirements still need separate evidence. Net margin: $144.94 - $150 = -$5.06/patient/month before reduced hospitalization savings.
Key Insight: Healthcare IoT economics often depend more on regulatory compliance and reimbursement qualification than on technology costs. The $4/month HIPAA overhead and EHR integration complexity represent invisible costs that consumer IoT companies underestimate when entering healthcare markets.
At the calculator’s default 2,000 patients, the $50,000 audit contributes $2.08 per patient per month. Adding $1 for key management and $0.50 for audit storage gives $3.58 before the incident-response retainer and one-time assessment. That explains the roughly $4 planning allowance, rather than establishing a universal HIPAA price. The $150 all-in budget and the calculator’s $150 device-cost input describe different cost bases; do not add overhead twice. The source uses 6-year cloud retention and 7-year audit-log retention as distinct design assumptions. Neither a SOC 2 audit nor encryption alone establishes HIPAA compliance. For the broader protection framework, consult Data Privacy and HIPAA.
10.5 Validate Accuracy Before Dosing Rules
A diabetes management app integrates data from continuous glucose monitors (CGMs). Interpret the published aggregate accuracy metric before specifying any alert or dosing behaviour.
The sensor is Abbott FreeStyle Libre 3, with 14-day wear and factory calibration. Its study reports 7.8% aggregate Mean Absolute Relative Difference (MARD) against a venous plasma reference in participants aged at least 6 years. The app’s intended population is people with Type 1 diabetes taking 4–6 insulin injections daily, and its intended function is insulin-dosing decision support. That use needs device labeling, stratified accuracy data, time-series alert validation, and clinical review.
MARD averages the absolute relative differences across matched CGM and reference measurements. The arithmetic 7.8% of 150 mg/dL equals 11.7 mg/dL, but the aggregate metric does not establish that as the expected error at 150 mg/dL. It does not imply that every reading lies between 138 and 162 mg/dL, and it cannot establish a dosing-error bound.
Separate evidence is needed because performance can vary by glucose range, rate of change, wear period, insertion state, sensor placement, and interfering substances. A population-wide average can hide clinically important tails and subgroup differences. Review the approved labeling and stratified performance tables for the exact sensor version and intended population before choosing a rule.
Translate that labeling into system states. Preserve device status, alarm state, trend information, and data-quality flags with every reading. Prompt for a blood-glucose check when approved labeling requires it, including when symptoms or expectations do not match the sensor reading. Confirmation conditions differ by device and version; one threshold cannot serve every CGM.
Candidate alert thresholds are design parameters to validate, rather than outputs of MARD arithmetic. Evaluate sensitivity, specificity, time-to-alert, false-alarm burden, and missed-event severity on representative time-series data. Obtain clinical and regulatory review for the intended use, particularly if the app recommends or automates insulin delivery.
Decision support also needs clinician-configured dose limits and approved device restrictions. Track active insulin on board and the timing of previous corrections, and fail safely when readings, device status, or required context are missing or contradictory.
Result: The design produces a validation plan rather than an invented universal threshold. Release evidence must show how each alert and dosing rule performs across clinically relevant ranges and failure modes, and must trace confirmation prompts to the approved labeling for the selected device.
Key Insight: Healthcare IoT systems must design around sensor limitations without over-interpreting aggregate metrics. MARD is useful for comparing average performance under stated study conditions; it is not a worst-case error, a confidence interval, or a recipe for clinical thresholds.
This is where Sensor Accuracy and Calibration becomes a care-workflow requirement. Insulin stacking means giving correction doses before earlier insulin has fully acted. Tracking active insulin on board addresses that hazard; the published average alone cannot tell the app when another correction is safe.
10.6 Test the Readmission Business Case
A health system deploys smart pill bottles for heart failure patients to improve medication adherence and reduce hospital readmissions.
- Modeled 30-day readmission rate: 25%, close to the 24.5% CMS reported for Medicare heart-failure discharges in 2009; validate against the target cohort. (CMS)
- Cost per readmission: $13,000 (CMS penalty + treatment)
- Hypothetical model input: attribute 40% of readmissions to medication nonadherence, pending a defined readmission study.
- Smart bottle cost: $45 per device + $3/month connectivity
- Assumed intervention effect: adherence rises from 65% to 88%; this is not a demonstrated smart-bottle result.
- Program duration: 12 months
Begin with the baseline assumptions; none of these products is an observed count:
- Among 1,000 index discharges, the assumed 25% 30-day rate yields 250 readmissions within 30 days.
- Under the assumed 40% attribution, 100 is the product of the assumed 250 readmissions and assumed attribution; it is not an observed count.
- Baseline adherence-related cost: 100 × $13,000 = $1,300,000
Next separate the adherence change from the assumed readmission effect:
- Adherence rises from 65% to 88% (23 percentage points; 35.4% relative increase); nonadherence falls from 35% to 12% (65.7% relative reduction). A readmission effect must be independently estimated.
- For the worked financial case only, assume a separate 35% reduction in the 100 attributed readmissions: 100 × 0.35 = 35 readmissions avoided. This 0.35 is not derived from the 35.4% relative adherence increase or the 65.7% relative nonadherence reduction.
- Remaining adherence-related readmissions: 100 - 35 = 65 readmissions
- New adherence-related cost: 65 × $13,000 = $845,000
Against those potential savings, the first-year program has four costs:
- Device cost: 1,000 × $45 = $45,000 (one-time)
- Connectivity: 1,000 × $3 × 12 = $36,000 (annual)
- Integration labor (FHIR API, EHR): $25,000 (one-time)
- Clinical monitoring staff: $80,000/year (nurse reviewing adherence data)
- Total Year 1 cost: $186,000
Using that separate 35% avoided-admission assumption gives the worked financial result:
- Prevented readmission savings: $1,300,000 - $845,000 = $455,000
- Net savings Year 1: $455,000 - $186,000 = $269,000
- Modeled first-year ROI: $269,000/$186,000 ≈ 145%, conditional on validating the assumed avoided admissions.
Reimbursement is a separate potential revenue stream under this example’s rates:
- RPM code 99454 (device supply): 1,000 × $62/month × 12 = $744,000
- RPM code 99457 (first 20 min): 1,000 × $51/month × 12 = $612,000
- Total reimbursable: $1,356,000 (offsets costs and creates revenue stream)
Result: Under these assumptions, gross avoided admission costs are about 2.45 times program cost and net modeled savings about 1.45 times cost; payer reimbursement is a separate uncertain line item. Any modeled benefit depends on validating avoided admissions and separately accounting for treatment costs, CMS payment adjustments, device purchase, connectivity, integration and staff.
Key insight: Healthcare IoT economics depend on separately modeled treatment costs, payer adjustments, device and connectivity costs, integration, and staff; do not equate an avoided admission with an avoided CMS penalty.
The original calculator instead transfers the 65.7% relative nonadherence reduction directly into readmissions. That produces a different financial result and lacks an independently established causal effect. Keep the worked 35% avoided-admission assumption explicit when comparing it with that simulator. Its controls are useful for sensitivity analysis, but neither choice validates the benefit. The $62 and $51 monthly rates here also differ from the earlier RPM example’s $55.72 and $48.80. Keep these as separate scenario rates, and verify eligibility and payment before treating the $1,356,000 as revenue.
10.7 Plan for Patients and Regulatory Work
A positive spreadsheet does not resolve the deployment barriers. In the illustrative project, teams plan 18 months for an impressive medical device, then discover another 12 months of EHR integration consuming 40% of the budget. Those are planning cautions, not typical integration measurements. Start with the FHIR API design and determine which sensor observations can flow through existing clinical pathways. The separate 30–40% development-effort allowance for EHR connectivity is also a sample budgeting assumption to revisit after scoping the interfaces.
The last mile is the patient’s home. Designing for technically confident users misses the need in the example’s elderly population, with average age 68+ and limited smartphone proficiency. Design for the least technically capable user: cellular gateways requiring zero patient setup, automatic pairing, large physical buttons, and caregiver onboarding. Difficult Bluetooth pairing can reduce uptake, but a first-week abandonment percentage needs measured evidence. Elderly Care Systems applies related multi-sensor monitoring and alert-escalation patterns to aging in place.
A second deployment mistake is promising a 6-month go-to-market schedule without accounting for device-specific FDA 510(k) review, HIPAA risk assessment, SOC 2 audit, and CMS reimbursement qualification. Review time and total development time vary by device and pathway. Use current FDA review-time data before assigning a numeric review range. An 18–24 month project allowance can make regulatory work visible, but replace it with a device-specific schedule and scoped estimates for risk assessment, audits, and compliance costs.
Accuracy remains a deployment gate throughout this work. Do not turn MARD into a per-reading bound as deadlines approach. Use stratified performance evidence and approved labeling to define confirmation states, validate candidate alerts on representative time-series data, apply clinically governed dose limits, and prevent insulin stacking by tracking active insulin on board. HIPAA, FDA, and CMS constraints shape the architecture and release evidence, rather than arriving only at the final review.
10.8 Keep Dose Evidence Separate from Care Action
The financial and regulatory plans return us to the original dispenser event. Smart dispensers combine weight sensors, radio-frequency identification (RFID), and connectivity to detect pill removal, support reminders, and report observations. Sensor Integration explains the sensing interface; removal still does not establish swallowing. Ingestible sensors observe a different event. In the chapter’s example, stomach acid activates a 1 mm chip made of copper, magnesium, and silicon, acting as an electrolyte to generate approximately 1 volt. Its brief signal passes through body tissue to a wearable patch. The Biocompatible Sensors connection concerns that physical measurement boundary.
An ingestion-linked event is stronger evidence than a lid opening, but detection can be delayed or absent. It is not irrefutable proof that every dose was taken or absorbed. Likewise, a reminder alone does not prove ingestion, and a missing signal does not prove refusal. Preserve those limits when the event enters the protected relay and clinical record.
The relay owns protected delivery: patient identity, event time, consent, acknowledgement, and retry state must survive transmission to the authorized service. The care workflow then compares evidence with the prescribed schedule, escalates unresolved gaps, and records a concise result for the patient, caregiver, or clinician. These are three distinct responsibilities: creating dose-event evidence, delivering it safely, and closing the care record. FHIR APIs connect that record to the clinical workflow instead of creating another silo.
Continuous passive monitoring offers a related advantage over patient-triggered tests and periodic checkups: it captures behavior between visits. Chronic disease monitoring, including Parkinson’s, illustrates that shift. Wearable IoT Design considers continuous background sensing, while Biosensors and Vital Signs connects the CGM example with ECG and other biomedical measurements. Mechanical dispensing evidence, biometric verification, FDA and HIPAA responsibilities, and FHIR integration must all fit the intended use; weakness in one can undermine the deployment.
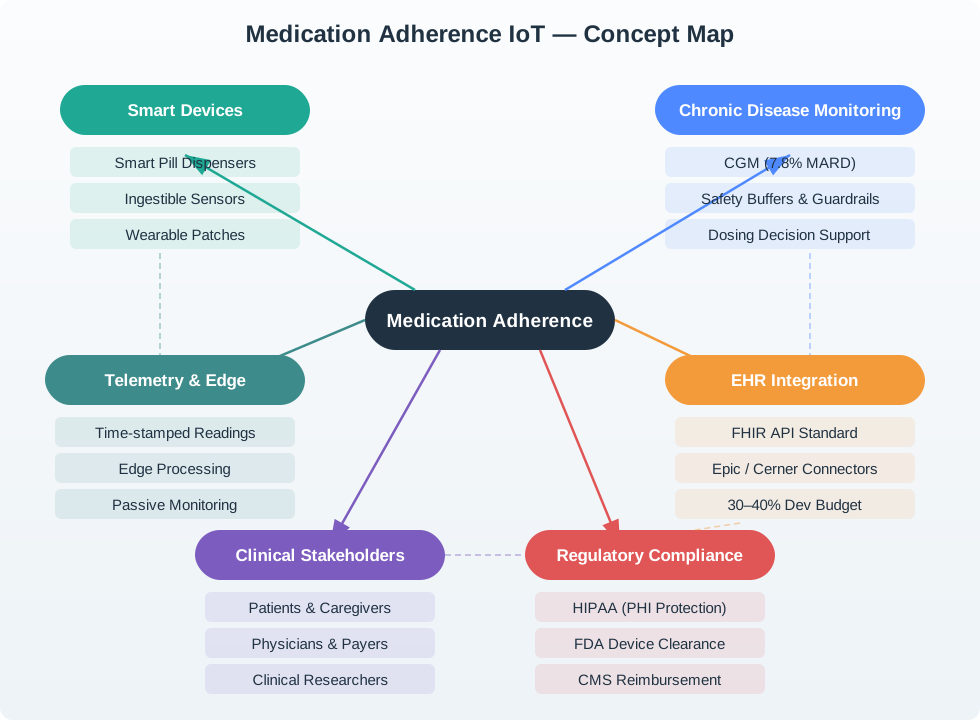
Read Figure 2 across the top first: stomach activation, the wearable patch, and edge/cloud processing precede FHIR or HL7 mapping. The lower CGM path requires its own validation. Both meet at accountable care: the RPM example sends abnormal readings to the Epic In-Basket care team, while caregiver is an authorized access role rather than the named recipient of that alert.
At the care-action boundary, escalation rules must be explicitly governed. The separate sequencing exercise uses caregiver alerts followed by provider escalation after 48 hours. The code exercise instead uses a 24-hour window and confidence of at least 0.80, alongside an active order, no patient opt-out, a dose not already marked taken, and a care plan that permits escalation. These are distinct exercise settings, not universal clinical thresholds. The shared principle is to check the prescription, consent, evidence quality, and approved response window before notifying anyone.
The same caution applies to value claims. Published US medication-nonadherence cost estimates of $100–300 billion per year are broad and method-dependent; they do not define a device-addressable IoT market. Adherence data can create value for patients, caregivers, physicians, payers, and clinical researchers, but each benefit needs evidence appropriate to its claim.
Summary
Medication evidence becomes useful when the right clinical record preserves its identity, timing, provenance, and limitations. Start with the EHR workflow and accountable response, then choose the sensing and protected delivery that can support it. The roughly $4 privacy and security allowance, 30–40% integration-effort allowance, reimbursement rates, and projected readmission savings are scenario assumptions to validate for the actual deployment.
Smart dispensers support reminders, verification, and reporting, while ingestible sensors provide ingestion-linked evidence with detection limits. Continuous passive monitoring can reveal behavior between scheduled checkups. CGM MARD describes average performance under study conditions; device labeling, stratified accuracy, and time-series validation must support alert and dosing rules. Regulatory work, patient usability, and clinical ownership belong in the architecture from the start.
Carry each observation’s limits all the way to the care action. A recorded event, protected delivery, and modeled financial return each need their own evidence before supporting a medication safety claim.
Next, Smart City Operations extends the application perspective to urban parking, lighting, waste, and traffic; Connected Agriculture offers a parallel setting for precision farming, livestock monitoring, and low-power wide-area network (LPWAN) sensor networks.
