5 Wearable IoT: Placement and Adoption Evidence
More
Depth: Practitioner
Progress saves as you read. Mark sections complete as you go; your progress appears in the sidebar.
- Podcast audio coming soon
- Character narration audio coming soon
5.1 Make the Measurement Worth Wearing
A wrist sensor that moves or irritates skin will produce weak data and poor use. Wearable IoT connects devices worn on the body—smartwatches, fitness trackers, smart glasses, and health monitors—to useful feedback. Placement must satisfy both the signal and the wearer: comfort, motion, battery life, consent, and interpretation all meet at the skin.
Follow a smartwatch through a day of heart-rate sensing, PE, and sleep tracking. Its sensors can collect personal signals continuously, but the wearer must want to keep it on, and the feedback must stay within what those measurements support. A score that looks precise is not enough. The problem is to match a useful claim to a tolerable placement and evidence from ordinary use. We will approach that problem through the wear test, sensor selection, and validation of daily feedback.
By the end, you should be able to match sensors to body placement and claims, evaluate comfort and adoption evidence, and explain how accuracy, battery life, and sensor drift limit feedback. Sleep tracking provides a concrete example of why accuracy calculations and user communication need device-specific evidence.
Wearable IoT has been described as a $1.6 trillion business opportunity (Morgan Stanley’s projection). That market expectation is separate from evidence of sustained use. Endeavour Partners’ 2014 consumer-wearable survey found about one-third of studied users stopped using their device within six months. This is historical consumer-survey data, not a current rule for all devices, and it did not isolate discomfort as the cause. The survey report supplies the context for the adoption discussion.
KEY CONCEPTS
- Photoplethysmography (PPG)
Optical heart-rate sensing uses an LED and photodetector to detect blood-volume changes under the skin.
- Inertial measurement unit (IMU)
An accelerometer and gyroscope measure motion for step counting, fall detection, and gesture recognition.
- Heart-rate variability (HRV)
Time variation between successive heartbeats; low HRV correlates with stress and reduced recovery and is tracked by advanced fitness devices.
- Continuous glucose monitor (CGM)
A subcutaneous sensor measures interstitial glucose, for example every 5 minutes, reducing reliance on finger-prick tests; use depends on the device and treatment instructions.
- Activity classification
An on-device machine-learning model distinguishes walking, running, and sleep from raw IMU data without cloud round-trips.
- Form factor constraint
Physical size and weight limit battery capacity, sensor count, and achievable battery life.
- Skin conductance (EDA)
Electrodermal activity measures sweat-gland response as a proxy for stress in emotion-sensing wearables.
5.2 Part Objectives
- Match wearable sensors to body placement and claims.
- Evaluate comfort, motion, and adoption evidence.
5.3 Pass the Wear Test Before Adding Features
Sammy’s watch illustrates why wearables differ from other IoT devices. They stay on the body, unlike a phone someone might forget, and offer hands-free notifications and automatic heart-rate, step, and sleep monitoring 24/7. Those benefits depend on continued wear. Users expect multi-day battery life; biometric information such as heart rate, location, and sleep is personal; and appearance matters at work as well as during exercise.
The chapter’s Fitbit example brings those requirements together: comfort for 24/7 wear, 5–7 day battery life, and an appearance suitable for work. Early smartwatches with daily charging and bulky, calculator-like styling illustrate the opposite design pressures. These examples help frame a design review, but they do not isolate why a product succeeded or failed. Ask whether someone would still wear the device after a week. If it comes off, additional sensors and dashboard features cannot collect useful longitudinal data.
The wear test has several parts. Physical comfort covers weight, strap pressure, skin irritation, sweat, water exposure, sleep posture, and whether the device catches on clothing or work equipment. Behavioral comfort covers charging routines, notification load, setup effort, and whether the device makes the user feel monitored rather than supported. Social comfort covers appearance, workplace acceptability, cultural expectations, and whether a visible health device reveals information the user would rather keep private.
A watch, ring, patch, chest strap, earbud, textile, or CGM can collect useful data, but each placement changes accuracy, social acceptability, charging habits, skin contact, and the claims the product can support. If users want discreet night monitoring and dislike a wrist display, compare ring, patch, and textile fit, signal, charging, and claim limits. A smaller display or a cheaper battery alone does not answer that preference.
The table compares the three choices for discreet night monitoring. Test each device in the way a person will wear it.
| Wearable | Signal quality | Comfort | Charging | Claim limits |
|---|---|---|---|---|
| Ring | Optical geometry and skin contact affect the signal. | Check fit during hand washing, resistance training, and work. | A smaller battery limits battery life. Check whether the charging routine suits the wearer. | A heart-rate trend needs evidence for that device. A ring alone does not prove a diagnosis. |
| Patch | Skin contact and sensor age matter. Check for missing data during daily use. | Skin irritation can affect continued wear. | Check the device’s battery life and the wearer’s routine. | Follow the device’s instructions. |
| Textile | Check skin contact and missing data during ordinary use. | Check fit, sweat, sleep posture, and whether it catches on equipment. | Check the device’s battery life and the wearer’s routine. | Match each claim to the measured signal and device-specific evidence. Do not infer a diagnosis from the form alone. |
Read across each row to see what to test before choosing a placement or making a claim.
Start with the action the wearable supports. Is it a wellness trend, training adjustment, fall-risk alert, medication prompt, glucose decision, workplace-safety warning, or clinical workflow? The answer determines sensor placement, validation depth, user messaging, and regulatory risk.
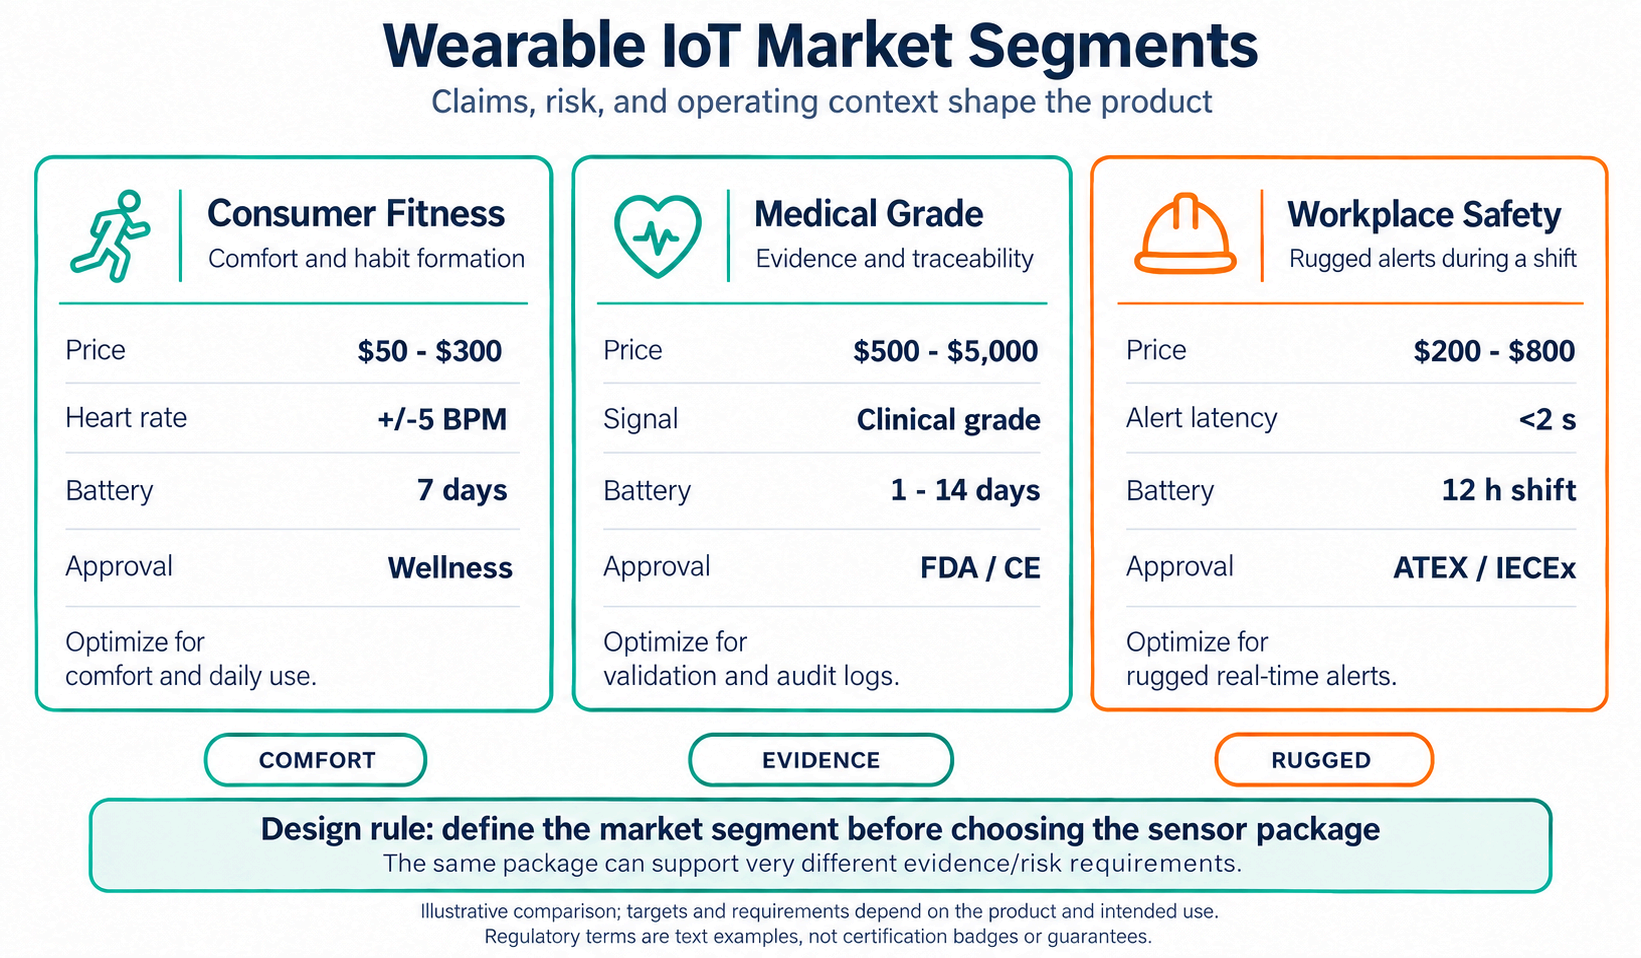
The figure’s values are illustrative comparisons, not device specifications. It places consumer fitness at $50–$300, ±5 BPM heart rate, and 7 days of battery life; medical-grade products at $500–$5,000 and 1–14 days; and workplace-safety products at $200–$800, alert latency below 2 seconds, and a 12-hour shift. Its wellness, FDA/CE, and ATEX/IECEx labels are regulatory examples, not certification badges or guarantees. Targets and requirements depend on the product and intended use. Use the comparison to identify questions for validation, rather than treating the market category as proof of accuracy, approval, or battery performance.
Figure 1 connects market preference to the supported action. The same sensor package becomes a different product when the claim changes. Review wearability during sleep, exercise, work, hygiene, charging, and social situations. Then ask whether the output is a wellness trend, coaching hint, safety assist, clinical screening, diagnosis, or treatment input. Finally, check how uncertainty, missing data, motion artifacts, poor skin contact, and battery limits appear to the user. A preferred form factor does not establish clinical validity.
5.4 Match the Signal and Placement to the Claim
With the wearer’s needs clear, choose the signals that can support the intended feedback. Wearable prototypes often mix optical, motion, electrical, thermal, and biochemical signals. Apple Watch, Fitbit, Garmin, Oura, Whoop, Polar H10, Dexcom G7, and Abbott FreeStyle Libre illustrate tradeoffs across wrist, ring, strap, and sensor-patch designs. The platform path may include BLE, ANT+, smartphone apps, Apple HealthKit, Google Health Connect, cloud APIs, HL7 FHIR for clinical integration, or a research export pipeline.
Start by writing the product claim in the weakest form that still creates value. “Shows resting heart-rate trend” needs different evidence than “detects arrhythmia.” “Supports sleep routine awareness” needs different evidence than “diagnoses sleep apnea.” “Encourages hydration habits” differs from “detects dehydration before symptoms.” That wording decides whether the team needs consumer usability testing, algorithm validation against a reference device, clinical evidence, medical-device quality management, or a clinician review workflow.
Accuracy also depends on body placement. Wrist PPG is convenient but vulnerable to motion, loose fit, tattoos, skin tone, and cold-weather perfusion changes. Chest electrocardiogram (ECG) straps can capture cleaner cardiac signals but are less acceptable for all-day wear. Rings may improve overnight comfort for some users but have smaller batteries and different optical geometry. CGM patches measure interstitial glucose rather than blood glucose and need careful messaging about lag, alarms, and treatment decisions.
Run placement and artifact tests before polishing the app. Test wrist fit across wrist sizes, exercise types, sweat, cold, tattoos, darker and lighter skin tones, and loose straps. Test rings during sleep, hand washing, resistance training, and daily work. Test patches for adhesive life, skin reaction, showering, and removal. Test earbuds for movement, ear shape, and battery heat. Record non-wear, poor skin contact, and when the model should withhold a metric instead of producing a confident but wrong score.
The detailed record below makes the claim reviewable. It connects each measurement to the placement, reference, and uncertainty that an attractive app can otherwise hide.
For cardiac signals, record PPG wavelength, sample rate, LED current, skin contact, strap tightness, motion artifact flag, ECG lead placement, reference device, and confidence interval.
For motion and fall detection, record accelerometer/gyroscope range, sampling frequency, body placement, activity class, impact threshold, posture transition, confirmation prompt, and emergency-contact fallback.
For sleep and recovery, record sleep window, movement, heart-rate trend, HRV method, skin temperature, SpO2 availability, wake confirmation, and uncertainty rather than over-precise sleep-stage labels. SpO2 is the oxygen-saturation estimate used in this record.
For glucose and clinical-adjacent workflows, record sensor age, calibration or factory-calibration status, lag between interstitial and blood glucose, alarm threshold, medication relevance, clinician review path, and data-sharing consent.
5.5 Validate Feedback in an Ordinary Day
Now return to Sammy’s watch and its “Sensor Squad.” Heartbeat Harry, the PPG sensor, shines green light into the wrist and detects changes in returned light as blood volume changes. In the story, the watch reports 72 beats per minute. Steppy the Accelerometer responds to movement during PE and reports 4,327 steps, but arm waving can also be counted as steps. An arm swing is evidence for an algorithm to interpret, not proof of a footstep.
At bedtime, Dreamy the Sleep Tracker combines movement and heart-rate signals to estimate sleep. These signals do not directly observe eye movements or establish dreaming. The watch is not equivalent to hospital sleep measurement. Sammy sees a sleep score rise from 72 to 78 and a report of 20 minutes more sleep than last week, then decides to keep a regular bedtime. Those numbers illustrate feedback; they do not establish measurement accuracy or prove that sleep improved.
This is where device-specific validation matters. Performance depends on the device, task, population, and reference method. Use those validation data rather than generic heart-rate, step-count, or sleep-stage percentages. A rolling average can reduce some random variation, but it does not automatically correct bias or classification errors. Validate every trend metric against the reference method and communicate its limits. A trend can support a useful habit only when its evidence supports that interpretation.
Battery Bob provides the other half of Sammy’s day: the story starts at 100% charge and reaches 35% after heart-rate sensing every second, all-day motion sensing, and overnight tracking. He worries that turning on GPS could empty the battery by lunchtime. These are illustrative story values, not a battery specification. They show why power testing must match the feature combination people actually use.
Continuous PPG, SpO2, GPS, always-on display, haptics, audio, LTE, and frequent BLE sync can turn an advertised multi-day device into a daily-charge product. Decide which features degrade first: lower sampling, reduced display, delayed sync, disabled GPS, or a missing metric. Make degradation visible so low-power mode does not silently reduce safety or clinical-adjacent claims. Sustained wear needs both useful feedback and a charging routine the wearer can maintain.
Finally, design the data-sharing path explicitly. Some users want social fitness sharing; others treat body data as highly private. Employer wellness, insurer incentives, research studies, family caregiver access, and clinician dashboards require different consent, revocation, export, retention, and audit behavior. Ask which sharing is appropriate for this claim and user relationship, rather than simply whether the platform can share data.
Population analytics can be useful and sensitive even when the source device looks like consumer wellness. A Jawbone-style aggregate sleep trace after an earthquake can reveal neighborhood recovery patterns. A HAPIfork-style connected utensil can turn meal tempo into coaching or adherence data. A phone health dashboard can combine activity, nutrition, glucose, sleep, respiratory rate, oxygen saturation, and weight. Treat these as derived health inferences, not harmless gadget telemetry.
If the product compares people, infers pregnancy or routines from purchases and location traces, or shares trends with researchers, insurers, employers, or public dashboards, its consent and aggregation record should state what is inferred, at what population threshold it may be reported, and which individual-level data is withheld. The validation and design trade-offs route develops the evidence review further.
The same review applies beyond watches. Inspect the photograph of AR glasses below for visible package, interfaces, scale, mounting, and wearing context. A catalogue label alone cannot establish deployment fit, comfort, or signal quality.

Summary
A wearable earns continued use through comfort, charging habits, appearance, trust, privacy, and a useful purpose. Placement changes both the signal and the wearer’s experience. Match the product claim to device-specific evidence, test artifacts in ordinary use, and show missing data and degraded sensing honestly.
Sammy’s daily readings and weekly sleep score illustrate the evidence boundary: a plausible value or smoother trend still needs validation. The same boundary applies when body data becomes a shared health inference.
Choose a placement people will keep wearing, then validate the signal and every claim made from it.
Carry this placement and adoption evidence into Wearable IoT: Privacy and Power Constraints, which begins with Body Data Needs Strong Boundaries.
