13 Elderly Care IoT: Monitoring, Economics, and Autonomy
13.1 Start With the Story
A fall-alert service can meet its response budget, but daily care depends on slower patterns as well as sudden events. The team must decide when sensor fusion supports useful prevention, whether the economics hold, and how monitoring can protect safety without taking away autonomy.
13.2 Overview
This route broadens from sensor fusion into behaviour patterns, clinical insight, prevention value, privacy, autonomy, and adoption economics.
This is part 2 of 2. Review Elderly Care IoT: Fall Detection and Alerts when you need the first route.
13.3 Learning Objectives
By the end of this chapter, you will be able to:
- combine sensor evidence into a reviewable care signal
- interpret behaviour baselines and prevention economics
- balance monitoring safety with privacy and autonomy
13.4 Chapter Roadmap
Follow the original sections below in order. They begin at the reviewed split boundary and keep every worked example, figure, check, and supporting banner with the section that owns it.
13.5 Sensor Fusion Review
13.6 Base Rate Problem Basics
Imagine you have a smoke detector that is 95% accurate. That sounds great, right? But think about it:
- Real fires: Maybe 1 per year
- Non-fire events (cooking smoke, steam, dust): Maybe 1,000 per year
Your detector catches the 1 real fire (95% chance) — great! But it also false-alarms on 50 of the 1,000 non-fire events (5% false positive rate). So you get 50 false alarms for every 1 real fire.
Fall detection faces the same problem: falls are rare, but normal activities happen thousands of times per day. This is why multi-sensor fusion and ML-based classification are critical — they push the false positive rate lower by using more information to distinguish real falls from look-alike events.
With the alert math in place, the next question is what other signals belong in the care model. Fall events need seconds-level escalation, while behavior change needs trend evidence before anyone intervenes.
13.7 Elderly Monitoring Architecture
Beyond fall detection alone, comprehensive elderly monitoring systems integrate multiple physiological and environmental sensors to create a complete picture of senior health and safety:
Figure 13.1 works one sensor through end to end, the smallest complete version of the chain this section then widens.
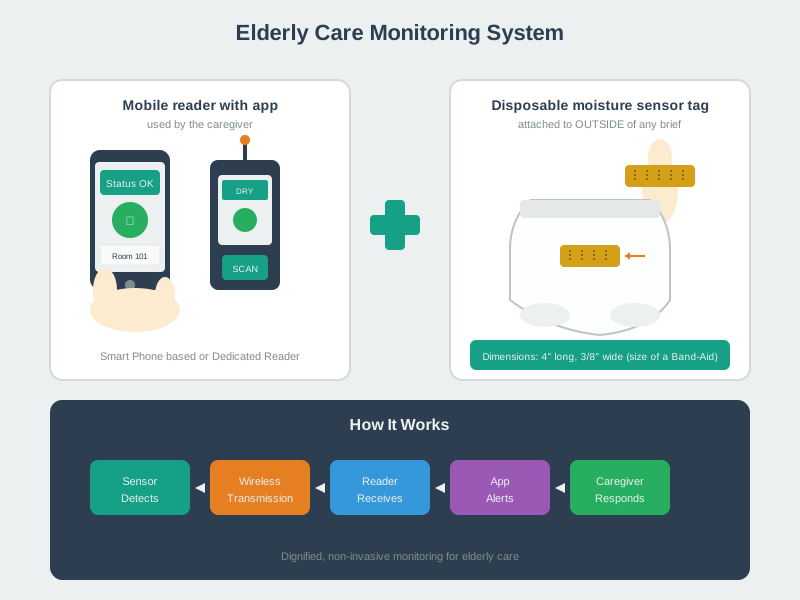
Follow the five steps along the foot of Figure 13.1: the sensor detects, it transmits wirelessly, a reader receives, the app alerts, and a caregiver responds. Above them the same chain is drawn concretely. A thin disposable tag sits on the outside of a garment, so nothing invasive touches the resident. A phone or a dedicated reader picks up the signal and shows a plain status with a room number attached, which is what turns a reading into an assignable task. The claim here is dignity as much as data. Every other sensor in this section repeats those five steps, and each one adds alerts a caregiver must judge.
Multi-Modal Sensor Integration for Elderly Care:
- Wearable physiological: Smartwatch or pendant with accelerometer, gyroscope, and PPG. Data collected: fall events, heart rate, activity level, and sleep quality. Clinical value: fall detection, cardiovascular monitoring, and spotting activity decline.
- Wearable medical: Blood pressure cuff, pulse oximeter, and glucose monitor. Data collected: blood pressure readings, SpO2, and glucose trends. Clinical value: chronic disease management and earlier intervention.
- Ambient motion: PIR sensors in rooms, hallways, and bathrooms. Data collected: movement patterns, room transitions, and bathroom visits. Clinical value: detecting unusual inactivity and behavior changes.
- Access control: Door and window sensors plus smart locks. Data collected: entry and exit events plus wandering detection. Clinical value: dementia safety and preventing unsafe exits.
- Bed or chair occupancy: Pressure mats and weight sensors. Data collected: time in bed, restlessness, and nighttime bathroom trips. Clinical value: sleep quality, fall-risk assessment, and routine tracking.
- Environmental: Smart thermostats plus water and light sensors. Data collected: room temperature, water-use patterns, and light usage. Clinical value: keeping the environment safe and detecting missed meals or hygiene problems.
- Medication: Smart pill dispensers and RFID cap sensors. Data collected: pill removal and adherence patterns. Clinical value: tracking compliance and reducing adverse events.
13.8 Sensor Patterns to Clinical Insight
Modern elderly monitoring systems don’t just collect data - they use machine learning to detect subtle changes that predict health decline:
Inspect Figure 13.2 to compare what an average and a median do to the same isolated sensor spike.
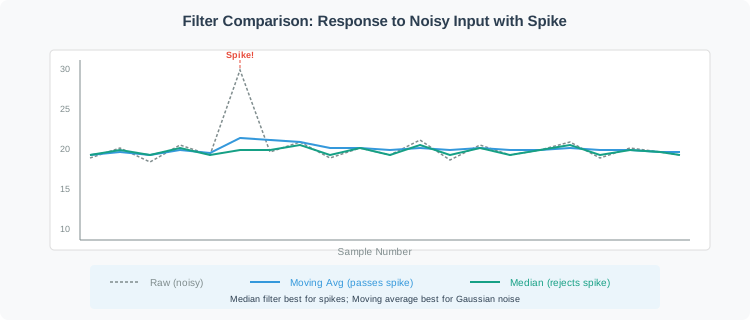
Use the three-sample window in Figure 13.2: 22 + 55 + 23 = 100, and 100 ÷ 3 = 33.3, so the moving average pulls the isolated spike into its output. The median sorts the same values as 22, 23, 55 and returns the middle value, 23. That filter rejects one impossible spike without spreading it into nearby estimates. A moving average can still suit small random jitter on a slow signal; the median is the stronger first defense when a sensor occasionally produces a lone extreme reading. Real-World Detection Scenarios:
- Reduced kitchen activity: Sensor pattern shows 50% fewer fridge opens and 70% less cooking time. Potential issues: depression, physical decline, or cognitive problems. Trigger: family check-in and meal service referral.
- Increased nighttime bathroom trips: Sensor pattern rises from 3 to 7 trips per night over two weeks. Potential issues: UTI, diabetes, prostate problems, or medication side effects. Trigger: doctor visit and urinalysis.
- Delayed morning routine: Sensor pattern shows getting out of bed two hours later than baseline. Potential issues: depression, medication side effects, or physical pain. Trigger: wellness call and medication review.
- Reduced outdoor activity: Sensor pattern shows no outdoor trips for five days. Potential issues: social isolation, mobility issues, or fear of falling. Trigger: social engagement scheduling and physical therapy.
- Irregular sleep patterns: Sensor pattern shifts from 10pm-7am to 3am-11am bed occupancy. Potential issues: circadian disruption, medication issues, or pain. Trigger: sleep study referral and medication timing adjustment.
- Wandering behavior: Sensor pattern shows 2am exits with confused returns. Potential issues: dementia progression and sundowning. Trigger: more supervision and memory-care evaluation.
13.9 Passive Progression Monitoring Between Assessments
A Parkinson’s disease example in the source material makes the difference between an event alert and a progression record explicit. Symptoms can fluctuate continuously, so a monthly clinical check may not represent what happens between visits. The proposed monitoring pattern runs passively in the background: motion sensors record changes in movement, audio sensors track changes in speech, and a camera measures how long a task takes. The value is the time series across repeated observations, not one isolated reading.
For an operating record, keep the three evidence streams distinct. A movement change, a speech change, and a longer task time are different observations even when they appear together. Their timestamps and trend windows must remain visible so a reviewer can see whether the signals changed together or only one channel moved.
13.10 Patterns Prevent Admit
Scenario: 78-year-old woman with hypertension and mild cognitive impairment lives alone.
Baseline Normal Pattern:
- Morning routine: Out of bed 7:30am, kitchen activity 8am, medication taken 8:15am
- Daily steps: 3,500-4,500
- Bathroom visits: 5-6x/day
- Sleep: 10:30pm-7:30am (9 hours)
- Medication adherence: 98%
Week 1-2 Subtle Changes Detected:
- Morning routine delayed 45 minutes
- Daily steps declined to 2,800 average (-32%)
- Kitchen activity reduced 40%
- Medication adherence dropped to 85% (2 missed doses)
- Bathroom visits increased to 8-9x/day
ML Risk Assessment:
- Depression risk: MODERATE (activity decline, routine disruption)
- UTI risk: MODERATE (increased bathroom frequency)
- Fall risk: ELEVATED (reduced activity, gait speed decline)
- Nutrition concern: MODERATE (reduced cooking activity)
Intervention (Day 15):
- Family caregiver alerted via app: “Mom’s activity down 30%, possible health concern”
- Daughter visits, discovers Mom has painful knee limiting mobility
- Doctor visit scheduled, knee arthritis diagnosed and treated
- Physical therapy prescribed, medication optimized
Outcome:
- Without IoT monitoring: Gradual decline continues, eventual fall -> hip fracture -> hospitalization ($40,000+ cost, possible long-term care placement)
- With IoT early detection: $500 doctor visit + $800 physical therapy = $1,300 intervention prevents $40,000+ hospitalization
- ROI: 30x return on IoT monitoring investment
Key Insight: The system didn’t detect a single dramatic event - it caught a subtle 2-week behavioral pattern that human observers would miss until a crisis occurred.
 Checkpoint: Behavior Patterns
You know:
- Monitoring expands beyond falls when wearable, medical, ambient motion, access, bed, environmental, and medication sensors produce care-level summaries.
- A 2-4 week baseline lets the system compare routine changes such as 50% fewer fridge opens, 70% less cooking time, 3 to 7 bathroom trips, or 2am wandering.
- The example intervention costs $1,300 and prevents a possible $40,000+ hospitalization, making trend evidence operationally valuable before a crisis.
13.11 The Business Case for Elderly IoT
13.12 Compelling Statistics
Incontinence Management in Long-Term Care:
- 40-60% of nursing home residents suffer from urinary incontinence
- Traditional manual checks every 2-4 hours miss many incidents
- Delayed detection leads to skin breakdown, infections, and dignity concerns
- Smart diaper solutions enable real-time remote monitoring
Why IoT Matters Here:
- Early Detection: Wearables detect falls within seconds vs. hours for unmonitored seniors
- Predictive Analytics: Gait analysis can predict fall risk days in advance
- Dignity Preservation: Remote monitoring reduces invasive manual checks
- Cost Reduction: Preventing one hip fracture ($40,000+) pays for years of monitoring
- Independence: Seniors can age in place rather than moving to care facilities
The Business Model: Who Pays for Elderly IoT?
- Individual or family: Value received is peace of mind, slowing decline, and aging in place. Payment model: $30-80 per month plus hardware. Market example: Philips Lifeline and Medical Guardian.
- Health insurance: Value received is fewer hospitalizations and lower long-term care cost. Payment model: preventive-care coverage or value-based incentives. Market example: Medicare Advantage plans.
- Assisted living facilities: Value received is lower staff burden, better care quality, and premium pricing. Payment model: bundled technology infrastructure. Market example: senior living communities.
- Healthcare providers: Value received is remote patient monitoring reimbursement, including CPT 99457. Payment model: insurance billing for chronic care management. Market example: primary care practices.
- Adult children: Value received is delayed nursing-home placement and lower caregiver stress. Payment model: direct purchase for a parent. Market example: consumer market.
Medicare Remote Patient Monitoring (RPM) Reimbursement:
Since 2019, Medicare reimburses providers for elderly IoT monitoring under CPT codes:
- 99453: Initial device setup ($19 per patient)
- 99454: Device supply/daily recording ($62/month)
- 99457: First 20 minutes of interactive communication ($51/month)
- 99458: Additional 20 minutes ($41/month)
13.13 In 60 Seconds
This chapter explores real-world IoT applications in elderly care & fall detection, illustrating how sensor data, connectivity, and analytics combine to address specific human needs and operational challenges.
Illustrative reimbursement under these assumptions: $154 in recurring monthly components, plus a $19 one-time setup component. If every recurring component is furnished, documented, and billable in all 12 months, the first-year total is $1,867 per patient. Actual eligibility and payment depend on current payer rules and the services delivered.
13.14 Fall Prevention ROI
Calculate return on investment for IoT fall detection deployment.
Key Insight: One prevented hip fracture ($40k) pays for monitoring ~20 patients for one year. The business case strengthens dramatically with higher fall-risk populations (e.g., 80+ age group has 50% annual fall rate vs 25% for 65-79 age group).
The ROI case is strongest when the system is trusted enough to stay worn and accepted. That makes personalization and privacy part of the economics, not a late-stage polish item.
13.15 Personalized Fall Detection
The mistake: Using a universal 3g impact threshold for fall detection across all elderly patients.
Why it fails: An 85-year-old with sarcopenia (muscle loss) and a 68-year-old active senior have completely different gait dynamics. The frail patient generates only 1.8-2.2g during normal sitting, triggering false falls. The active patient generates 3.5g running down stairs, masking actual falls.
The consequence: False positive rate of 25-40% for frail patients (alert fatigue, system abandonment), false negative rate of 15-20% for active patients (missed critical events).
The fix: Implement a 2-week personalization period where the accelerometer learns each patient’s baseline movement signature. Dynamic thresholds adapt: 2.0g for Patient A (frail), 3.8g for Patient B (active). Add gyroscope corroboration (orientation change) and floor pressure mat confirmation to reduce false positives by 90%.
Measured outcome: Post-personalization false positive rate drops from 30% to 2.8%, while maintaining 96% true detection sensitivity. System compliance increases from 58% (pre-personalization) to 87% (post-personalization) because patients trust that alerts are meaningful.
13.16 Privacy and Autonomy Considerations
Elderly IoT systems must balance safety monitoring with dignity and independence. This is not merely a technical challenge — it is an ethical imperative that determines whether seniors accept or reject the monitoring system entirely.
Dignity has to become something a team can build and check. Figure 13.3 turns it into six rules a wearable design can be tested against.
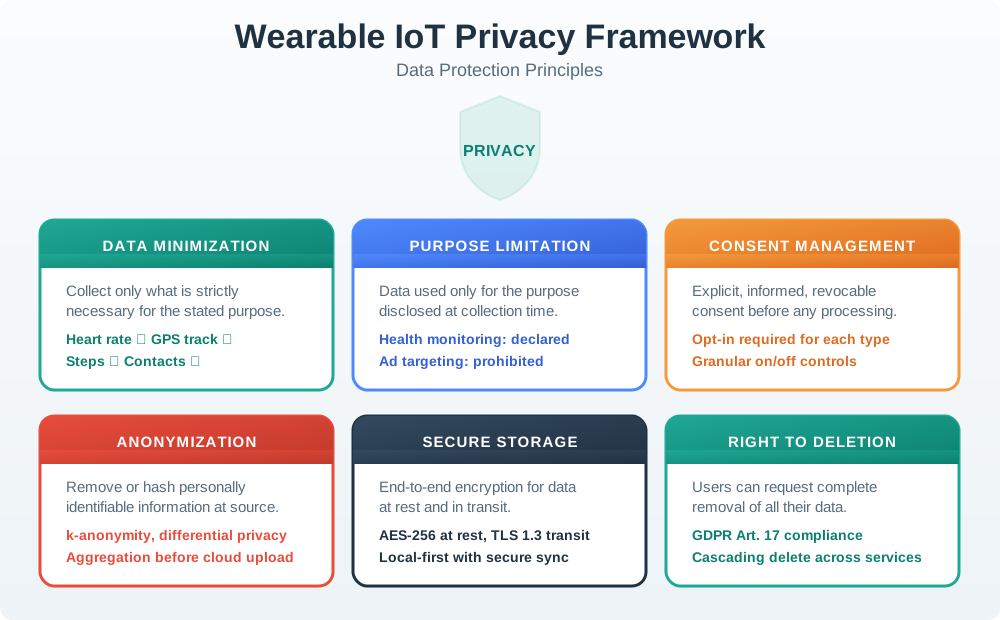
The six panels in Figure 13.3 move from what you collect to what you finally delete. The first two settle scope: gather only the readings the stated purpose needs, and refuse later uses such as ad targeting. The consent panel makes that promise checkable, because the senior grants each data type on its own and can take the grant back. The middle pair covers handling. Strip or blur identity before data leaves the home, and keep it encrypted at rest and in flight. The last panel closes the loop with a deletion right that must reach every downstream service. Read together, they show that privacy here is a set of build tasks, not a policy page.
Opt-in monitoring leaves the senior in control of which sensors remain active and who receives their data, preserving autonomy and reducing surveillance anxiety. Transparent alerts let the senior see the same notifications as family members, apart from agreed emergency overrides, which supports trust. Override capability permits sensors to be disabled for visitors or private moments. Data minimization limits collection to clinically necessary information and deletes records according to policy, reducing both regulatory and privacy exposure. Local processing first assigns routine monitoring to edge analytics while the cloud handles broader pattern analysis, improving response time and limiting network exposure. Graduated response places a gentle patient prompt before family notification or provider intervention, preserving independence and reducing alarm fatigue.
13.17 The Autonomy Paradox
Studies show that 40-60% of elderly patients initially resist IoT monitoring systems, perceiving them as surveillance tools that signal loss of independence. Ironically, effective monitoring extends independent living by 2-5 years on average.
Design implication: The first 30 days determine long-term adoption. Systems that give seniors visible control (dashboard showing their own data, easy sensor pause buttons, transparent alert history) achieve 85%+ sustained adoption. Systems that feel “invisible” or “parent-like” see 50%+ abandonment within 90 days.
Checkpoint: Adoption Economics
You know:
- Fixed 3g thresholds can drive 25-40% false positives for frail patients and 15-20% false negatives for active patients.
- A 2-week personalization period can move false positives from 30% to 2.8% while keeping 96% true detection sensitivity.
- Privacy controls, local processing, and visible user control support the 85%+ sustained adoption the business model depends on.
13.17.1 Knowledge Check: Privacy Design
13.18 Privacy Design Review
13.18.1 Knowledge Check: System Economics
13.19 System Economics Review
13.20 Interactive Quiz: Match Concepts
13.21 Interactive Quiz: Sequence the Steps
Common Pitfalls
13.22 Initial Prototype Over-Engineering
Adding too many features before validating core user needs wastes weeks of effort on a direction that user testing reveals is wrong. IoT projects frequently discover that users want simpler interactions than engineers assumed. Define and test a minimum viable version first, then add complexity only in response to validated user requirements.
13.23 Development Security Neglect
Treating security as a phase-2 concern results in architectures (hardcoded credentials, unencrypted channels, no firmware signing) that are expensive to remediate after deployment. Include security requirements in the initial design review, even for prototypes, because prototype patterns become production patterns.
13.24 Failure and Recovery
Designing only for the happy path leaves a system that cannot recover gracefully from sensor failures, connectivity outages, or cloud unavailability. Explicitly design and test the behaviour for each failure mode and ensure devices fall back to a safe, locally functional state during outages.
13.25 Label the Diagram
13.26 Code Challenge
13.27 Summary
13.27.1 Key Takeaways
Elderly fall detection and comprehensive monitoring represent one of the highest-impact applications of IoT in healthcare:
- Scale of the problem: Falls cost about $50 billion annually, affect 1 in 4 adults 65+, and a single hip fracture can exceed $40,000.
- Sensor fusion: Accelerometer, gyroscope, heart rate, and ambient sensors together can exceed 95% detection accuracy.
- Alert latency: Start from the 15-minute clinical window, subtract 8 minutes for EMS, and design around the roughly 7 minutes left for detection plus caregiver escalation.
- Base rate problem: Even 95% specificity can still create hundreds of false alarms per day at scale, so alert fatigue must shape the design.
- Behavioral analytics: Subtle two-week changes in activity and routine can predict crises before they become emergencies.
- Business model: Medicare reimbursement above $154 per month per patient means preventing one fall can fund about 20 patient-years of monitoring.
- Privacy balance: Edge-first processing, opt-in controls, and graduated response can drive 85%+ sustained adoption.
13.27.2 Design Principles to Remember
- Work backward from clinical outcomes, not forward from technical capabilities
- Fuse multiple sensor modalities to reduce false positives below the alert fatigue threshold
- Design graduated alert cascades with patient self-cancel as the first filter
- Process locally first to satisfy data minimization requirements and reduce latency
- Personalize baselines rather than using fixed thresholds across all patients
- Give seniors visible control to ensure long-term system adoption
13.28 What’s Next
- If you want to explore application domains for this technology, read Application Domains Overview.
- If you want to learn about UX design for connected devices, read UX Design for IoT.
- If you want to start prototyping with the concepts covered, read Prototyping Essentials.