16 Baby Monitoring: Diapers, Privacy, and Trade-offs
16.1 Start With the Story
A nursery monitor can raise a careful breathing alert, but the family also wants diaper events, room controls, and useful trends. The team must decide which data deserves an alert, who may see it, and how to keep extra convenience from weakening privacy or safe care.
16.2 Overview
This route starts with self-powered diaper sensing, then tests UTI evidence, environmental control, privacy, product comparisons, and false-alarm trade-offs.
This is part 2 of 2. Review Baby Monitoring: Nursery Safety and Alerts when you need the first route.
16.3 Learning Objectives
By the end of this chapter, you will be able to:
- explain how a smart diaper powers and reports an event
- separate UTI pattern evidence from medical diagnosis
- design nursery controls and privacy rules around caregiver decisions
16.4 Chapter Roadmap
Follow the original sections below in order. They begin at the reviewed split boundary and keep every worked example, figure, check, and supporting banner with the section that owns it.
16.5 Self-Powered Smart Diaper Technology
One of the most innovative pediatric IoT applications is the self-powered smart diaper that harvests energy from the very substance it’s detecting:
Inspect Figure 16.1 from urine contact at the anode and cathode through the biofuel cell’s 0.5 V output and supercapacitor to the moisture, pH, and temperature sensors. The final BLE link to the parent’s phone is the boundary that turns harvested energy into a timestamped wetness or health event without adding a battery to the diaper.
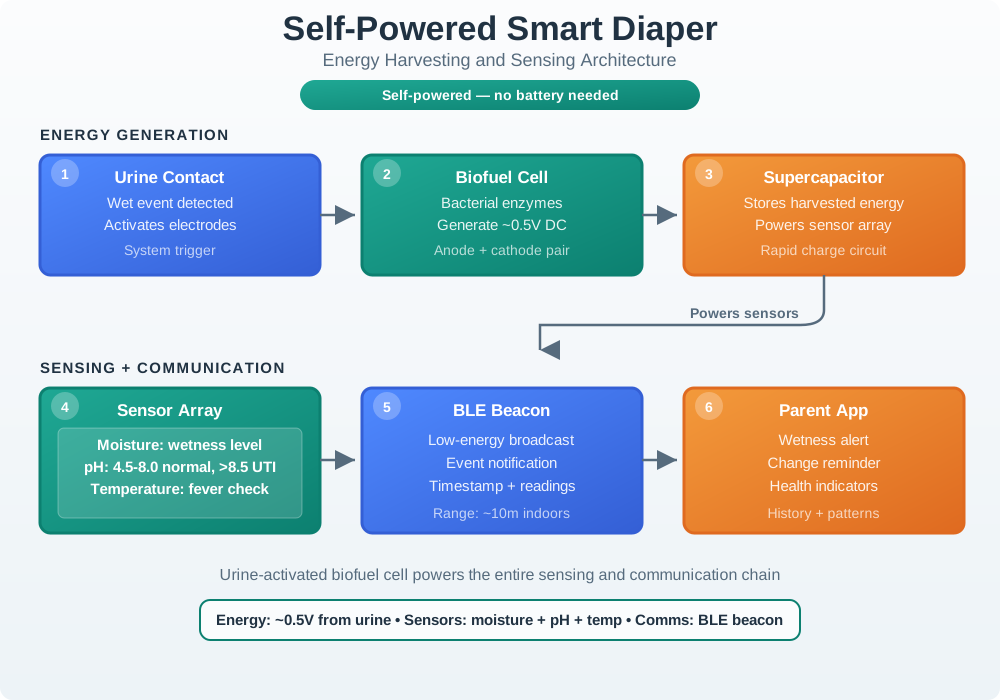
Follow Figure 16.1’s arrows from urine-triggered generation to stored charge, sensor activation, and BLE transmission. Keep the pH ranges (normal 4.5-8.0 versus a UTI indicator above 8.5), temperature reading, and event timestamp attached to that path: the energy-harvesting chain proves that a notification can be powered, while clinical interpretation still requires the later multi-sensor evidence and caregiver workflow. How the Biofuel Cell Works:
- Urine Detection: When wet event occurs, urine contacts electrodes
- Energy Generation: Microbial fuel cell uses bacterial enzymes in urine to generate ~0.5V DC
- Power Storage: Tiny capacitor stores harvested energy
- Sensor Activation: Powers moisture, pH, and temperature sensors
- Wireless Transmission: BLE beacon signals wetness event to smartphone
Advantages of Self-Powered Design:
- No batteries: Eliminates safety concerns about battery ingestion
- No charging: Parents never need to remember to charge
- Disposable integration: Works with standard disposable diapers
- Low cost: Simple electrodes printed on diaper material
The harder question is when a record of wet events should raise an alarm at all. Figure 16.2 works through the three conditions the chapter’s example asks for first.
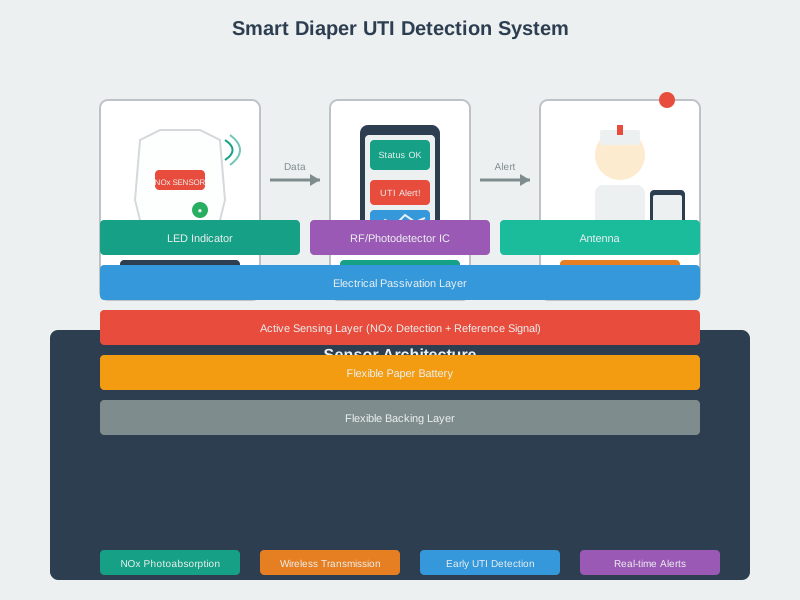
The top of Figure 16.2 shows the easy part: sensors in the diaper send a timestamped reading to the parent’s phone over a short radio link. The rest of the figure is the hard part. One high pH reading proves nothing, so the example wants three samples in a row above 8.5. It then asks whether wet events have risen more than half above the child’s own baseline, using eight a day against fourteen. Last it wants a second signal, either a warm diaper surface or a positive nitrite test. Miss any one and the system keeps watching. Meet all three and it asks a pediatrician to look, which is still not a diagnosis.
16.6 UTI Pattern Review
16.7 UTI Early Detection
Urinary tract infections (UTIs) are common in infants and often go undetected until symptoms become severe:
| Statistic | Value | Clinical Impact |
|---|---|---|
| UTI prevalence in infants | 7-8% of febrile infants | Common missed diagnosis |
| Delayed diagnosis risk | Kidney damage, sepsis | Serious long-term consequences |
| Traditional detection | Catheter urine sample | Invasive, often delayed |
| Symptoms in infants | Non-specific (fever, fussiness) | Easy to miss or misattribute |
How Smart Diapers Enable UTI Detection:
| Sensor | Measurement | UTI Indicator |
|---|---|---|
| pH Sensor | Urine acidity (normally 4.5-8.0) | Elevated pH (>8.5) suggests infection |
| Nitrite Sensor | Bacterial metabolite | Positive indicates bacterial presence |
| Frequency Pattern | Time between wet events | Increased frequency with UTI |
| Temperature | Diaper surface temperature | Elevated temp may indicate fever/infection |
| Color (optical) | Urine cloudiness/color | Cloudy or blood-tinged suggests UTI |
16.7.1 The Detection Algorithm
The multi-sensor UTI detection logic combines readings from multiple sensors and compares against the infant’s personal baseline:
UTI detection decision tree showing multi-sensor pattern analysis using pH threshold, wetness frequency, and confirmation signals before escalating to parents.
Pseudocode representation:
IF pH > 8.5 for 3+ consecutive samples
AND wet frequency increased >50% from baseline
AND (temperature elevated OR nitrite positive)
THEN flag "UTI Risk - Consult Pediatrician"
16.8 UTI Pattern Walkthrough
This example shows how the algorithm transitions from baseline monitoring to a meaningful alert only after multiple signals align.
| Period | Wet Events per Day | Average pH | Confirmation Signal | System Decision |
|---|---|---|---|---|
| Days 1-7 | 8 | 6.0-6.8 | None | Baseline only |
| Days 8-10 | 9-10 | 7.0-8.2 | None | Watch for a trend |
| Days 11-12 | 11-12 | 8.6-8.8 | Mild temperature rise | Escalate to review |
| Days 13-14 | 12-14 | 8.8-9.0 | Nitrite positive or fever | Flag UTI risk |
Pattern to notice: The diaper does not react to a single odd pH reading. It waits for rising pH, increased wetness frequency, and a confirmation signal before recommending pediatric follow-up.
Key Insight: Smart diapers do not diagnose UTIs; they can flag patterns for clinical follow-up. A urinalysis is still required for diagnosis. Any lead-time or reduction in pyelonephritis in the scenario below is a model assumption that requires prospective clinical evidence.
 Checkpoint: Smart Diaper Evidence
You know:
- The diaper is event-driven intelligence: urine can generate about 0.5V, enough for a brief BLE beacon without putting a button battery in a disposable infant product.
- The UTI logic waits for a pattern: pH above 8.5 across samples, wet frequency more than 50% above baseline, and a confirmation signal before parent escalation.
- In this hypothetical cohort, 71 of 82 UTI episodes were flagged (86.6% sensitivity), and 71 of 103 alerts matched an episode (68.9% positive predictive value); daily specificity needs UTI-positive infant-days.
16.9 Smart Nursery Environmental Control
Beyond infant monitoring, smart nurseries integrate environmental control for optimal sleep conditions:
Figure 16.3 shows the rule that keeps a nursery system from waking the parents it is meant to help.
The three columns of Figure 16.3 are sense, adjust and check, and the order is the design. Each row starts with a reading that has crossed a threshold: a room at 76 degrees, air at 32 percent humidity, a sleep area still at 8 lux, or a room quiet enough to unsettle a startled infant. The middle column acts first, without a person, by cooling, humidifying, closing blinds or starting white noise. Only the third column decides whether to wake anyone, and every rule there waits for evidence that the fix did not work. Fix the environment first, then apply the follow-up rule.
Optimal Infant Sleep Environment Parameters:
| Parameter | Optimal Range | IoT Control Method | Risk if Outside Range |
|---|---|---|---|
| Temperature | Avoid overheating; check the infant for signs such as sweating or a hot chest | Smart thermostat with nursery zone | Adjust room conditions and clothing to the infant |
| Humidity | 40-60% RH | Humidifier/dehumidifier automation | Dry: congestion; Humid: mold risk |
| Light (sleep) | <1 lux (pitch dark) | Smart blackout blinds | Light disrupts melatonin production |
| Light (day) | Natural light cycle | Automated blind scheduling | Circadian rhythm development |
| Noise level | 50-60 dB white noise | Smart sound machine | Silence: easily startled; Loud: hearing risk |
16.10 Nursery Response Examples
| Condition Detected | Example Reading | Automated Response | Escalation Rule |
|---|---|---|---|
| Room too warm | 76°F | Start cooling and keep monitoring heart rate | Notify parent if vitals stay elevated after the room cools |
| Air too dry | 32% RH | Turn on humidifier | Notify parent only if dryness persists or congestion is detected |
| Sleep area too bright | 8 lux | Close blackout blinds | Notify parent if light remains above target |
| Noise too low for a startled infant | 42 dB | Start white-noise routine | Stop automatically once the infant settles |
Closed-loop principle: Fix the environment first, then escalate to parents only if the infant’s vitals remain abnormal after the automated correction.
16.11 Baby IoT Privacy
Building pediatric IoT devices involves unique challenges that don’t apply to adult wearables or industrial IoT:
16.11.1 Safety-First Design Constraints
| Constraint | Requirement | Engineering Impact |
|---|---|---|
| No small parts | No button batteries, no detachable components | Self-powered designs or rechargeable sealed units |
| Skin-safe materials | Hypoallergenic, BPA-free, medical-grade silicone | Material costs 3-5x higher than consumer electronics |
| Electromagnetic safety | SAR limits stricter for infants (thinner skull, developing brain) | Lower BLE transmit power, intermittent transmission |
| False alarm management | Too many false alarms erodes trust and causes parent anxiety | Multi-signal confirmation before alerting |
| Fail-safe behavior | Device failure must be obvious, not silent | Active heartbeat signal — absence means “check device” |
16.11.2 Privacy and Data Security
Baby monitoring data is among the most sensitive IoT data categories:
Figure 16.4 sorts what a baby monitor collects by how much harm its loss would do.
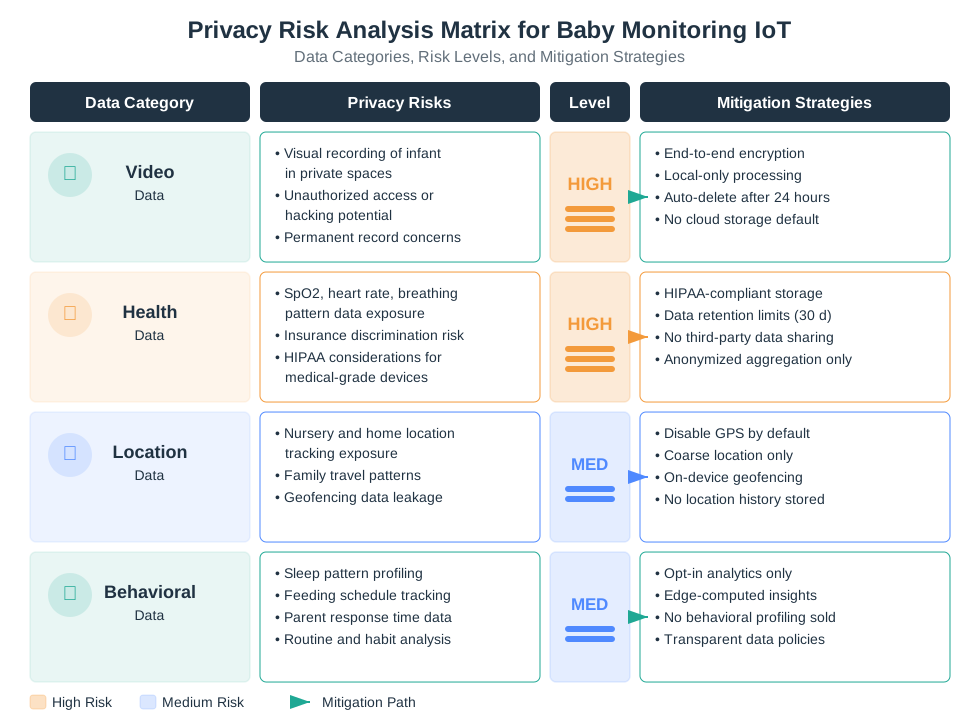
Read the risk column on the right of Figure 16.4 first, because it does the sorting. Two categories sit at the high mark: video of a child in a private room, and the health signals a device records minute by minute. Both are rated that way for the same reason. They are hard to take back once they leak, and they can follow a family for years. The two medium rows still matter, because where a home is and when a child sleeps are useful to the wrong reader. The cards along the foot are the answers, and each one is tied to a harm named above it. That is why the list below is not a general security checklist.
Privacy design best practices for baby monitors:
- End-to-end encryption: All video and health data encrypted in transit and at rest (AES-256 minimum)
- Local processing first: Edge AI for cry detection and anomaly analysis — avoid sending raw video to cloud
- Data retention limits: Auto-delete video after 24-48 hours unless parent explicitly saves
- No third-party sharing: Health data never sold to advertisers or insurance companies
- Parental control: Full data export and deletion controls; assess GDPR Article 15 access, Article 20 portability, and Article 17 erasure requests and exceptions where GDPR applies
16.12 Baby Monitoring System Comparison
Commercial Systems and Their Approaches:
| System | Monitoring Method | Key Sensors | Price Point | Accuracy Level |
|---|---|---|---|---|
| Owlet Smart Sock | Wearable on foot | PPG (SpO2, HR) | $299 | Consumer wellness |
| Snuza Hero | Clip-on to diaper | Accelerometer (breathing) | $99 | Consumer wellness |
| Miku Pro | Camera-based | AI motion analysis | $399 | Consumer wellness |
| Nanit | Camera + breathing band | Optical + accelerometer | $299 | Consumer wellness |
| Pampers Lumi | Smart diaper + camera | Moisture, activity | $349 | Consumer wellness |
Tradeoff Comparison:
| Factor | Wearable (Owlet) | Camera-Based (Miku) | Mattress Pad |
|---|---|---|---|
| Accuracy | Highest (direct contact) | Moderate (computer vision) | Moderate (indirect) |
| Comfort | Sock may be rejected | No wearable needed | No wearable needed |
| Maintenance | Charging daily | Always on | Pad replacement |
| Privacy | No video | Video recording concerns | No video |
| Cost | Higher | Higher | Lower |
| Portability | Works anywhere | Fixed camera position | Fixed to crib |
16.13 Knowledge Checks
16.14 Smart Diaper Energy Review
16.15 SpO2 Accuracy Review
16.16 Nursery Control Review
16.17 Wearable Protocol Review
16.18 Smart Diaper UTI Detection
Hypothetical scenario: A smart diaper team models an early-detection algorithm for 1,000 infants over six months. The scenario uses 82 UTI episodes confirmed by pediatric urinalysis to illustrate how episode-level sensitivity and alert-level predictive value would be calculated; it is not a report of an actual clinical trial.
Given:
- Total monitored infants: 1,000
- Total days monitored: 180 days (6 months)
- Actual UTI cases: 82 (confirmed by urinalysis)
- Algorithm flagged “UTI Risk” alerts: 103 cases
- True Positives (correct alerts): 71 cases
- False Positives (wrong alerts): 32 cases
- False Negatives (missed UTIs): 11 cases
- True negatives: Not available from the supplied episode and alert counts
Step 1: Calculate detection metrics
Total monitoring-days = 1,000 infants × 180 days = 180,000 monitoring-days.
- Sensitivity (episode-level): 71 / 82 = 86.6% of known UTI episodes detected.
- Positive predictive value (alert-level): 71 / 103 = 68.9% of alerts matched a known UTI episode.
- Specificity and false-positive rate per monitoring-day: Not calculable from the given counts; 82 UTI episodes do not specify the number of UTI-positive infant-days.
Step 2: Evaluate clinical value
For this illustrative model only, assume the smart diaper detects changes in pH, frequency, and temperature 48 hours before symptoms. This lead time has not been demonstrated and requires prospective clinical evidence.
Clinical timeline comparison:
| Event | Traditional Detection | Smart Diaper Detection | Time Advantage |
|---|---|---|---|
| UTI infection starts | Day 0 | Day 0 | — |
| Smart diaper alerts parent | — | Illustrative model assumption: Day 1-2 | Not clinically established |
| Parent notices symptoms | Day 3-5 (scenario assumption) | Day 1-2 (scenario assumption) | Assumed 2-4 days earlier |
| Pediatrician visit | Day 4-6 (scenario assumption) | Day 2-3 (scenario assumption) | Assumed 2-3 days earlier |
| Antibiotic treatment starts | Day 4-6 (scenario assumption) | Day 2-3 (scenario assumption) | Assumed 2-3 days earlier |
| Risk of pyelonephritis | Scenario assumption: 10-15% (delayed treatment) | Scenario assumption: 3-5% (early treatment) | Not a measured reduction |
Step 3: Cost-benefit analysis per prevented pyelonephritis
Pyelonephritis (kidney infection) occurs in 10-15% of untreated infant UTIs and requires:
- Hospitalization: 2-3 days @ $2,500/day = $6,250
- IV antibiotics: $800
- Long-term kidney damage risk: 10% of pyelonephritis cases
- Total cost per pyelonephritis case: ~$7,000
With smart diapers:
- 82 UTIs detected, 71 detected early (86.6%)
- Illustrative baseline: 82 × 12.5% = 10.25 expected pyelonephritis cases.
- If only the 71 alerted cases receive the assumed benefit: 71 × (12.5% − 4%) = 6.04 expected fewer cases; this is not an observed clinical result.
- Cost model: Apply any assumed per-case cost to the modeled difference, clearly labelled as an estimate.
Step 4: Evaluate false positive burden
32 false alerts among 1,000 infants over six months equals 0.032 alerts per infant over that period if each alert is counted once. The supplied counts do not establish daily specificity or a per-day false-alarm rate.
Step 5: Assess algorithm improvement opportunities
The 11 false negatives (missed UTIs) were analyzed:
- 6 cases: pH increase was below threshold (UTI caused by bacteria that don’t elevate pH)
- 3 cases: Parents changed diaper before full wetness detection
- 2 cases: Sensor malfunction (electrodes damaged)
Improvements:
- Lower pH threshold slightly (trade more false positives for fewer false negatives)
- Add nitrite sensor (bacterial metabolite) to catch pH-negative UTIs
- Improve sensor durability (better adhesive, waterproof coating)
Result: The smart diaper algorithm demonstrates:
- Modelled result, not demonstrated clinical benefit: The hypothetical counts give 86.6% episode detection; the modeled lead time and modeled reduction in pyelonephritis cases need prospective clinical evidence.
- Alert burden: 32 false alerts among 1,000 infants over six months in this hypothetical cohort.
- Cost estimate: Any savings comparison depends on the modeled clinical effect and assumed per-case cost.
Key Insight: In this hypothetical cohort, episode sensitivity is 86.6% and alert-level positive predictive value is 68.9%. These counts do not establish clinical benefit, daily specificity, or parent burden.
16.19 Tradeoff Analysis
16.20 Wearable vs Non-Contact
Option A — Wearable sensors (smart socks, chest bands):
- Highest accuracy for vital signs through direct skin contact
- PPG enables SpO2 and heart rate monitoring impossible without contact
- Risk: infant discomfort, sock rejection (especially in active infants), daily charging, potential skin irritation from prolonged wear
Option B — Non-contact monitoring (camera AI, mattress pads):
- Zero wearable discomfort — infant sleeps naturally
- No charging required (wall-powered devices)
- No skin contact issues — suitable for eczema-prone infants
- Risk: Lower accuracy for vital signs, sensitive to baby positioning, camera-based systems raise video privacy concerns
Decision factors:
| Factor | Favors Wearable | Favors Non-Contact |
|---|---|---|
| Premature infant | SpO2 accuracy critical | — |
| Healthy full-term | — | Minimal intervention preferred |
| Parent tech comfort | Higher maintenance OK | Set-and-forget preferred |
| Privacy concerns | No video data | Camera systems need careful setup |
| Multi-child nursery | Per-child sensor needed | One camera/pad covers crib |
| Travel use | Portable with infant | Fixed installation |
Bottom line: For premature or high-risk infants, wearable SpO2 monitoring provides the most clinically relevant data. For healthy full-term infants, non-contact options reduce intervention while still providing breathing and environment monitoring.
Those tradeoffs set up the final review: the same product can be technically accurate and still fail if privacy, maintenance, or false alarms break caregiver trust.
16.21 Common Pitfalls
16.22 Common Mistakes in Baby Monitoring IoT
Pitfall 1: Over-relying on consumer monitors for medical-grade decisions. Infant monitors marketed to measure SpO2 are medical devices in the US and require FDA authorization; even an authorized monitor does not prevent SIDS. A parent who delays seeking medical attention because “the monitor says oxygen is fine” may miss a serious symptom. Always consult a pediatrician for health concerns regardless of monitor readings.
Pitfall 2: Alert fatigue leading to disabled alerts. Systems with high false alarm rates (5-15% of nights for some devices) cause parents to silence or ignore alerts entirely. Good design requires multi-signal confirmation before alerting and clear escalation tiers (informational vs. urgent vs. critical).
Pitfall 3: Assuming “more sensors = better monitoring.” Adding sensors increases power consumption, data complexity, cost, and potential failure points. A well-calibrated single SpO2 sensor provides more safety value than a poorly integrated suite of 6 sensors. Design for the minimum sensor set that addresses the primary safety concern.
Pitfall 4: Ignoring the “parent workflow” integration. A monitor that requires complex setup, frequent charging, or app-switching will be abandoned within weeks. Successful products (Owlet, Nanit) integrate seamlessly into existing bedtime routines with minimal additional steps.
16.23 Baby IoT Links
| Concept | Relates To | Relationship |
|---|---|---|
| PPG Breathing Monitoring | Optical Sensing | Red/IR LED photoplethysmography measures SpO2 through skin with +/-3% consumer accuracy vs +/-2% medical-grade |
| Closed-Loop Control | Real-Time Systems | Sense-analyze-act cycle requires <5 sec latency for critical alerts, <30 sec for environmental adjustments |
| Self-Powered Smart Diapers | Energy Harvesting | Biofuel cells harvest ~0.5V from urine, eliminating battery safety risks for disposable wearables |
| UTI Early Detection | Multi-Sensor Fusion | pH + frequency + temperature + nitrite pattern analysis may flag episodes; lead time needs prospective validation |
Cross-module connection: Optical Sensors explains photoplethysmography (PPG) sensor design, red/IR LED wavelength selection (660nm/940nm), and photodiode signal processing for SpO2 and heart rate measurement.
16.24 Interactive Quiz: Match Concepts
16.25 Interactive Quiz: Sequence the Steps
16.26 Label the Diagram
16.27 Code Challenge
16.28 Summary
Baby monitoring and infant care IoT applications demonstrate the most safety-critical category of consumer healthcare IoT. The key principles extend to any application where IoT augments human caregiving:
| Concept | Key Takeaway |
|---|---|
| Closed-loop architecture | Sense-analyze-act cycle with latency requirements: <5 sec for critical alerts, <30 sec for environmental adjustments |
| PPG breathing monitoring | Red/IR LED light through skin measures SpO2; consumer accuracy +/- 3% vs. medical +/- 2% |
| Self-powered smart diapers | Biofuel cells harvest ~0.5V from urine; eliminates battery safety risks for disposable integration |
| UTI early detection | Multi-sensor pattern analysis (pH + frequency + temperature + nitrite) may flag episodes; lead time needs prospective validation |
| Environmental control | Avoid overheating; dress the infant for room conditions and check for signs such as sweating or a hot chest. |
| Infant vital-sign monitors | Check FDA authorization and intended use; no monitor is authorized to prevent SIDS. |
| Privacy by design | End-to-end encryption, local processing, auto-delete, no third-party data sharing |
| False alarm management | Multi-signal confirmation prevents alert fatigue that leads to disabled monitoring |
Design principle: In pediatric IoT, the best technology is the technology parents will actually use consistently. Simplicity, reliability, and trust matter more than feature count.
16.29 See Also
- Optical Sensors — Photoplethysmography (PPG) sensor design for SpO2 and heart rate monitoring with red/IR LED specifications
- Wearable Sensor Design — Power management, form factor, and skin contact considerations for infant wearables
- Real-Time Systems — Meeting <5 second latency requirements for safety-critical alert processing
- Healthcare IoT Privacy — Health-data privacy scope, encryption choices, and data retention for consumer devices; HIPAA applies only in covered contexts
16.30 In 60 Seconds
This chapter explores real-world IoT applications in baby monitoring, illustrating how sensor data, connectivity, and analytics combine to address specific human needs and operational challenges.
16.31 What’s Next
| If you want to… | Read this |
|---|---|
| Explore application domains for this technology | Application Domains Overview |
| Learn about UX design for connected devices | UX Design for IoT |
| Start prototyping with the concepts covered | Prototyping Essentials |