12 Fall Detection: Alert Reliability
More
Depth: Practitioner
Progress saves as you read. Mark sections complete as you go; your progress appears in the sidebar.
- Podcast audio coming soon
- Character narration audio coming soon
12.1 Make the Alert a Care Workflow
Fall detection is useful only if evidence of a possible fall leads to an appropriate response. This second chapter builds on Fall Detection: Motion Thresholds: the decision now is how to turn a sensor event into a cancellable, traceable alert without exhausting caregivers.
Imagine your grandma lives alone and slips on her kitchen floor while wearing a smartwatch. An accelerometer registers the jolt, a gyroscope notices a change from upright to lying flat in less than one second, and a heart rate monitor detects an elevated heart rate after impact. These signals support a candidate fall. The watch asks, “Are you OK?” and gives her 30 seconds to cancel. If she cannot respond, her daughter needs an alert and a defined escalation path.
Carry that home situation into the chapter’s service scenario: a home healthcare provider supporting 500 independently living patients aged 65–85, 30% with mild cognitive impairment. Its exercise target is emergency medical services (EMS) arrival within 15 minutes of a fall. That is a planning assumption to confirm with local clinical and EMS requirements. The problem is to fit sensing, communication and human response inside that window while keeping harmless movements from overwhelming the service. We will combine sensor evidence, record alert states, budget time and calculate daily workload.
KEY CONCEPTS
- Sensor evidence
Combine impact, orientation and context before declaring a candidate fall.
- Alert state
Record cancellation, acknowledgement, escalation and resolution separately.
- Response budget
Reserve time for detection, notification, caregiver review and EMS travel.
- Alert burden
Count false alerts against the service’s daily response capacity.
12.2 Learning Objectives
- Test reliability needs event context with a concrete scenario and pass criteria.
- Validate alert fatigue analysis with a concrete scenario and pass criteria.
12.3 Establish What the Sensors Can Support
The scale of the problem explains why both missed falls and unnecessary escalation matter. CDC reports that over 14 million US adults aged 65+—about one in four—report a fall each year (CDC fall data). The National Council on Aging figure cited here is an ER visit from a fall every 11 seconds. CDC reported 38,742 fall deaths among US adults aged 65+ in 2021, about one every 14 minutes.
Keep years attached to estimates: CDC estimated 2.8 million emergency-department treatments for older-adult falls in 2014 (CDC, 2014 data). The chapter’s hospitalization estimate is 800,000+ per year, often leading to long-term care. A CDC-authored study estimated about $50.0 billion in US medical costs attributable to older-adult falls in 2015 (2015 cost study); Medicare and Medicaid paid about $37.6 billion, or 75% (Medicare and Medicaid share). One hip fracture can cost $40,000+ in medical care and lead to permanent loss of independence. Avoiding one such injury can pay for years of monitoring, although detection itself does not prevent the fall.
A sensor-fusion system combines evidence from several sensors. Wearable accelerometers and gyroscopes can be corroborated by ambient sensors. Figure 1 follows that evidence into a timed cancellation and escalation path.
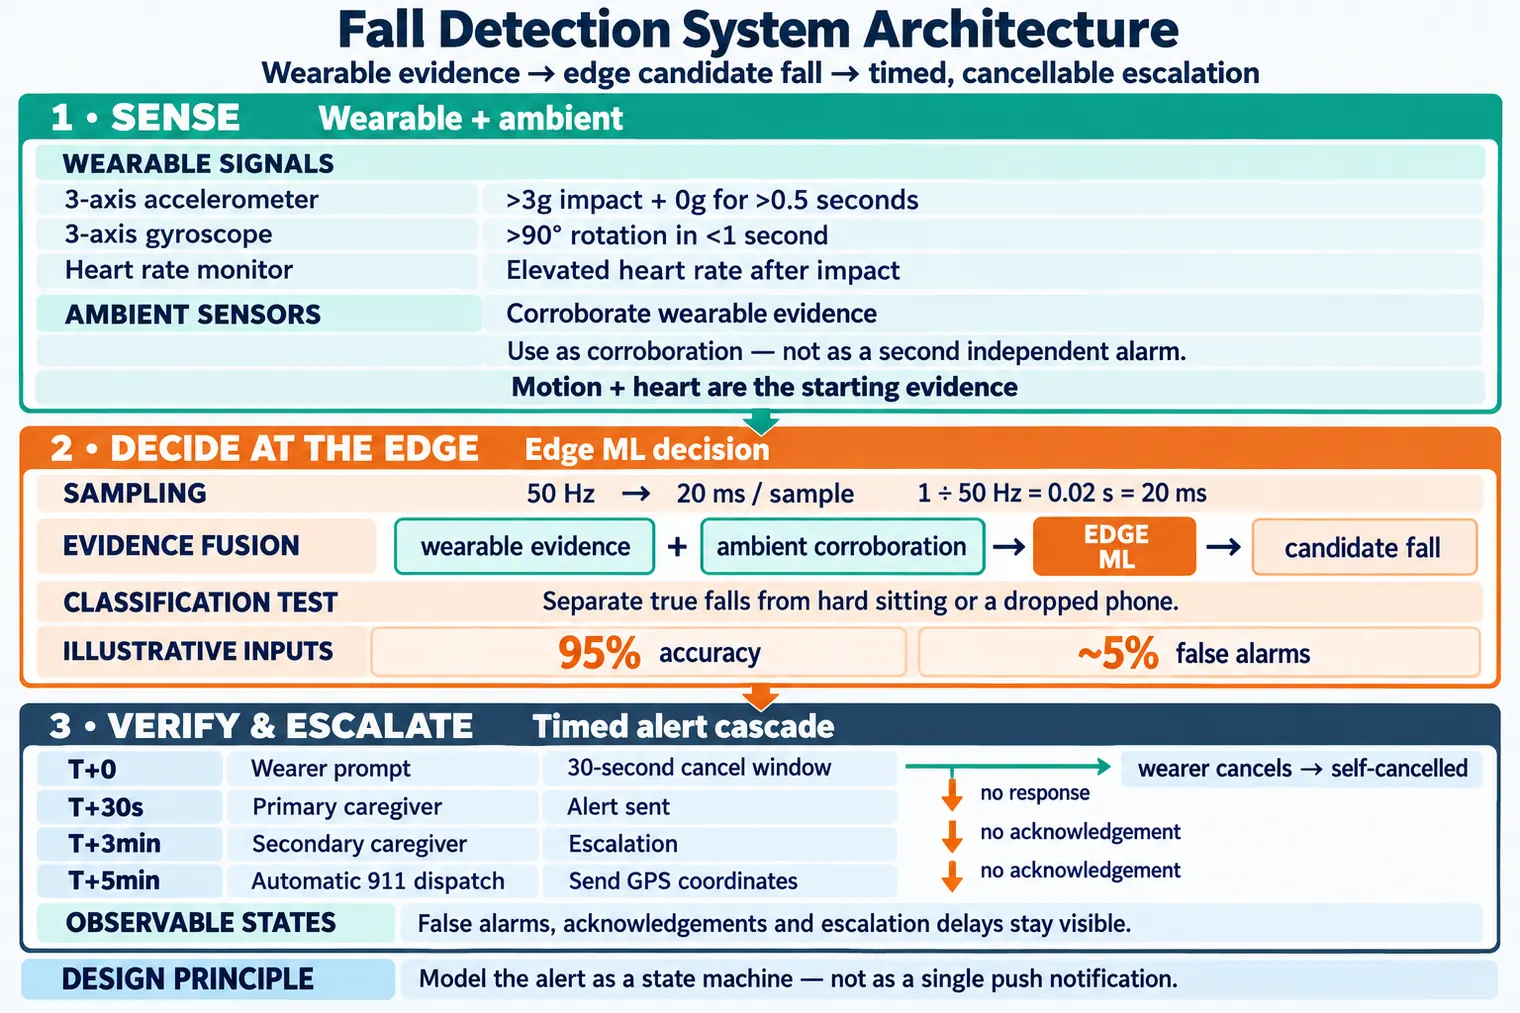
The edge model samples acceleration and rotation at 50 Hz: one sample every 1 ÷ 50 seconds, or 20 ms. Edge inference means running the model near the sensors rather than depending on cloud analysis. The chapter’s illustrative signatures are an impact above 3g plus 0g free-fall for more than 0.5 seconds, and more than 90 degrees of rotation in under 1 second. Sitting down under 2g and fast walking should be distinguished from a fall; gradual lying down and bending over should also be distinguished from rapid rotation.
A pressure sensor adds evidence of sudden floor contact while distinguishing walking and standing. Heart-rate evidence can corroborate stress after impact, but exercise and normal activity also change heart rate. GPS or indoor location supplies the fall location for response dispatch; routine movement tracking is a different purpose. None of these signals alone proves that grandma needs emergency help.
The model learns from thousands of labeled examples to separate falls from hard sitting, a dropped phone or bending to pet a cat. Treat “95% accuracy” and “5% false-positive rate” as illustration inputs unless tied to an evaluated device, protocol and dataset. Philips Lifeline and Apple Watch are real-world examples of fall-alert products helping seniors at home; the exact timing and emergency behavior in this chapter belong to the exercise, rather than a promise about either product. Compare this care workflow with other deployment contexts in the applications module index.
12.4 Design Out Four Failure Modes
Sensor evidence becomes useful when the deployment handles its limitations. First, an accelerometer alone can miss a fall where someone catches themselves on furniture: impact may be low even when injury risk is high. Combine accelerometer and gyroscope evidence at minimum in this design rather than treating impact as the whole decision.
Second, a frail 85-year-old and an active 68-year-old have different gait dynamics. A fixed 3g threshold can produce excessive false positives for an active senior and miss gentle falls for a frail person. The chapter proposes a 2-week personalization period to learn the patient’s baseline. Test the resulting behavior against the movements and falls the service needs to distinguish.
Third, a false positive is a non-fall classified as a fall. A 5% false-positive rate across 10,000 non-fall events per day produces 500 false alarms in the 500-patient service. Repeated nuisance alerts can desensitize caregivers. Test wearer cancellation and staged escalation before rollout, while preserving a response path for real falls.
Fourth, detection is only the start. Continue monitoring heart rate, movement and orientation after a fall so responders can review evidence of secondary events such as loss of consciousness or seizure. Post-fall information belongs with the event and its resolution rather than disappearing after the first notification.
Figure 2 connects those design choices to a deployment. Its evidence path uses a wearable, a LoRaWAN gateway that forwards events and cloud analysis before anyone is alerted. Its response path then gives the wearer 30 seconds, contacts a primary caregiver, reaches a secondary caregiver at three minutes and reaches emergency dispatch at five minutes. Escalation stops when someone acknowledges; that acknowledgement must still lead to a recorded resolution.

LoRaWAN is attractive here for long range—a single gateway may cover a nursing home or neighborhood—and penetration through walls and floors. Those coverage expectations need deployment testing. It avoids cellular subscription fees on that radio link. Low power is a design goal, but battery life depends on radio duty cycle, sensing and charging; use a device-specific measured range when available. The later latency exercise instead uses BLE to a smartphone gateway with cellular backup, so its timing assumptions should not be silently assigned to this LoRaWAN path.
12.5 Record the Event Through Resolution
The deployment needs a shared record of what happened. A state machine represents an alert as named states with explicit transitions. Candidate fall, wearer prompt, self-cancelled, caregiver notified, caregiver acknowledged, monitoring-center escalated, emergency dispatched, resolved and device-offline are separate states. A single push-notification log cannot explain which of these occurred.
Record a timestamp, actor, channel, confidence score, location quality, retry policy and logged reason for each transition. That makes audits, incident review, reimbursement evidence and threshold tuning possible. Device, care and privacy context explain why a transition was delayed or why a particular person was contacted.
Firmware samples an inertial measurement unit (IMU), applies filters, detects impact and orientation changes, and stores a short pre/post-event window. Device state includes sampling rate, calibration, battery, firmware version, worn/not-worn state, clock source, connectivity, location quality and last successful heartbeat. Edge inference reduces cloud dependency and can protect privacy, but needs safe fallback when memory, power, GPS, Wi-Fi, BLE, LTE or the gateway link degrades.
Alert state includes candidate event ID, confidence, cancel window, contacts attempted, acknowledgement, escalation, resolution, timeout reason and post-event notes. A fall record may also need device identifier, user profile, consent version, sensor summary, pre-event motion, post-event inactivity and location estimate.
Care state includes the care scenario, emergency contacts, preferred response path, accessibility needs, monitoring schedule and device-support responsibilities. HL7 FHIR Observations, Device resources or CarePlan context may help if clinical software has a real workflow consuming them. Otherwise, a simpler caregiver record may be safer and more usable.
Privacy state includes consent, access role, retention period, location precision, sharing scope, family delegation and deletion or correction requests. Dashboards, clinical integrations and monitoring-center queues should expose continuous life patterns only when the care plan requires them. Use role-based access, event-level sharing, retention limits, encryption at rest and in transit, device-replacement records, consent versioning, data export, correction and deletion workflows. These records keep the service supportable when family, provider, payer or residence changes.
12.6 Work Backward From EMS Arrival
With the evidence and states defined, allocate time to the transitions. The 500-patient exercise assumes a 50 Hz accelerometer and gyroscope, a 100 MIPS microcontroller, BLE to a smartphone gateway and cellular backup. Determine Food and Drug Administration (FDA) device class and premarket pathway from the product’s intended use and product code; fall detection alone does not establish Class II 510(k) status. Likewise, derive the false-positive-rate target from a maximum daily alert burden and the expected number of non-fall decisions.
Start with 15 minutes, or 900 seconds, from fall to EMS arrival. Subtract the assumed average 8-minute EMS journey: 420 seconds remain for detection, notification, wearer cancellation and caregiver response. A longer journey leaves less time for those earlier stages.
The fall event lasts 0.5–2 seconds, and edge machine-learning inference requires 50–100 ms. The example allows 5 seconds for confirmation to distinguish the event from sitting down quickly, then uses 100 ms inference for a total detection allowance of 5.1 seconds. Treat confirmation as including observation of the event; adding the event duration again would change this budget.
The notification chain has five components: BLE to the gateway, 100 ms; gateway processing, 200 ms; cellular transmission to the cloud, 500 ms; cloud alert generation, 300 ms; and push notification to the caregiver app, 1 second. These total 2.1 seconds. Detection plus notification is therefore 7.2 seconds, leaving 420 − 5.1 − 2.1 = 412.8 seconds, or 6.9 minutes, for wearer cancellation and graduated caregiver response before dispatch.
For this exercise, aim to retain at least 5 minutes for that graduated response. A window below 3 minutes forces more aggressive automatic 911 escalation and increases the impact of false alarms. These are workflow assumptions to test against the service’s requirements. The separate calculator lets you change the response target, EMS journey and machine delays together.
12.7 Turn the Budget Into an Alert Cascade
The remaining window now needs product behavior. At T+0, prompt the wearer with an “I’m OK” button and allow 30 seconds to cancel a false alarm. At T+30 seconds without cancellation, notify the primary caregiver through push notification and SMS. At T+3 minutes without acknowledgement, notify a secondary caregiver. At T+5 minutes without human response, the exercise calls for automatic 911 dispatch with GPS coordinates and patient medical history.
Use one explicit clock origin when implementing this cascade. If T+0 is the fall itself, five-minute dispatch plus eight-minute EMS travel gives arrival at T+13, leaving two minutes for uncertainty. The calculator conservatively adds the 7.2-second machine allowance before the five-minute cascade: arrival is 13 minutes 7.2 seconds, with a 1.88-minute margin, rounded to 1.9 minutes. Both fit the 15-minute exercise target, but confusing those clock origins hides delay.
Wearer cancellation sits ahead of caregiver alerts so harmless hard sitting or a dropped device can be filtered before consuming response capacity. It cannot guarantee that every false alarm disappears. The proposed pilot assumptions are that wearer cancellation removes about 50% of false positives, and that primary caregiver response takes 2–3 minutes and handles about 40% of real falls. Measure those assumptions; the fraction of true falls reaching EMS remains unknown until cancellation and caregiver response are measured among confirmed falls.
The design gives the wearer control first, then family, then medical professionals. It balances rapid escalation with the risk that repeated false alarms lead people to abandon the service. Recording each contact, timeout and acknowledgement lets the provider test whether that balance holds for patients with accessibility needs or mild cognitive impairment.
12.8 Count the Workload Behind the Alerts
A cascade that fits the clock can still overwhelm caregivers. Sensitivity is the fraction of real falls detected; specificity is the fraction of non-falls correctly rejected. In the calculator’s 500-patient example, assume 2 real falls and 10,000 non-fall decisions per day, with both sensitivity and specificity at 95%.
Those inputs yield 1.9 true alerts, 0.1 missed falls and 500 false alerts per day: 501.9 alerts in total, or about one per patient. Patient count does not tell us alerts per caregiver without staffing information. The ratio is about 263 false alerts for every true alert. This is the base-rate problem: rare falls compete with a much larger number of harmless events.
Positive predictive value (PPV) is true alerts divided by all alerts. Here it is 1.9 ÷ 501.9, about 0.38%; about 99.62% of alerts are false. PPV above 10% means more than one in ten alerts is a true fall; only PPV above 50% means most alerts are true falls. For these particular inputs, exceeding 10% PPV requires specificity above about 99.83%. That threshold comes from arithmetic rather than a universal claim about sensor fusion.
The separate analysis varies population, real falls, non-fall decisions, sensitivity and specificity. Compare total daily alerts, detected and missed falls, false-alarm share, PPV and the false-to-true ratio with service capacity. Use that evidence to test multi-sensor fusion, personalized thresholds and wearer cancellation while monitoring missed falls as well as workload.
12.9 Summary
A reliable fall-alert service combines sensor evidence with a recorded care workflow. The wearer’s cancellation, caregiver acknowledgement, escalation and resolution each need their own state and context. Privacy and device-support records make those decisions reviewable when the care arrangement changes.
In the 500-patient exercise, 5.1 seconds of detection and 2.1 seconds of notification leave 412.8 seconds before dispatch must begin under the assumed arrival target. That timing only works if the cascade and EMS journey fit the same clock. Daily false-alert counts then test whether caregivers can sustain the response.
Judge fall-alert reliability by evidence, time to help and daily response workload. A detected fall still needs a cancellable, traceable path to appropriate care.
Carry these response and workload assumptions into Elderly Care IoT: Monitoring, Economics, and Autonomy.
