13 Hardware Optimization Strategies
Acceleration, Memory Paths, Power Domains, and Platform Selection
13.1 Start With the Block That Burns Energy
A hardware optimization is useful only when it reduces the part of the workload that dominates the budget. An accelerator, buck regulator, DMA path, or peripheral choice can save energy, but it can also add idle loss and integration cost.
Begin with the measured bottleneck, then choose hardware that reduces active time, transfer cost, or wasted conversion in the dominant regime.

Phoebe’s Why
Every digital signal that flips has to charge or discharge a real capacitance – gate capacitance, wire capacitance – and moving that charge costs energy that scales with how often it happens. That is the physics behind the datasheet spec this chapter’s clock-gating advice quietly depends on: a “current per MHz” number is not a marketing shorthand, it is a direct measurement of the chip’s effective switched capacitance. Reading that number as physics rather than a lookup value is what turns “disable clocks for unused peripherals” and dynamic voltage-frequency scaling (DVFS) from folklore into arithmetic – and it explains why dropping the voltage alongside the frequency saves far more than slowing the clock alone.
The Derivation
Charge moved by one switching transition:
\[Q = CV\]
Energy dissipated per full charge-discharge cycle of that node:
\[E = CV^2\]
Dynamic power for a clock toggling the node at frequency \(f\) (activity factor \(\alpha\); \(\alpha=1\) for a fully-toggling node):
\[P_{dynamic} = \alpha\,C\,V^2\,f\]
Since \(P=IV\), a “current per clock frequency” datasheet spec is \(CV\) in disguise:
\[\frac{I}{f} = C\,V \quad\Rightarrow\quad C = \frac{I/f}{V}\]
Worked Numbers: Reading A Typical MCU Spec
- Recovering the capacitance: a catalog-typical low-power core spec of \(50\,\mu\)A/MHz at \(V=1.8\) V gives \(C=\dfrac{50\times10^{-6}/10^{6}}{1.8}=27.8\) pF of effective switched capacitance – a plausible order of magnitude for a small MCU core.
- Power at full clock: at 48 MHz, \(I=50\,\mu\text{A/MHz}\times48=2400\,\mu\)A, so \(P=2400\,\mu\text{A}\times1.8\text{ V}=4.32\) mW.
- Frequency scaling alone: halving the clock to 24 MHz at the same 1.8 V halves the current to \(1200\,\mu\)A, giving \(P=2.16\) mW – exactly the 50.0% saving \(P\propto f\) predicts.
- DVFS, frequency and voltage together: if 24 MHz also permits dropping the rail to 1.2 V, \(P=C V^2 f\) scales by \((24/48)\times(1.2/1.8)^2=0.222\), giving \(P=0.960\) mW – a 77.8% saving, far beyond the 50.0% that frequency scaling alone bought. The \(V^2\) term is why voltage headroom is worth more than clock headroom.
- Why clock gating works at all: gating an unused peripheral’s clock sets its \(f\) to zero in this same formula, not just “pausing” it – it stops the charge movement entirely, so that block’s contribution to \(P_{dynamic}\) becomes exactly zero rather than merely small.
13.2 Hardware Optimization Strategies
Hardware optimization is not only “choose a faster chip.” In IoT systems, it usually means matching each workload to the cheapest safe hardware path that meets timing, energy, memory, and reliability constraints.
Good hardware optimization often happens before a board is finalized:
- choose a processor family with enough sleep modes, wake sources, and peripheral support
- offload repeated transfers to timers, DMA, or communication engines
- reduce memory movement with better buffering and data layout
- select an accelerator only when the algorithm is stable and the measurement justifies it
- define power domains so unused parts can be switched off
13.3 Learning Objectives
By the end of this chapter, you will be able to:
- Compare general-purpose processors, hardware peripherals, DSP-style blocks, reconfigurable logic, and custom silicon.
- Explain why data movement and memory bandwidth can dominate hardware optimization.
- Use selection gates for acceleration, power domains, clocks, and platform changes.
- Identify when a hardware change is premature or too risky.
- Build validation evidence for before/after hardware optimization decisions.
- Hardware acceleration only helps when it targets a measured bottleneck.
- Moving data can cost more than computing on it.
- A peripheral that lets the CPU sleep may save more energy than a faster CPU.
- Reconfigurable or custom hardware trades flexibility for specialization.
- Hardware choices must be validated with the real workload, not peak datasheet numbers.
13.4 Hardware Choices As A Spectrum
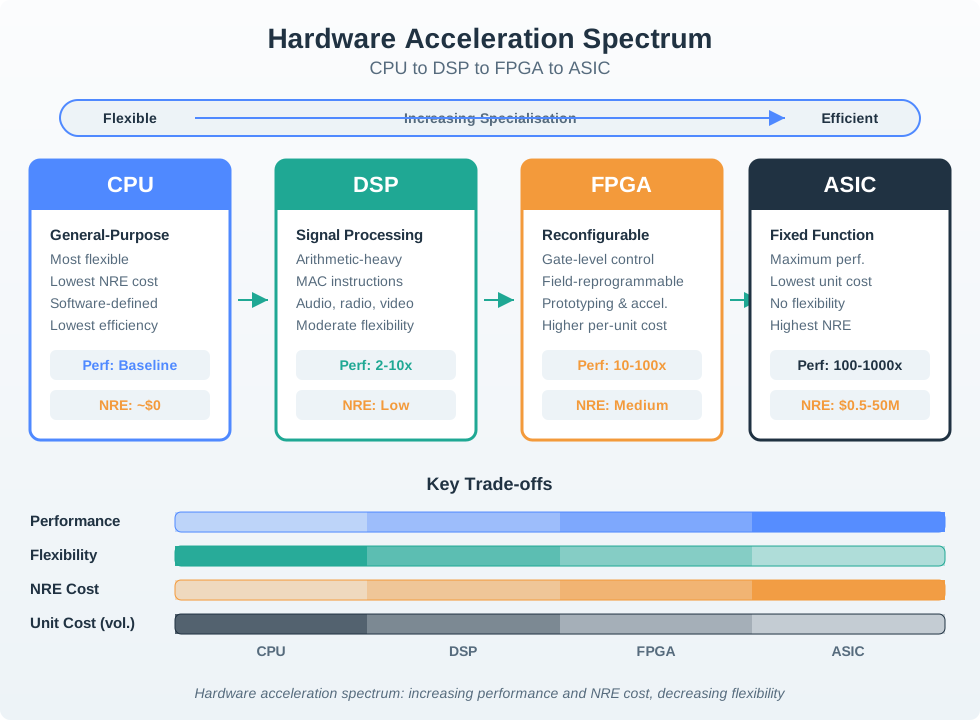
Hardware options form a spectrum from flexible software control to highly specialized circuits.
13.5 Selection Gates
Use gates before moving from software or peripheral offload to a specialized hardware path.
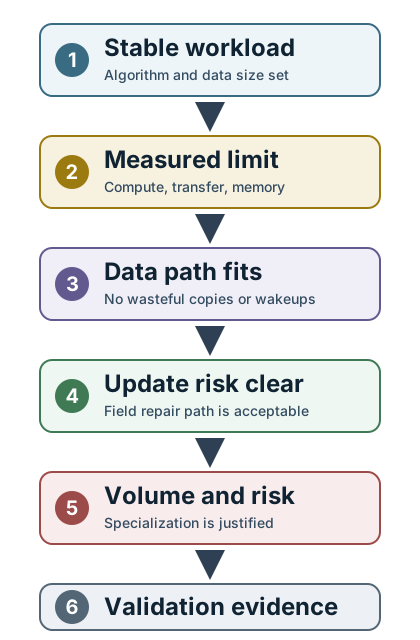
Workload stability The algorithm, data size, and accuracy target should be stable before hardware is specialized.
Measured bottleneck The proposed hardware must target the measured limiter: compute, transfer, memory, sleep, wake, or radio behavior.
Data movement Check whether the data path can feed the accelerator without keeping the CPU awake or copying buffers repeatedly.
Update risk If field behavior is still changing, keep enough software or reconfigurable flexibility to repair mistakes.
13.6 Data Movement And Memory
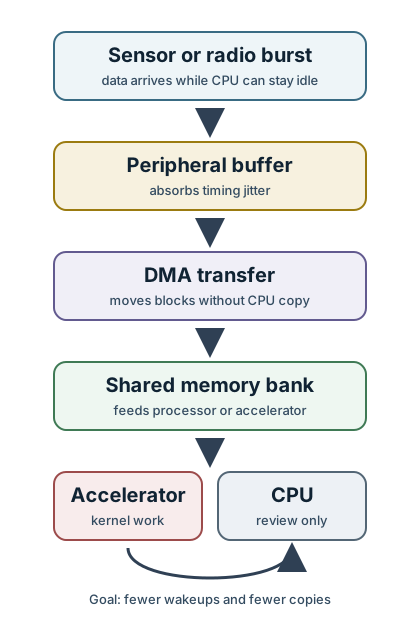
Many hardware optimization failures happen because the compute block is faster, but data cannot reach it efficiently. A fast accelerator that requires repeated copies, cache flushes, wakeups, or polling can lose the energy benefit.
13.6.1 Buffer Placement
Place buffers where the peripheral, DMA engine, and processing block can access them without extra copies.
13.6.2 Transfer Granularity
Use block transfers when latency allows. Many tiny interrupts keep the CPU awake and can erase the benefit of offload.
13.6.3 Memory Bandwidth
If the workload streams data, memory bandwidth and bus contention can be the real limit.
13.6.4 Wake Discipline
The hardware path should reduce wakeups or shorten active windows. If it adds wake complexity, remeasure the full cycle.
13.7 Power Domains, Clocks, And Peripherals
Hardware optimization also includes turning hardware off correctly.
13.8 Worked Review: Streaming Sensor Node
Suppose a sensor node collects short bursts of high-rate samples and then sends a compact event summary. A software-only prototype works, but the energy trace shows the CPU stays awake while it copies samples and waits for transfers.
The first hardware optimization is not a new processor. It is the data path: use peripheral buffering and DMA so the CPU can sleep during transfer. After that, remeasure. If compute remains dominant, evaluate an accelerator with reference vectors and memory-bandwidth evidence.
13.9 Review Checklist
Before accepting a hardware optimization:
- The workload and target requirement are stable enough for the chosen hardware path.
- The baseline includes timing, current, memory movement, wake behavior, and error cases.
- The proposed hardware targets a measured bottleneck.
- Data movement into and out of the hardware path is included in the measurement.
- Power-domain and clock-state transitions are tested.
- Correctness is checked with reference vectors, boundary cases, and long-run stress.
- The update and rollback story is clear.
- The final evidence uses the real duty cycle, not only a kernel benchmark.
13.10 Check Your Understanding
13.11 Check Your Understanding: Offload First
13.12 Check Your Understanding: Specialization Risk
13.13 Match Hardware Item To Purpose
13.14 Order The Hardware Optimization Process
13.15 Label The Hardware Optimization Record
13.16 How You Make The Rail Decides How Much You Waste
Every battery device converts the cell voltage into the rails its chips need, and the converter you choose can quietly waste a large fraction of the energy. A low-dropout linear regulator (LDO) is simple and quiet, but its efficiency is roughly the ratio of output to input voltage: eta = Vout / Vin. It passes the full load current through from the battery and burns the leftover voltage as heat. A switching buck converter instead trades excess voltage for extra current, reaching about 85-95% efficiency almost regardless of the voltage gap.
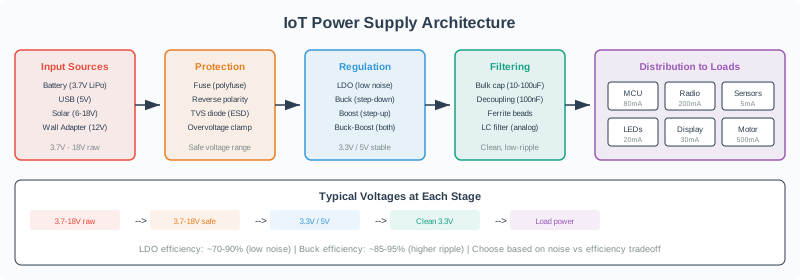
The consequence is that an LDO draws the same current from the battery as the load draws, no matter how much voltage it is dropping, while a buck draws less battery current than the load whenever the input voltage is above the output. The wider the gap between battery voltage and rail voltage, the more a linear regulator wastes and the more a switcher saves.
Scale the loss over time before dismissing it. If the 100 mA rail is active for 5 minutes each hour, it runs 2 hours per day. The LDO waste is 90 mW x 2 h = 180 mWh per day. The 90% buck loses 37 mW x 2 h = 74 mWh per day. The difference, 106 mWh, is about 29 mAh from a 3.7 V cell each day, large enough to change the battery-size decision.
Intuition only: an LDO's wasted power is the voltage it drops times the load current. If that drop is large and the current is high, a buck converter that turns the drop into useful current can save a real slice of the battery.
The Regulator Choices
LDO
Efficiency about Vout/Vin; battery current equals load current; quiet and tiny; excellent low quiescent options.
Buck
Step-down switcher near 85-95%; draws less battery current than the load when Vin exceeds Vout.
Boost / buck-boost
Step up a low cell, or hold a rail as a Li-ion crosses it from above to below during discharge.
Accelerators
A hardware crypto or DSP block finishes work in fewer cycles and returns to sleep sooner, saving energy.
Overview Knowledge Check
13.17 An LDO Passes The Load Current; A Buck Reduces It
Compare regulators by the battery current they draw, not just efficiency. For an LDO, I_battery = I_load. For a buck, I_battery = P_load / (Vin x eta), which falls below the load current when Vin exceeds Vout.
Worked Example: 100 mA At 3.3 V From A Full Li-ion (4.2 V)
The load delivers 330 mW at 3.3 V. Compare an LDO with a 90% buck.
- LDO: battery current = 100 mA; battery power = 4.2 V x 100 mA = 420 mW; efficiency 3.3/4.2 = 79%; 90 mW wasted as heat.
- Buck at 90%: battery power = 330 mW / 0.90 = 367 mW; battery current = 367 mW / 4.2 V = 87 mA; 37 mW lost.
- Result: the buck draws 87 mA versus the LDO's 100 mA, about 13% less battery current during this high-current phase, and the advantage grows as the battery sits higher above 3.3 V.
From a nearly empty 3.7 V cell the gap narrows: the LDO reaches 3.3/3.7 = 89%, almost matching the buck. So the buck's win is largest exactly when the battery is full and the voltage gap is widest.
That comparison also explains why "90% efficient" is not enough by itself. At 4.2 V, the buck input current is 367 mW / 4.2 V = 87 mA. At 3.7 V, the same 367 mW input power requires 99 mA, almost the LDO's 100 mA. A battery-life estimate should therefore integrate the regulator choice across the discharge curve, or at least test full, nominal, and low-battery cases instead of using one current number.
Regulator Comparison Ledger
Practitioner Knowledge Check
13.18 Efficiency Is Load-Dependent, So Pick For The Dominant Regime
Regulator efficiency is not one number; it changes with load. A buck is excellent at the high currents of a radio burst, but at the microamp currents of sleep its own controller quiescent current can dwarf the load. Suppose a buck controller draws 15 uA of quiescent current and the sleep load is 10 uA. The regulator now consumes 25 uA to deliver 10 uA - an effective efficiency near 40%. A low-quiescent LDO drawing 1 uA delivers the same 10 uA at 11 uA total, about 91% effective. At light load the simple LDO wins decisively.
Over one day, that sleep choice alone is visible. A 25 uA buck-fed sleep rail for 23.76 hours consumes about 594 uAh. An 11 uA low-Iq LDO sleep rail consumes about 261 uAh over the same interval, saving roughly 333 uAh per day. If the product reports rarely, that sleep-rail saving can be larger than the active burst optimization; if it reports constantly, the high-current buck path may dominate instead.
This matters because a duty-cycled device spends almost all of its time asleep, so the sleep regulator, not the active one, often dominates the energy budget. A common mistake is to select a single high-efficiency buck for the radio peak and then pay its quiescent current through months of sleep. The better designs pick the regulator for the regime that dominates the energy: a buck for the high-current active phase, and a low-quiescent LDO or a converter with a light-load pulse-frequency mode for the long sleep. The same finish-and-sleep logic explains hardware accelerators: a crypto or DSP block that completes an operation in far fewer cycles than the CPU lets the whole system return to that low-power sleep sooner, so the accelerator is an energy win even when its instantaneous power is higher.
Choosing By Regime
Heavy load
A buck's flat high efficiency and lower battery current win the radio and compute bursts.
Light load
At microamp sleep currents a switcher's quiescent current can exceed the load; a low-Iq LDO wins.
Weight by time
Since the device mostly sleeps, the sleep regulator often dominates the battery budget.
Accelerate to sleep
A hardware block that finishes in fewer cycles returns the system to sleep sooner, saving energy.
Under-the-Hood Knowledge Check
13.19 Summary
Hardware optimization is evidence-led platform design:
- Start with the measured workload and target requirement.
- Identify whether the limiter is compute, data movement, memory, wake behavior, or background power.
- Prefer the least specialized hardware path that can move the bottleneck.
- Treat peripherals, DMA, clock gating, and power domains as first-class optimization levers.
- Specialize hardware only when workload stability, volume, risk, and validation evidence support it.
- Remeasure the whole device after every hardware change.
Common Pitfalls
Peak benchmark numbers can hide data movement, sleep-state behavior, and peripheral limits. Test the real workload.
An accelerator that waits for copied buffers or frequent interrupts may not improve total energy.
Custom or reconfigurable hardware is risky when the algorithm, data size, or field behavior is still changing.
Clock and power gating can break wake behavior, first samples, calibration, and fault recovery unless those paths are tested.
13.20 What’s Next
13.20.1 Tune Firmware
Software Optimization Techniques covers compiler settings, data layout, scheduling, and memory-aware firmware.
13.20.2 Use Fixed-Point Carefully
Fixed-Point Arithmetic explains Q-format choices, scaling, saturation, and validation evidence.
13.20.3 Review The Fundamentals
Optimization Fundamentals explains targets, bottlenecks, trade-off ledgers, and optimization records.
13.20.4 Measure The Result
Energy Measurement and Profiling shows how to collect the current trace that proves a hardware change helped.
13.21 Key Takeaway
Hardware optimization means selecting the MCU, peripherals, sensors, radios, accelerators, and power domains that match the workload. Idle leakage and wake cost can matter as much as peak speed.