Picture walking through a city, clinic, farm, factory, store, and home with the same sensor kit in your bag. The lesson is that the domain changes the story: the same connected capability earns trust only when it matches the users, constraints, regulations, and failure consequences of that setting.
Chapter Roadmap
First, treat application domains as operating contexts rather than market labels.
Then, compare the Five Pillars, taxonomy buckets, and requirement profiles that separate one domain from another.
Next, use the calculators and routing guide to connect requirements to technology choices.
Finally, test the deployment pattern against measurable pain points, quizzes, and recovery pitfalls.
Checkpoints mark places to pause and consolidate; deep-dive material is for audit, verification, or optional detail after the main path is clear.
11.2 Application Domains
Key Concepts
IoT Architecture: Layered model comprising perception, network, and application tiers defining how sensors, gateways, and cloud services interact.
Edge Computing: Processing data close to the sensor source to reduce latency, bandwidth costs, and cloud dependency.
Telemetry: Time-stamped sensor readings transmitted from a device to a cloud or edge platform for storage, analysis, and visualisation.
Protocol Stack: Set of communication protocols layered from physical radio to application message format that devices must implement to interoperate.
Device Lifecycle: Stages from manufacture through provisioning, operation, maintenance, and decommissioning that IoT management platforms must support.
Security Hardening: Process of reducing attack surface by disabling unused services, applying least-privilege access, and enabling encrypted communications.
Scalability: System property ensuring performance and cost remain acceptable as the number of connected devices grows from prototype to mass deployment.
This chapter introduces the landscape of IoT application domains – the major industries and sectors where connected sensors and devices create measurable value. Understanding this landscape is the essential first step before diving into any specific domain.
11.3 Learning Objectives
By the end of this chapter, you will be able to:
Classify Major IoT Application Domains: Categorize the 14 key sectors where IoT creates value into the Five Pillars framework
Explain Domain-Specific Challenges: Distinguish unique requirements for smart cities, agriculture, healthcare, and industry
Compare IoT Solutions Across Sectors: Analyze how similar technologies apply differently across domains
Evaluate Sensor and Communication Needs: Match appropriate technologies to application requirements
Apply Cross-Domain Patterns: Demonstrate how common IoT patterns transfer across multiple industries
11.4 Minimum Viable Understanding
Five Pillars Framework: IoT applications organize into 5 pillars – SUSTAIN (cities, 30% energy savings), MOVE (transport, sub-10 ms latency), HEAL (healthcare, 99.9% reliability), FEED (agriculture, 40% water savings), and MAKE (manufacturing, 25% less downtime) – each with fundamentally different technical requirements.
Domain Requirements Vary by Orders of Magnitude: Latency spans from under 10 ms for autonomous vehicles to hours for agricultural sensors; battery life from unlimited (mains-powered industrial) to 10+ years (LoRaWAN parking sensors transmitting 10 bytes/hour).
Cross-Pillar Innovation Transfers Proven Patterns: Predictive maintenance algorithms from manufacturing (MAKE) apply directly to medical equipment monitoring (HEAL), because the underlying pattern – sensor data to anomaly detection to preventive action – is domain-agnostic.
Start with the Pain Point, Not the Platform: The #1 cause of IoT project failure is selecting technology before understanding domain-specific non-negotiable requirements (latency, reliability, power budget, data volume, regulatory compliance).
11.5 IoT Application Domains Basics
An IoT “application domain” is simply an industry or sector where connected sensors create value. Just like how smartphones have apps for different purposes (music, maps, health), IoT has different “domains” for different parts of life.
Simple Analogy: Think of IoT domains like departments in a hospital: - The Emergency Room (Transportation) needs instant responses – milliseconds matter - The General Ward (Smart Home) checks patients hourly – minutes are fine - The Lab (Agriculture) runs tests daily – hours are acceptable
Each “department” uses similar tools (sensors, connectivity) but with very different requirements for speed, reliability, and precision.
Why This Matters for You:
If you’re interested in building something: Understanding domains helps you pick the right project
If you’re choosing a career: Each domain has different skill requirements
If you’re evaluating a product: You’ll know what questions to ask
The Key Insight: IoT is not one-size-fits-all. The same sensor technology that works perfectly for a smart parking system would be completely wrong for a patient heart monitor. This chapter helps you understand why by mapping out the full landscape of IoT applications.
What You’ll Learn:
The five big categories (pillars) of IoT applications
The 14 specific domains within those pillars
How to navigate the detailed chapters that follow
What makes each domain unique in its requirements
11.6 IoT Domains for Business Leaders
Key Business Value: IoT creates measurable value across 14 major industry sectors – from 30% energy savings in smart buildings to 40% water reduction in precision agriculture. Early adopters gain competitive advantage through operational efficiency, new revenue streams from data-driven services, and enhanced customer experiences that differentiate their offerings in the market.
Decision Framework:
Initial investment: Sensors, connectivity, platform, and integration typically range from $25,000 to more than $500,000.
Operational cost: Platform fees, connectivity, and maintenance commonly range from $1,000 to $25,000 per month.
ROI timeline: Payback depends on domain complexity and often falls between 6 and 36 months.
Risk level: Consumer and facilities deployments are usually lower risk; industrial, healthcare, and transportation deployments carry higher safety, reliability, and compliance exposure.
When to Choose This Technology:
Operations generate data that could drive better decisions (manufacturing, logistics, facilities)
Manual monitoring or inspection processes are costly or error-prone
Customer experience could be enhanced with connected products or services
Regulatory compliance requires continuous monitoring and reporting
11.7 Domains Change the Design Question
An IoT domain is not just a market label. It changes the design question because each sector has different timing, safety, privacy, power, installation, and operating constraints. A smart-parking sensor, insulin refrigerator monitor, irrigation valve, and factory vibration sensor may all publish telemetry, but they are not interchangeable systems.
Use the Five Pillars as a first sorting tool, then test the fit with concrete constraints. SUSTAIN projects often optimize shared infrastructure. MOVE projects prioritize location, routing, and fast response. HEAL projects raise clinical workflow, safety, and privacy obligations. FEED projects must survive weather, distance, seasonality, and field maintenance. MAKE projects must fit production uptime, plant networks, and maintenance ownership.
Domain selection is a requirements decision: the useful stack changes when latency, data volume, safety, environment, and operating responsibility move to a different part of the map.
The practical reason for separating domains is that “good enough” changes. A building occupancy estimate can be probabilistic if it saves energy without making rooms unusable. A cold-chain vaccine monitor needs audit history, calibration evidence, and escalation before product quality is questioned. A factory vibration model can be useful when it predicts a maintenance window, but it can also damage trust if it creates alarms that stop production without root-cause evidence. The same sensor family can therefore require different sampling rates, data retention, user interface language, and support model.
Start each domain with the operating context rather than the product category. Ask what physical condition is being observed, who is accountable for the response, how quickly action must happen, what proof is needed after the event, and what happens when the device is missing, stale, wrong, or offline. That framing prevents a smart-city dashboard, a farm monitoring kit, a wearable health device, and an industrial asset monitor from being described as the same “sensor plus cloud” architecture.
Outcome: Name the decision that changes because the device exists.
Environment: Identify power, enclosure, radio path, installation access, and maintenance interval before selecting sensors.
Operator: Identify who receives the alert, who can act, and what happens if the system is wrong.
The chapters that follow can be read as a catalogue, but they are more useful as comparison cases. Notice how each domain shifts the balance among power budget, connectivity, data quality, standards, human workflow, and liability. That comparison skill is what lets a team avoid copying an architecture from one domain into another where the assumptions no longer hold.
11.8 Compare Domains by Constraints
When you evaluate a domain, build a small comparison table before choosing a platform. Include latency, battery life, expected device count, data volume, network availability, regulation, ownership, and the cost of missed or false alerts. The right answer often changes before hardware is discussed.
Real technologies make the tradeoffs visible. LoRaWAN can suit low-rate farm or city sensors where battery life and range matter. NB-IoT or LTE-M can help when managed cellular coverage and carrier operations are acceptable. OPC UA and MQTT Sparkplug appear in industrial contexts because equipment identity, tag semantics, and plant integration matter. HL7 FHIR may matter in healthcare because device data has to land in clinical workflows, not just a dashboard.
A useful practitioner artifact is a one-page domain profile. It should name the primary user, the operational decision, the physical environment, the integration target, the data owner, the support team, the success metric, and the unacceptable failure mode. For a city deployment that may mean a public works dispatcher, a GIS asset registry, an open-data rule, and a field maintenance SLA. For a hospital device it may mean a nurse workflow, an EHR interface, a clinical safety review, and privacy controls. For a factory it may mean a maintenance planner, an MES or CMMS integration, a plant-network boundary, and a production downtime threshold.
Start with a domain scenario. For example, compare cold-chain vaccines, fleet tire pressure, and greenhouse irrigation rather than comparing “sensors” in general.
Mark the non-negotiables. Safety response time, patient privacy, seasonal access, uptime windows, calibration, and auditability can eliminate attractive-looking stacks.
Choose a pilot boundary. Test one site, route, ward, field, or production cell deeply enough to reveal operations work before scaling.
Then translate the comparison into tests. A fleet pilot should prove location quality, driver workflow, tire-pressure or temperature sensor durability, cellular coverage gaps, and repair handoff. A precision agriculture pilot should prove gateway placement, battery life through the crop cycle, sensor calibration, and whether operators actually change irrigation or treatment. A healthcare pilot should prove alert routing, device cleaning, data minimization, identity matching, and what happens when a reading is outside expected clinical context.
The final review should be cross-functional. Engineering can explain protocols, payloads, uptime, and integration cost. Operations can explain who acts on alerts and who maintains devices. Legal, privacy, safety, or compliance staff can explain retention, consent, audit, and incident obligations. Finance can decide whether the value of the changed decision justifies the ongoing service cost. If any group is absent, the pilot may still work technically while failing as a domain deployment.
11.9 Telemetry Semantics Differ
A temperature reading means different things in different domains. In a smart building, it may tune comfort and energy use. In a cold-chain route, it may decide whether a shipment is usable. In a factory, it may forecast bearing failure. In healthcare, it may trigger escalation rules and record retention requirements.
That difference changes the system underneath the chart. Sampling interval, timestamp source, calibration history, retention period, data owner, alarm threshold, and fallback action all become domain-specific. Even the same transport protocol can carry different obligations depending on who relies on the result.
The data contract should therefore carry domain context, not just a value. A temperature event may need device identity, asset identity, location, unit, timestamp source, calibration version, firmware version, quality flag, enclosure state, and the rule that interpreted the value. Industrial deployments may encode asset and tag meaning through OPC UA information models or MQTT Sparkplug B birth certificates. Healthcare integrations may need patient or device identity to map safely into HL7 FHIR resources. Smart-city systems may need geospatial identifiers, public-release rules, and retention metadata before an observation can be shared beyond the operating team.
Time: Decide whether seconds, minutes, hours, or seasons are the meaningful unit for the domain.
Trust: Track calibration, firmware version, operator override, and missing-data behavior when decisions depend on the reading.
Integration: Connect the output to the receiving system people already use, such as a CMMS, EHR, fleet platform, irrigation controller, or city operations console.
Under the hood, domain semantics also shape storage and processing. A smart-building trend may be downsampled for energy analysis, while a regulated cold-chain record may need immutable audit history and exception review. A vehicle-safety signal may be evaluated at the edge because the response window is short. A soil-moisture reading may be most meaningful when joined with soil type, crop stage, valve state, rainfall, and forecast data. A vibration feature may need machine speed, bearing type, maintenance history, and production schedule before anomaly detection is useful.
This is why domain models matter even when platforms advertise generic device management. The registry, time-series database, event broker, rules engine, dashboard, and API can be shared, but they must preserve enough meaning for downstream action. If a pipeline drops units, calibration, identity, quality, or ownership metadata, it may still render a chart while making the operational decision less reliable. A good architecture lets common infrastructure handle ingestion, security, observability, and lifecycle management while domain schemas protect the meaning that operators need.
Checkpoint: Domain Fit
You now know why the same sensor reading can carry different meaning in a building, clinic, factory, vehicle, or field.
You now know why a domain profile must name the operator, decision, environment, integration target, and unacceptable failure mode.
You now know why generic device platforms still need domain schemas that preserve units, identity, quality, ownership, and calibration.
With the domain-fit lens in place, the next step is to group domains into memorable families before comparing their technical envelopes.
11.10 The Five Pillars of IoT Impact
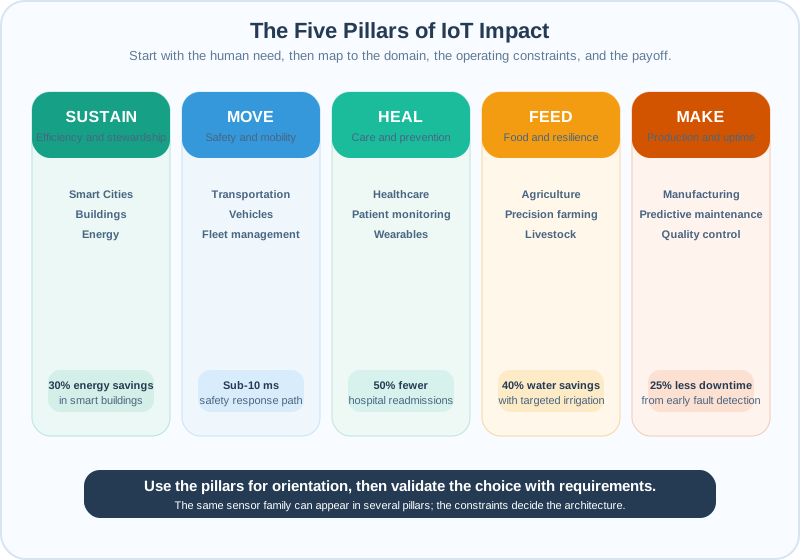
A helpful framework for understanding IoT’s transformative potential organizes applications into five pillars, each representing a fundamental human need that IoT addresses:
The Five Pillars of IoT Impact – each pillar links a human need to the domains and outcomes it prioritizes
Figure 11.1: The Five Pillars of IoT Impact – each pillar links a human need to the domains and outcomes it prioritizes
Domains: Manufacturing, Predictive maintenance, Quality control
Outcome: 25% less downtime
Mobile summary of Figure 14.1: the five pillars connect human needs to the domains and outcomes they prioritize.
Pillar
Domain
Key Challenge Addressed
Example Impact
SUSTAIN
Smart Cities
Urban resource efficiency
30% energy savings in smart buildings
MOVE
Transportation
Mobility safety and efficiency
90% reduction in traffic accidents (autonomous vehicles)
HEAL
Healthcare
Patient care and prevention
50% reduction in hospital readmissions
FEED
Agriculture
Food production optimization
40% water savings with precision irrigation
MAKE
Manufacturing
Production efficiency
25% reduction in equipment downtime
11.10.1 Why This Framework Matters
The “Sustain, Move, Heal, Feed, Make” framework helps you:
Remember the scope of IoT: These five areas cover most IoT applications
Identify opportunities: Ask “How can IoT help us Sustain/Move/Heal/Feed/Make better?”
Communicate value: Stakeholders understand human needs, not technical specifications
Cross-pollinate ideas: Solutions from one pillar often inspire innovations in others
Example of cross-pillar innovation: Predictive maintenance algorithms developed for MAKE (manufacturing) are now used in MOVE (autonomous vehicle maintenance) and HEAL (medical equipment monitoring).
11.11 IoT Application Domains Taxonomy
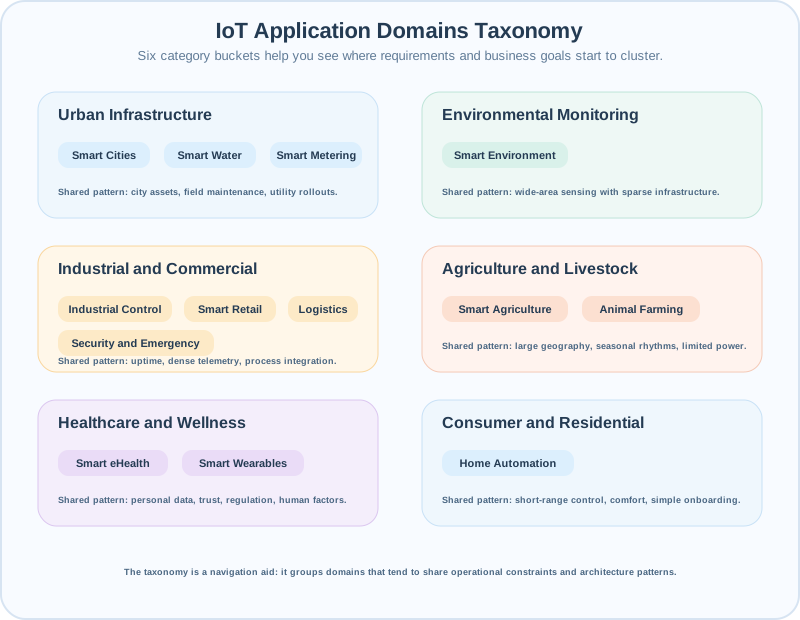
Understanding how the 14 application domains relate to each other helps in selecting appropriate technologies and architectures. The domains can be organized into six major categories based on their primary focus and requirements.
IoT Application Domains taxonomy organized into six major categories and their constituent domains
Figure 11.2: IoT Application Domains taxonomy organized into six major categories and their constituent domains
Six Category Buckets
Urban Infrastructure
Smart Cities
Smart Water
Smart Metering
Environmental Monitoring
Smart Environment
Industrial and Commercial
Industrial Control
Smart Retail
Logistics
Security and Emergency
Agriculture and Livestock
Smart Agriculture
Animal Farming
Healthcare and Wellness
Smart eHealth
Smart Wearables
Consumer and Residential
Home Automation
Mobile summary of Figure 14.2: six taxonomy buckets show where application domains cluster by operating context.
Category
Domain
Focus Areas
Urban Infrastructure
Smart Cities
9 initiatives (parking, lighting, waste, etc.)
Smart Water
Quality monitoring, Leak detection
Smart Metering
Energy & Utilities
Environmental Monitoring
Smart Environment
Fires, Pollution, Earthquakes
Industrial & Commercial
Industrial Control
M2M, Tracking, Quality Control
Smart Retail
Supply Chain, NFC payments
Logistics
Fleet management, Storage
Security & Emergency
Access control, Hazard detection
Agriculture & Livestock
Smart Agriculture
Precision Farming
Animal Farming
Tracking, Health monitoring
Healthcare & Wellness
Smart eHealth
Patient Monitoring
Smart Wearables
Biometric Sensing
Consumer & Residential
Home Automation
Energy, Security, Comfort
11.12 Domain Requirements at a Glance
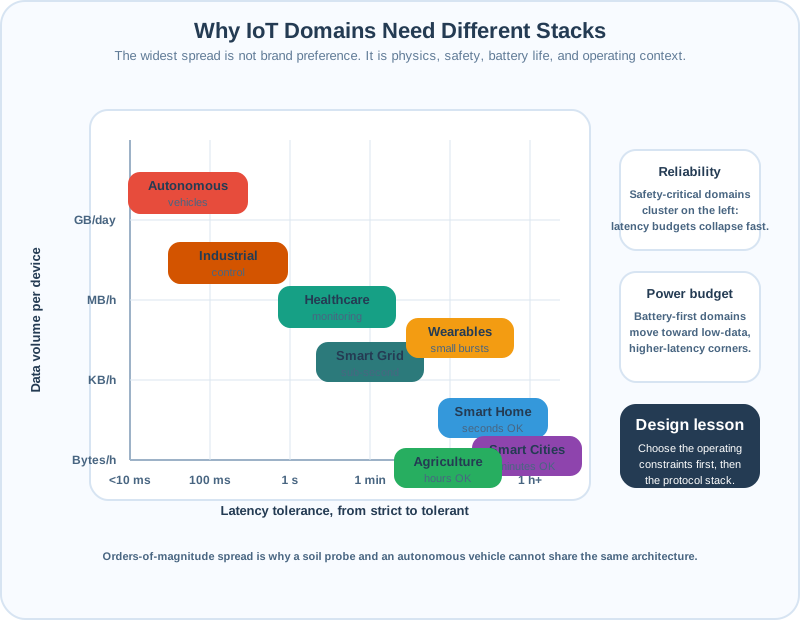
Each application domain has fundamentally different technical requirements. This comparison highlights why “one-size-fits-all” approaches fail in IoT:
Latency and data-volume positions for major IoT domains, showing why requirement profiles diverge so sharply
Figure 11.3: Latency and data-volume positions for major IoT domains, showing why requirement profiles diverge so sharply
Mobile summary of Figure 14.3: the biggest design splits come from latency, data volume, power budget, and regulation.
Autonomous vehicles: Latency below 10 ms, 99.999% reliability, vehicle power, GB/day data volume, and safety-critical regulation.
Industrial control: Latency below 100 ms, 99.99% reliability, mains power, MB/hour data volume, and industry standards.
Healthcare monitoring: Latency below 1 s, 99.9% reliability, days-to-weeks battery life, KB-MB/hour data volume, and FDA/CE medical expectations.
Smart grid: Latency below 1 s, 99.9% reliability, mains or battery power, KB-MB/hour data volume, and utility regulation.
Smart cities: Minutes of latency, 99% reliability, years of battery life, bytes-KB/hour data volume, and municipal oversight.
Agriculture: Hours of latency, 95% reliability, years of battery or solar life, bytes/hour data volume, and minimal formal regulation.
Smart home: Seconds of latency, 95% reliability, months-to-years power budget, KB/hour data volume, and consumer safety expectations.
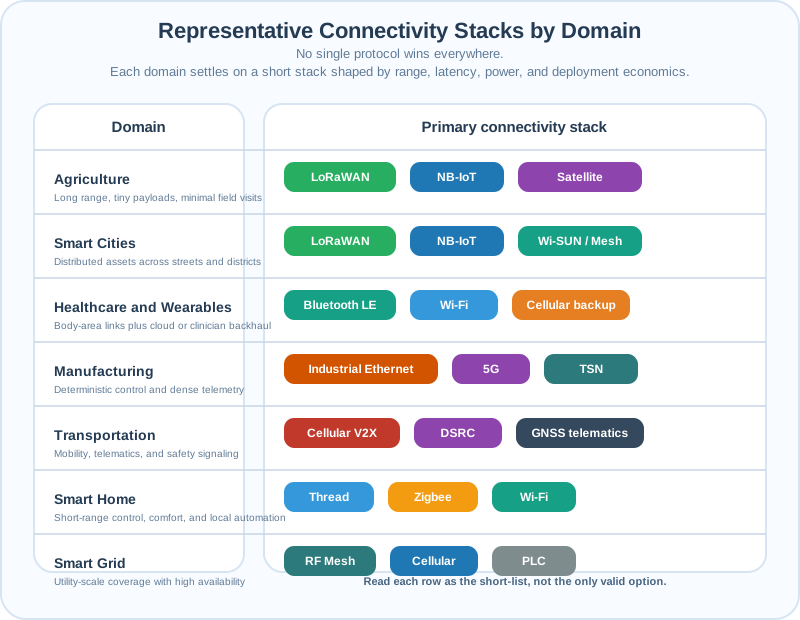
Representative connectivity stacks by domain: Range, latency, power, and operating ownership narrow realistic protocol choices before vendor selection starts.
11.13 Latency Drives Architecture
The latency requirements across domains span 6 orders of magnitude. Let’s quantify what this means for an autonomous vehicle versus agricultural sensor.
Autonomous vehicle collision avoidance: At 100 km/h, the vehicle moves about 27.8 m/s. A 10 ms response window is therefore about 0.28 m of travel before the vehicle can react, which is critical for collision avoidance.
Agricultural soil sensing: If soil moisture changes by roughly 0.5 percentage points per hour under typical evaporation, reporting every 6 hours captures about a 3 percentage point change, which is still actionable for irrigation.
Architecture gap: Six hours is 21,600 seconds. Compared with a 10 ms vehicle response window, that is a 2,160,000x difference in latency tolerance.
This explains why autonomous vehicles need edge computing (local <10 ms), while agriculture uses cloud platforms with LoRaWAN (hours acceptable).
Checkpoint: Requirement Spread
You now know why latency, reliability, data volume, power, and regulation can separate two domains more than the sensor type does.
You now know why edge processing is a safety requirement in some domains but unnecessary expense in others.
You now know why requirement comparison should happen before platform selection.
11.14 IoT Domain Misconceptions
Misconception 1: “All IoT applications are basically the same – just sensors sending data to the cloud.” Reality: Requirements vary by orders of magnitude. An autonomous vehicle processes gigabytes per day with sub-10 ms latency, while a smart parking sensor transmits a few bytes per hour and tolerates minutes of delay. Treating them as “the same” leads to massively over-engineered or dangerously under-engineered systems.
Misconception 2: “More sensors always means a better IoT system.” Reality: Sensor density must match the domain’s spatial and temporal resolution needs. A smart agriculture deployment may need 1 soil moisture sensor per hectare (readings every 30 minutes), while a factory vibration monitoring system needs sensors on every critical bearing (readings at 10 kHz). Adding unnecessary sensors increases cost, power consumption, network congestion, and data storage without improving outcomes.
Misconception 3: “Cloud connectivity is required for all IoT applications.” Reality: Many domains operate effectively with edge-only or local processing. Industrial control systems often require deterministic sub-millisecond response that cloud round-trips cannot guarantee. Agricultural sensors in remote areas may use store-and-forward with satellite backhaul on a daily schedule. The connectivity model must match the domain’s latency, reliability, and coverage requirements.
Misconception 4: “Consumer IoT experience transfers directly to industrial or healthcare IoT.” Reality: Consumer IoT (smart home, wearables) tolerates occasional failures gracefully – a missed smart light command is an inconvenience. Industrial IoT demands 99.99% reliability where failures cause production losses of thousands of dollars per minute. Healthcare IoT requires FDA/CE certification, clinical validation, and audit trails that add 12-24 months to development timelines. The regulatory, reliability, and safety requirements across domains are fundamentally different.
11.15 Domain Requirements Calculator
Use this interactive calculator to compare technical requirements across different IoT application domains:
Compare any two domains to understand technical differences:
Latency ratios > 1000x: Fundamentally different architectures (edge vs cloud)
Reliability gaps > 4%: Different redundancy strategies needed
Power differences: Battery life drives sensor density and cost
Regulation: Determines development timeline and certification
Try comparing Healthcare Monitoring with Smart Home to see how medical regulation affects design.
Checkpoint: Navigation Choice
You now know how to use a domain comparison to decide which follow-on chapter matters first.
You now know why the routing guide starts from operating environment, not from vendor category.
You now know why practice tasks are easier after you can explain the requirement gap in plain language.
11.16 Chapter Series Overview
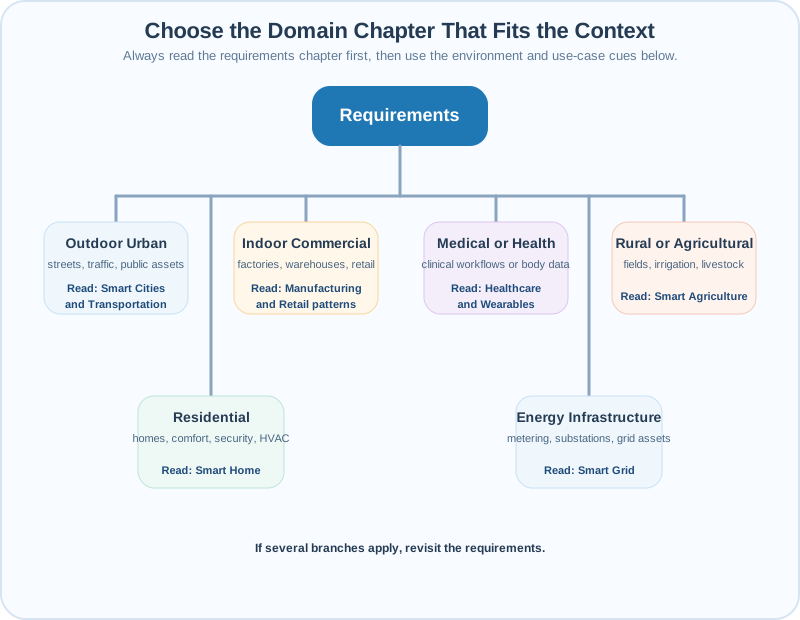
Use the decision flowchart below to identify which domain chapter is most relevant to your project or learning goals:
Decision flowchart for selecting the most relevant IoT application domain chapter based on your project context
Figure 11.4: Decision flowchart for selecting the most relevant IoT application domain chapter based on your project context
Quick Routing Guide
Outdoor Urban
Read Smart Cities and Transportation for streets, traffic, and public assets.
Indoor Commercial
Read Smart Manufacturing and Retail for factories, warehouses, and retail spaces.
Medical or Health
Read Healthcare IoT and Wearable IoT for clinical workflows and body data.
Rural or Agricultural
Read Smart Agriculture for fields, irrigation, and livestock use cases.
Residential
Read Smart Home and Building Automation for comfort, HVAC, and security.
Energy Infrastructure
Read Smart Grid and Energy for metering, substations, and grid assets.
Mobile summary of Figure 14.4: start with the requirements chapter, then route by the project environment.
This comprehensive guide to IoT application domains is organized into the following chapters:
11.16.1 Domain Requirements Selection
Understanding why different domains have different requirements: latency, reliability, scale, power, data volume, and regulatory constraints. Essential reading before diving into specific domains.
11.16.2 Smart Cities
Urban infrastructure optimization including smart parking, traffic management, street lighting, waste management, structural health monitoring, and city-scale IoT integration.
11.16.3 Transport and Connected Vehicles
Vehicle-to-Everything (V2X) communication, autonomous vehicles, traffic optimization, fleet management, and the connected mobility ecosystem.
11.16.4 Smart Grid and Energy
Electrical grid modernization, smart metering, demand response, renewable integration, and energy management systems.
11.16.5 Smart Agriculture
Precision farming, soil monitoring, irrigation optimization, livestock tracking, crop health monitoring, and agricultural IoT economics.
11.16.6 Smart Manufacturing and Retail
Industry 4.0, predictive maintenance, supply chain visibility, smart packaging, retail analytics, and connected factory operations.
11.16.7 Healthcare IoT
Patient monitoring, medication adherence, medical wearables, clinical-grade sensors, and healthcare data interoperability.
11.16.8 Wearable IoT
Fitness trackers, smartwatches, medical wearables, design principles, sensor accuracy, and the wearable technology market.
11.16.9 Smart Home and Building Automation
Home energy management, security systems, HVAC optimization, lighting control, and commercial building automation.
11.16.10 Practice and Knowledge Checks
Use the open checks and practice tasks later in this chapter to test your understanding of domain requirements before moving to the next application chapter.
11.17 Interactive: IoT ROI Calculator
Calculate the payback period for your own IoT investment using this interactive calculator.
Try adjusting the sliders to see how different costs and efficiency improvements affect the payback period. Most consumer IoT devices (smart thermostats, smart lighting) pay for themselves in under 12 months, while industrial IoT investments may have 18-36 month payback periods but generate much larger absolute savings.
11.18 How It Works: IoT Domain Selection
The big picture: Choosing the right IoT domain for your project involves matching technical requirements (latency, reliability, power, data volume) to real-world operational constraints and business outcomes.
Step-by-step breakdown:
Identify the pain point: A hospital needs patient alerts within 5 seconds (not hours). - Real example: ICU monitoring systems send alerts with <1 second latency to nursing stations.
Extract requirements: Sub-second latency, 99.99% reliability, clinical-grade accuracy (+/-0.1C), HIPAA compliance. - Real example: Healthcare wearables cost $500-2,000 vs $50-200 for consumer fitness trackers due to these requirements.
Eliminate incompatible technologies: LoRaWAN (minutes of latency) and NB-IoT (no local processing) are ruled out. Wi-Fi or Bluetooth with local hub processing remains. - Real example: A vineyard can use LoRaWAN for hourly soil reports, but an operating room cannot.
Why this matters: Starting with requirements instead of technology prevents the #1 cause of IoT failure - deploying solutions that don’t match domain needs.
11.19 Prerequisites
This chapter series is intended for readers who have:
Read Overview of IoT or have an equivalent high-level understanding of what IoT is
No detailed knowledge of networking protocols, architectures, or business models is required; those will be introduced in later chapters.
11.20 Knowledge Check: IoT Application Domains
11.21 Start With the Problem
The Mistake: Selecting an IoT platform, connectivity technology, or sensor ecosystem before clearly defining the operational problem you’re trying to solve, leading to deployed systems that are technically impressive but deliver minimal business value.
Why This Happens:
Technology-first vendors: IoT vendors sell platforms (“Deploy our sensors everywhere!”) rather than solutions to specific problems
FOMO: Fear of missing out on IoT trends drives investment before needs analysis
Success stories inspire wrong lessons: “Company X saved 30% with LoRaWAN sensors” leads to deploying LoRaWAN without asking if it matches your requirements
Engineering fascination: Technical teams focus on cool capabilities rather than business outcomes
Real-World Example: A manufacturing company invested $850K deploying 2,000 vibration sensors across all machines using a cutting-edge AI platform with sub-millisecond anomaly detection. After 18 months, ROI was only 0.4x ($340K savings) because: - 80% of machines had <$10K replacement cost – predictive maintenance was overkill - Critical machines (15%) already had excellent maintenance – sensors added no value - Sub-millisecond latency unnecessary – maintenance schedules work on day/week timescales - Data overwhelmed team – 2,000 machines generated too many alerts to act on
What They Should Have Done:
Step 1: Identify High-Value Problems
Analyzed 24 months of unplanned downtime costs
Found 8 machines (0.4% of fleet) responsible for 72% of downtime losses ($2.4M/year)
Root cause: Bearing failures on these high-load CNC machines
Step 2: Match Technology to Problem
Only these 8 machines justified vibration monitoring
Daily reporting sufficient (no need for sub-ms latency)
Simple edge FFT + alert-when-anomaly detected (no need for complex AI)
Step 3: Right-Sized Deployment
Deployed sensors on 8 critical machines only: $25K
Prevented 4 catastrophic failures in year 1: $600K damage avoided
ROI: 24x instead of 0.4x
How to Avoid This Mistake:
Framework: Problem → Requirements → Technology
1. Define the Measurable Problem (before ANY technology discussion)
Pilot: “Deploy 1,000 spaces in densest downtown area first”
Measure: “Average search time: 18 min → 6 min after 3 months”
Scale: “Expand to 15,000 spaces city-wide”
Key Takeaway: The most successful IoT deployments start with a quantified operational problem, derive technical requirements from that problem, and only then select appropriate technologies. Technology-first approaches generate expensive pilot projects that never scale because they optimize for technical sophistication rather than business value.
Checkpoint: Problem First
You now know why a measurable operational pain point must come before a platform decision.
You now know why pilot scope should focus on the highest-value application instead of covering every possible asset.
You now know why ROI evidence, workflow fit, and failure recovery determine whether a technically successful pilot can scale.
11.22 Try It Yourself
Challenge: Pick a familiar IoT application (smart thermostat, fitness tracker, or parking sensor) and analyze it using the domain selection framework.
Steps:
Identify which of the Five Pillars it belongs to (SUSTAIN, MOVE, HEAL, FEED, or MAKE)
List the six requirement dimensions: latency, reliability, scale, power, data volume, and regulation
For each dimension, estimate the requirement (e.g., latency: seconds are acceptable)
Compare to the Domain Requirements table in this chapter - does your analysis match?
Key insight: The smart thermostat’s requirements (seconds of latency, 99% reliability, low data) explain why Wi-Fi is a suitable protocol. Contrast with healthcare patient monitoring which needs <1s latency and 99.99% reliability.
11.23 Quiz: IoT Domain Concepts
11.24 Quiz: IoT Domain Assessment
Common Pitfalls
11.25 Initial Prototype Over-Engineering
Adding too many features before validating core user needs wastes weeks of effort on a direction that user testing reveals is wrong. IoT projects frequently discover that users want simpler interactions than engineers assumed. Define and test a minimum viable version first, then add complexity only in response to validated user requirements.
11.26 Development Security Neglect
Treating security as a phase-2 concern results in architectures (hardcoded credentials, unencrypted channels, no firmware signing) that are expensive to remediate after deployment. Include security requirements in the initial design review, even for prototypes, because prototype patterns become production patterns.
11.27 Failure and Recovery
Designing only for the happy path leaves a system that cannot recover gracefully from sensor failures, connectivity outages, or cloud unavailability. Explicitly design and test the behaviour for each failure mode and ensure devices fall back to a safe, locally functional state during outages.
11.28 Label the Diagram
11.29 Code Challenge
11.30 Summary
This chapter established the foundation for understanding IoT application domains:
Five Pillars Framework: IoT applications organize into SUSTAIN (cities), MOVE (transport), HEAL (healthcare), FEED (agriculture), and MAKE (manufacturing) – each with distinct requirements
14 Application Domains: Grouped into six categories (Urban Infrastructure, Environmental, Industrial, Agriculture, Healthcare, Consumer) with different sensor, connectivity, and regulatory needs
Requirements Vary Dramatically: Latency ranges from < 10 ms (autonomous vehicles) to hours (agriculture); reliability from 95% (smart home) to 99.999% (safety-critical); power budgets from unlimited (mains-powered) to 10-year battery life
Cross-Pillar Innovation: Algorithms and patterns transfer between domains (predictive maintenance from manufacturing to healthcare equipment)
Start with the Pain Point: The most successful IoT deployments address specific, measurable operational problems – not technology for its own sake
11.31 In 60 Seconds
This chapter introduces the key concepts, frameworks, and terminology of the module, providing the mental model you need to understand and connect the more detailed topics that follow.
11.32 Key Takeaway
In one sentence: IoT success in any domain depends more on solving a specific, measurable problem than on deploying cutting-edge technology.
Remember this rule: Start with the pain point, not the platform. The domains generating the highest ROI (30-40% savings) are those where IoT addresses a clear operational problem – wasted water, unplanned downtime, manual inspections – rather than adding connectivity for its own sake.
 Checkpoint: Domain Fit