24Lessons from Real Deployments: Reading Case Studies as Evidence, and Barcelona Smart City
applications
iot
use
cases
One of two parts on real IoT deployments – the other is Lessons from Real Deployments: Volkswagen Predictive Maintenance and Cross-Case Lessons. This part introduces the transfer-test framework used to read any case study as evidence, then follows Barcelona’s smart-city platform from problem through architecture, rollout phases, and measured outcomes.
24.1 Start With the Story
Imagine reading a deployment story with one question in mind: what would I copy, and what would I avoid? This chapter treats case studies as evidence, not anecdotes, so each use case is judged by the problem, measured outcome, operating constraint, and failure lesson it reveals.
Estimated time: ~25 minutes. Level: Advanced.
Chapter Roadmap
First, use the transfer-test frame to separate a reusable IoT pattern from a local success story.
Then, follow Barcelona from city-service pain points through Sentilo, open APIs, TCO, and measured civic outcomes.
Next, follow Volkswagen from downtime risk through edge ML, sensor fusion, maintenance workflow, and ROI proof.
Finally, compare both cases to extract deployment pitfalls, trust signals, and a six-phase evidence framework.
Checkpoint callouts pause at the main transitions to help you test what is transferable; deep-dive sections keep the arithmetic and implementation details available without interrupting the case-study thread.
Key Concepts
IoT Architecture: Layered model comprising perception, network, and application tiers defining how sensors, gateways, and cloud services interact.
Edge Computing: Processing data close to the sensor source to reduce latency, bandwidth costs, and cloud dependency.
Telemetry: Time-stamped sensor readings transmitted from a device to a cloud or edge platform for storage, analysis, and visualisation.
Protocol Stack: Set of communication protocols layered from physical radio to application message format that devices must implement to interoperate.
Device Lifecycle: Stages from manufacture through provisioning, operation, maintenance, and decommissioning that IoT management platforms must support.
Security Hardening: Process of reducing attack surface by disabling unused services, applying least-privilege access, and enabling encrypted communications.
Scalability: System property ensuring performance and cost remain acceptable as the number of connected devices grows from prototype to mass deployment.
24.2 Minimum Viable Understanding
Technology is 30-40% of success; people and process are 60-70%: Both Barcelona ($232M/year savings) and Volkswagen (912% ROI) succeeded primarily through organizational readiness, change management, and workflow integration – not by choosing the best sensors or platforms
Start small with quick-ROI pilots, then scale from proven savings: Barcelona began in one district with parking and lighting ($20M first-year savings); Volkswagen started with 150 robots on one production line (7-month payback) – early wins funded all subsequent expansion
False positives destroy user trust faster than accuracy builds it: Volkswagen’s 87% accurate system was initially ignored because 18% false positive rates caused alert fatigue; reducing false positives to less than 5% was the turning point for adoption
24.3 Learning Objectives
By the end of this section, you will be able to:
Analyze comprehensive IoT deployments at city and enterprise scale
Extract lessons learned from Barcelona’s smart city implementation
Apply predictive maintenance ROI frameworks from Volkswagen’s manufacturing case
Compare deployment strategies across smart city and industrial IoT domains
Design IoT solutions informed by real-world success patterns and common failure modes
Calculate total cost of ownership including often-overlooked hidden costs
The following detailed case studies demonstrate practical IoT implementations across different domains, highlighting technologies used, challenges overcome, quantified results, and lessons learned.
24.4 A Case Study Is a Transfer Test
A useful IoT case study does more than tell a success story. It lets you test whether a deployment pattern can transfer to another problem without copying the original organization blindly. Barcelona and Volkswagen are deliberately different: one is a public-service platform across city departments, while the other is an industrial reliability program inside a factory. The shared lesson is not that every project needs the same sensors or the same cloud stack. The shared lesson is that a real IoT deployment ties a measured problem to an architecture, an operating workflow, and a result that someone is accountable for.
Read each case through four lenses. The first lens is the problem: what cost, risk, delay, or service failure made the project worth funding? The second lens is the architecture: which devices, networks, gateways, middleware, analytics, and user interfaces carried the loop? The third lens is adoption: who had to trust the output and change their work? The fourth lens is evidence: which result was measured, and which result was only asserted? A case that cannot answer all four questions is weaker evidence for design work.
Transfer Lens
Barcelona Smart City
Volkswagen Predictive Maintenance
Problem
Parking, waste, lighting, water, and city-service coordination
Unplanned downtime on high-value production assets
Architecture
Sentilo, open APIs, fiber, LoRaWAN, MQTT, REST, city applications
Industrial sensors, edge gateways, TensorFlow Lite, OPC UA, MES integration
Adoption
Municipal departments, citizens, developers, service operators
Technicians, maintenance planners, line managers, plant leadership
Evidence
Service savings, utilization, route efficiency, ecosystem participation
Downtime reduction, false-positive reduction, payback, work-order use
The transferable part of a case study is the link between problem, architecture, adoption, and evidence, not a literal copy of the original deployment.
This frame also protects you from advertising language. If a smart-city vendor says a platform is “open” but cannot show how device data, APIs, city departments, and developers connect, the claim is incomplete. If a predictive-maintenance vendor reports high model accuracy but cannot show alert acceptance, work-order routing, false-positive control, and downtime reduction, the design lesson is incomplete. Treat every case as evidence that must survive a transfer test.
24.5 Pattern vs Local Conditions
When you use a case study to design a new project, do not copy the visible artifacts first. Start by separating the transferable pattern from local conditions. Barcelona’s open Sentilo platform matters because a city has many departments, many vendors, and a long-lived public-service mandate. A private campus may still need open APIs, but it may not need the same civic data portal. Volkswagen’s edge analytics matter because production downtime is expensive and high-rate machine data is too large to ship raw. A small workshop may still need predictive maintenance, but it may not need the same gateway density or model-training pipeline.
A practitioner translation note should name the decision boundary. For Barcelona, that boundary might be “which city services can share sensor events without exposing personal data or locking the city into one vendor.” For Volkswagen, it might be “which signals should be processed locally so technicians receive actionable alerts instead of noisy dashboards.” These boundaries turn a story into a requirements document. They also expose which assumptions must be rechecked before a team promises similar results.
Copy the decision logic. Reuse the sequence of problem definition, pilot selection, measurement, trust-building, and scale-out.
Recheck the economics. Replace the case’s downtime, labor, maintenance, and public-service numbers with numbers from the new organization.
Recheck the operating owner. Identify the person or team that receives alerts, approves action, maintains devices, and explains failures.
Recheck the data contract. Define timestamps, identifiers, event meanings, privacy boundaries, retention, and API ownership before scaling.
This is why the chapter compares a smart-city case with an industrial case instead of keeping them separate. The contrast makes the transfer work visible. City projects often fail when departments cannot agree on data ownership or procurement rules. Factory projects often fail when alert quality is not trusted by technicians. In both cases, the technology only succeeds when the operating workflow changes with it.
24.6 Evidence Has a Data Lineage
The technical depth behind a case study is the lineage from physical event to decision record. In Barcelona-style systems, a parking bay, waste container, or irrigation point produces a field event; a network such as LoRaWAN, fiber-connected gateway, or cellular backhaul carries the event; middleware such as Sentilo normalizes the message; APIs expose it to applications; and city operators use it to dispatch, price, maintain, or report service quality. If the lineage loses timestamps, device identifiers, calibration status, or service ownership, the dashboard may still look convincing while the evidence becomes weak.
In a Volkswagen-style predictive-maintenance system, the lineage is faster and more local. Vibration, current, acoustic, or thermal signals are sampled near the asset; an edge gateway extracts features; a model scores anomalies; the maintenance system creates or updates a work order; and a technician confirms whether the alert matched a real condition. The under-the-hood question is not just whether TensorFlow Lite, OPC UA, SAP Manufacturing Integration, or a digital twin appears in the architecture. The question is whether each component preserves enough context for a responsible maintenance decision.
Case-study evidence therefore needs audit fields. A smart-city event should record device identity, measurement time, location granularity, calibration state, consent or privacy class where relevant, API consumer, and action taken. An industrial alert should record asset identity, signal window, model version, confidence or severity band, recommended action, spare-part status, operator acknowledgement, and eventual maintenance outcome. Those fields are what let a team distinguish a transferable engineering pattern from a one-off success narrative.
Freshness: Can the reader tell when the physical event happened and whether the value is stale?
Ownership: Can the reader tell who acts on the event and who maintains the measurement path?
Outcome link: Can the reader connect the event to a cost, service, safety, reliability, or adoption measure?
Under the hood, the strongest case studies are traceable. They make it possible to follow the data from the physical system through the IoT stack to the human or automated decision that created value.
Checkpoint: Evidence Frame
You now know how to read a deployment story as design evidence:
A transferable case ties problem, architecture, adoption, and evidence together.
Barcelona and Volkswagen are intentionally different so the shared decision logic is visible.
Hey Sensor Squad! Imagine you want to build the coolest treehouse ever. Would you just start hammering? No way! You would look at treehouses other kids already built to learn what worked and what did not.
Case studies are like visiting those treehouses. We look at two amazing real-world projects:
Barcelona turned an entire city “smart” with sensors everywhere – in parking spots, trash cans, and street lights. It is like giving a city superpowers!
Volkswagen put sensors on factory robots to predict when they would break – like a doctor who can tell you will get sick before you feel bad.
By studying what these teams did right (and wrong), we can build better IoT projects ourselves. The biggest lesson? It is not just about fancy technology – it is about getting people to actually use it!
24.8 Lessons from Real IoT Projects
A case study is a detailed look at how a real organization solved a problem using IoT technology. Instead of learning theory in isolation, case studies show what actually happened – including the surprises and mistakes.
This chapter examines two large-scale IoT deployments:
Barcelona connected an entire city with over 19,000 sensors to manage parking, waste collection, street lighting, and water. The city saves over $232 million per year, but getting 20 different departments to work together was harder than installing the sensors.
Volkswagen attached 30,000 sensors to factory robots to predict when they would break down. The system pays for itself in just 7 months, but early on technicians ignored the alerts because too many were false alarms.
The key beginner takeaway is that successful IoT is not just about hardware and software. The biggest challenges are getting people to trust the system, connecting it to existing processes, and maintaining it over time. Both projects spent 40-50% of their effort on integration and change management rather than on the technology itself.
24.9 Design Contract: Smart Parking Sensors
The deeper smart-parking sensor chain now lives in Smart Parking Sensor Contracts, covering magnetometer occupancy sensing, LoRaWAN reporting, adjacent-bay crosstalk, per-sensor baseline calibration, event-driven state updates, recovery heartbeats, and the metadata operators need before scaling a case-study lesson.
24.10 How It Works: Compare IoT Case Studies
Use the same evidence frame for every case so the lessons transfer.
Start with the problem. Name the operational pain point, user group, and decision the system was meant to improve.
Trace the architecture. Identify sensors, connectivity, edge or cloud processing, application workflow, and data ownership.
Check the result measure. Separate claimed outcomes from measured cost, uptime, maintenance, adoption, or service quality.
Extract the transferable lesson. Decide which part depends on the local context and which principle could apply elsewhere.
24.11 Incremental Examples
Beginner Example: A smart-parking case can teach demand sensing, public communication, and maintenance planning even before advanced analytics are added.
Intermediate Example: A predictive-maintenance case links sensor evidence, downtime cost, alert thresholds, and technician workflow.
Advanced Example: A cross-case review compares smart-city and industrial deployments to separate architecture patterns from domain-specific constraints.
24.12 Evidence or Advertisement
What makes a case study useful for design work?
Answer: it names the problem, architecture, constraints, measured outcome, and trade-offs clearly enough that another team can judge what transfers.
24.13 Concept Check: Transferable Lesson
Why should you separate local context from general principle?
Answer: a result may depend on local budgets, regulations, user behavior, or existing infrastructure. The transferable lesson is the decision logic, not every implementation detail.
24.14 Try It Yourself
Choose one case in this chapter and write a transfer note: problem, architecture, result measure, one local constraint, and one lesson that could apply to a different domain.
Scenario: Barcelona deployed 3,800 smart parking sensors across downtown neighborhoods. Let’s calculate the true 5-year total cost of ownership (TCO) to understand hidden costs often missed in initial budgets.
5-year net benefit: $400M revenue - $2.7M cost = $397.3M
Return on investment: ($397.3M / $2.7M) × 100 = 14,715% over 5 years
Payback period: $2.7M / $80M per year = 12 days (essentially immediate)
Key Insights from TCO Analysis:
Operating costs dominate: 62% of 5-year TCO is operational, not initial hardware
Hidden costs are 75% of visible operating costs: Many budgets miss sensor replacement, troubleshooting, and integration maintenance
Staff costs are the largest single line item: $325K over 5 years ($65K/year × 5) – more than the sensors themselves
TCO per sensor ($710) is 2.8× the sensor cost ($250): Rule of thumb for IoT projects: total 5-year cost is 3× initial hardware
Common Budgeting Mistake: A naive budget might estimate $950K (sensors) + $38K (gateways) + $150K (software) = $1.14M total. The true 5-year TCO is $2.7M – 2.4× the naive estimate. This is why many IoT projects run out of funding in Year 2-3 when operating costs accumulate.
24.17 Barcelona Parking TCO Calculator
Use this calculator to estimate the total cost of ownership for a smart parking deployment similar to Barcelona’s system.
Before diving into each case study, this comparison highlights the key dimensions across both deployments:
Barcelona
City-scale service orchestration
Barcelona used an open platform to connect parking, waste, lighting, irrigation, and air-quality services across a dense urban environment.
Cloud-centric service integration with open APIs and city-wide fiber
Stakeholders span municipal departments, citizens, startups, and regulators
Success depends on ecosystem coordination as much as sensor deployment
Volkswagen
Factory-scale operational resilience
Volkswagen focused on high-value robots and used edge analytics to cut downtime before failures stopped production lines.
Edge-first processing keeps latency below 10 ms for maintenance alerts
Stakeholders center on technicians, MES workflows, and plant leadership
Success depends on trust, false-positive control, and clear payback
24.19 Case Study 1: Barcelona Smart City
24.20 Barcelona Background and Challenge
Barcelona faced significant economic challenges following the 2008 recession, with high unemployment and declining tourism. The city needed to modernize its infrastructure, improve citizen services, and attract technology investment while reducing operational costs. With a sprawling urban environment serving 1.6 million residents and 8 million annual tourists, the challenge was massive: how to deploy city-wide IoT infrastructure that could scale, integrate diverse systems, and deliver tangible benefits without overwhelming the municipal budget or creating vendor lock-in.
Key Challenges:
Legacy infrastructure not designed for smart city applications
Heterogeneous device ecosystem from multiple vendors
Need for open, scalable platform to avoid vendor lock-in
Budget constraints requiring demonstrable ROI
Privacy concerns around citizen data collection
Integration of 20+ different municipal services
24.21 Barcelona Solution Architecture
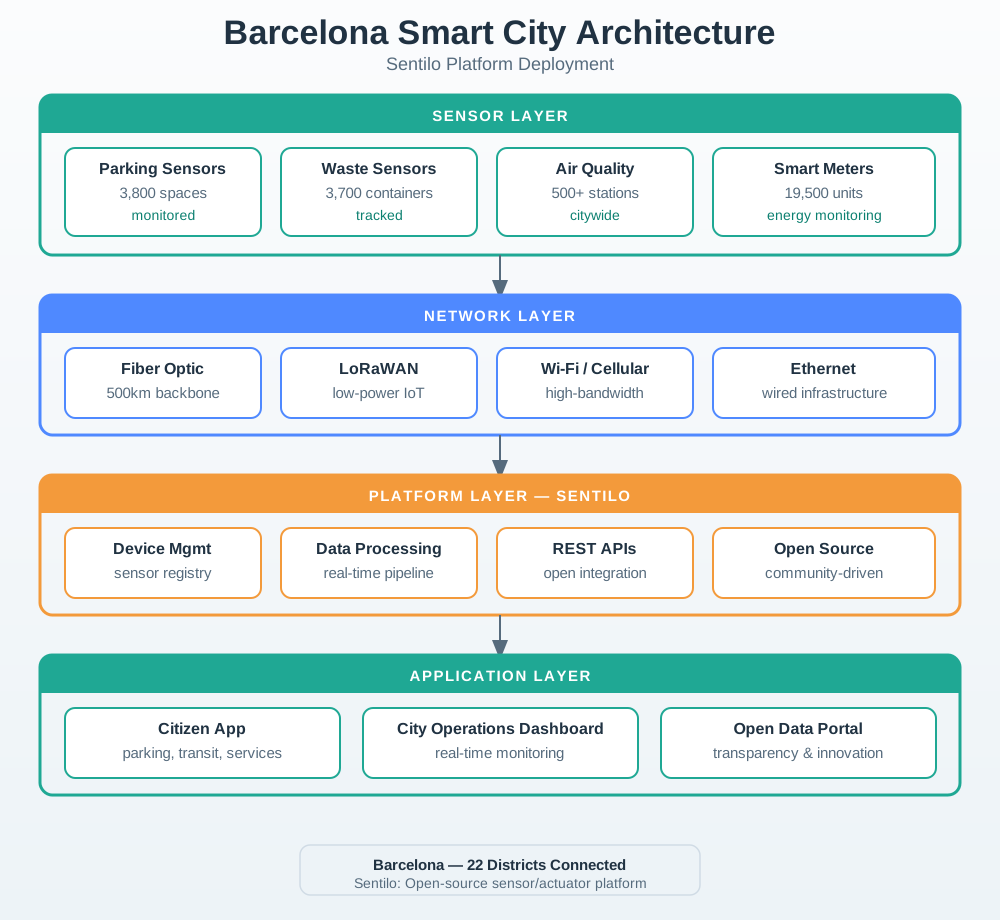
Barcelona developed a comprehensive IoT platform called Sentilo (sensor in Esperanto), built on open-source principles to manage heterogeneous IoT devices across the city.
Barcelona Smart City Architecture
Figure 24.1: Four-layer architecture diagram for Barcelona Smart City IoT system showing Sentilo platform deployment
Energy efficient, remote control, lifespan 15+ years
Air Quality
NO2, PM2.5, CO2 sensors
Multi-parameter, research-grade accuracy
Communication
MQTT, REST APIs
Standard protocols, interoperable
Data Storage
PostgreSQL + TimescaleDB
Time-series optimization, SQL compatibility
Analytics
Apache Spark, Hadoop
Big data processing, machine learning
24.23 Barcelona Implementation Phases
Phase 1: Infrastructure (2011-2013)
Deployed 500km fiber optic network connecting city facilities
Established Sentilo platform architecture
Pilot deployments in 22@ innovation district
Initial 1,000 sensors deployed
Phase 2: Core Services (2014-2016)
Smart parking: 3,800 spaces with real-time availability
Waste management: 3,700 containers with fill-level monitoring
LED lighting: 1,100 adaptive streetlights installed
Environmental monitoring: 500+ air quality sensors
Phase 3: Expansion (2017-2019)
Smart irrigation: 19,500 connected water meters
Enhanced bus services: 500 stops with real-time information
Tourist information systems integration
Open data portal launch (200+ datasets)
Technical Innovations:
Sentilo Architecture: Modular design allowing services to consume sensor data without device-specific integration
Edge Processing: Local gateways for real-time decisions (e.g., traffic light adjustments)
API-First Design: RESTful APIs with OAuth2 authentication for third-party developers
Open Data: Public APIs allowing startups to build citizen services
24.24 Barcelona Results and Impact
Quantified Outcomes:
Cost Savings:
Water Management: $58 million/year saved through smart irrigation (25% reduction)
Energy: $37 million/year from LED lighting and optimization (30% reduction)
Waste Collection: $87 million/year from optimized routes (20% efficiency gain)
Parking Revenue: +$50 million/year from improved enforcement and turnover
Total Annual Savings: $232 million/year
24.25 Putting Numbers to It
Barcelona’s $232M annual savings come from combining multiple revenue streams where each domain reinforces the others. The compound benefit model adds direct savings across domains, then adds a synergy term for cross-domain effects. In that model, each domain saving is one input, and the synergy multiplier, typically 0.15-0.3, captures value created when one service improves another. Worked example: Water ($58M) + Energy ($37M) + Waste ($87M) + Parking ($50M) = $232M direct savings. But cross-domain integration added ~$40M more – parking data improved traffic routing which reduced waste collection times, creating value beyond simple addition.
Operational Improvements:
Parking Search Time: Reduced from 20 minutes to 5 minutes average (75% reduction)
Waste Collection Efficiency: 20% fewer truck rolls through optimized routing
Air Quality: 47% reduction in NO2 in pilot zones through traffic management
Streetlight Maintenance: 30% reduction in maintenance costs
Tourist Satisfaction: +15% improvement in services rating
Economic Impact:
47,000 new jobs created in smart city sector
EUR 2.6 billion economic impact over 5 years
1,200+ startups engaged with open data platform
$300 million investment attracted in IoT innovation
Environmental Impact:
42% reduction in CO2 emissions from municipal operations
8,000 tons/year CO2 savings from smart lighting
12,000 tons/year CO2 savings from waste optimization
Water consumption: 25% reduction in parks and public spaces
24.26 Barcelona Lessons Learned
24.26.1 Key Takeaways
1. Open Standards Are Essential
Proprietary platforms create vendor lock-in and limit innovation
Open-source Sentilo enabled 20+ cities worldwide to adopt and contribute
Standard protocols (MQTT, REST) allowed diverse vendor participation
Lesson: Insist on open APIs and standards from the start; vendor-neutral middleware is critical for long-term success
2. Infrastructure First, Services Second
500km fiber backbone was foundation for all services
Without reliable connectivity, sensors become expensive paperweights
City-owned infrastructure provided independence from telecom contracts
Lesson: Invest in robust network infrastructure before scaling IoT deployments
3. Demonstrate Quick Wins for Stakeholder Buy-In
Parking and lighting delivered visible results within 6 months
Early savings ($20M in first year) funded further expansion
Citizen-facing apps built engagement and political support
Lesson: Start with high-visibility, quick-ROI projects to build momentum
4. Privacy and Security from Day One
GDPR-compliant architecture before regulation mandated it
Anonymization pipelines prevented personal data collection
Security audits and penetration testing as ongoing practice
Lesson: Design for privacy and security upfront; retrofitting costs 10x more
5. Engage Citizens and Developers
Open data portal spawned 1,200+ startups building services
Citizen feedback shaped prioritization of services
Hackathons and challenges drove innovation beyond city resources
Lesson: Create open APIs and data portals; external innovation often exceeds internal capacity
6. Integration Complexity Is the Real Challenge
20+ municipal departments with different IT systems
Legacy systems required custom adapters and middleware
Change management and training consumed 40% of implementation effort
Lesson: Budget significant time for integration and organizational change
 Checkpoint: Evidence Frame