38 Asset Tracking Unit Economics Contracts
38.1 Start With the Story
Begin with one tracked asset whose location data must justify tags, gateways, connectivity, platforms, and human response. This contract chapter turns asset tracking into a unit-economics story where shrinkage, utilization, delay, labor, and exception handling must pay for the system.
38.2 Learning Objectives
After this page, you should be able to:
- Explain why subsidised IoT hardware shifts attention from sale price to per-device recurring margin.
- Calculate hardware payback from monthly subscription revenue, connectivity cost, cloud cost, and support allocation.
- Show how reporting frequency changes cellular cost and payback time.
- Explain why churn before payback can turn subscriber growth into losses.
- Identify telemetry and billing records needed to reconcile device activity with subscription economics.
38.3 After Business Model Cases
IoT Business Model Case Studies compares connected-product revenue shifts such as Lighting-as-a-Service, razor-and-blade economics, and data monetization. This page isolates one financial contract underneath those cases: a subsidised connected device only works when recurring margin survives connectivity, cloud, support, churn, and hardware payback.
Use it when a case study or pitch claims “recurring revenue” without showing per-device margin, activated versus retained devices, payback time, churn sensitivity, and cost attribution by customer, device, firmware, reporting profile, region, and network plan.
38.4 Asset Tracking Unit Economics
A firm sells a subscription service: a small LTE-M GPS tracker for shipping containers, billed at $10/device/month, with the hardware given away or heavily subsidised. Whether this business survives is decided not by the pitch deck but by unit economics: the recurring cost and revenue of a single device over its life. Every IoT-as-a-service model reduces to this arithmetic.
The recurring costs are the device’s cellular connectivity and its cloud footprint: ingestion, storage, and processing. The recurring revenue is the subscription. The one-time cost is the subsidised hardware, which must be recovered before the device is profitable.
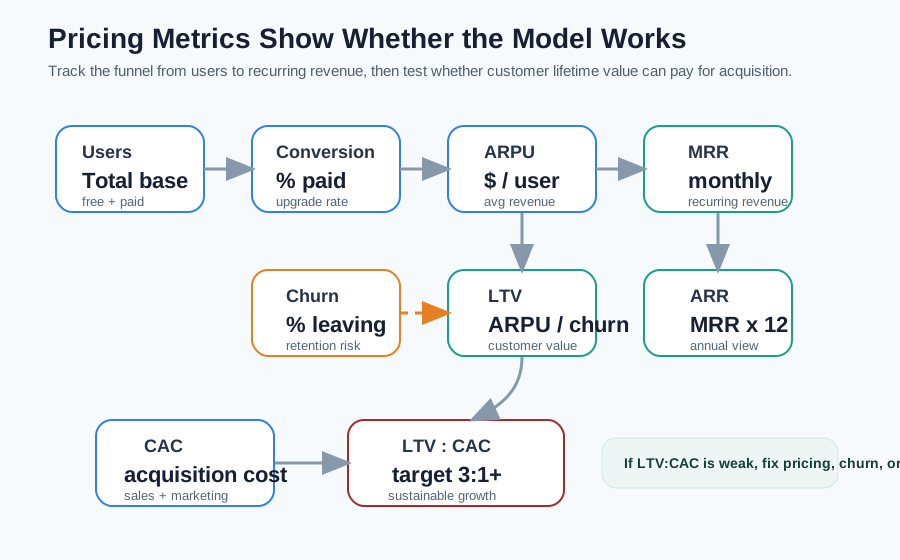
The same case can look attractive or fragile depending on which denominator is used. Counting total connected devices rewards growth, but the subscription model is healthier when it tracks activated devices, billable devices, retained devices, and devices past payback separately. A tracker in a warehouse drawer still has sunk hardware cost; a tracker sending excessive location updates still creates cellular and cloud cost; a tracker that delivers avoided loss or faster claims settlement is the device that justifies renewal.
That is why the case-study lesson is not “subscriptions are better than hardware.” The lesson is that connected capability changes when value is captured. Hardware revenue is captured once at shipment. Service revenue is captured only if the device remains useful, connected, supported, and trusted long enough for lifetime value to exceed hardware subsidy, customer acquisition cost, and operating cost. The model is proven by renewal behavior, not by activation count alone.
Control question: an IoT service lives or dies on unit economics: subscription revenue minus recurring connectivity and cloud cost, then the time required to recover subsidised hardware.
38.5 Monthly Margin and Payback
Put representative numbers on one device:
| Line item | Per device / month |
|---|---|
| Subscription revenue | +$10.00 |
| Cellular connectivity (LTE-M plan) | -$2.00 |
| Cloud (ingest, store, serve) | -$0.30 |
| Support and overhead (allocated) | -$1.70 |
| Gross margin | +$6.00 |
Worked example: The device costs $40 to build and is given away. At $6/month margin, hardware payback is $40 / $6 = about 7 months. Only after month 7 does the device make money. Now change the reporting rate: a tracker reporting every 5 minutes sends about 288 messages/day, or roughly 1.7 MB/month. Switch it to every minute and data rises about 5x, pushing connectivity toward $4-$5 and cutting the margin roughly in half, which nearly doubles the payback period. The product decision “how often does it report?” is directly a financial decision, because message frequency drives the connectivity line.
Use this table as a control surface during product review. The team should not approve a reporting interval, roaming SIM plan, dashboard retention period, or support SLA without showing which line item changes. LTE-M coverage may be essential for containers that travel outside Wi-Fi range, but the plan must include roaming policy, overage handling, inactive-device suspension, and firmware behavior when the device cannot attach. A “better” technical setting can be a worse business setting if it adds cost that customers will not pay for.
Also separate gross margin from payback and LTV. Gross margin answers whether one active month is profitable. Payback answers how many active months are needed to recover the device subsidy. LTV answers whether the expected customer life covers subsidy, customer acquisition cost, replacements, support, refunds, and cloud operations. A healthy pilot should report all three, with sensitivity cases for churn, battery replacement, lost devices, and lower-than-expected utilization.
38.6 Asset Churn Risk
Subsidised hardware creates a hidden dependency on retention. Because the device only starts earning after the roughly 7-month payback, a customer who cancels in month 3 leaves the business at a loss: the subsidy was never recovered. This is why churn, not headline growth, is the number that decides these models. High churn among short-lived subscribers can make every new device a money-loser even as the subscriber count climbs.
The mechanism forces specific design and pricing choices: lengthen expected life with rugged hardware and long battery life, reduce the subsidy or add a modest hardware fee to shorten payback, or add a minimum-term contract so a device cannot churn before it breaks even. Each is a lever on the same equation: get customers past payback before they leave. A model that ignores churn can show growing revenue while quietly losing money on every subsidised unit that cancels early.
Worked example: Two cohorts of 1,000 devices each carry a $40 subsidy and $6/month margin, so payback takes about 7 months. Cohort A’s customers stay 24 months on average, so each nets about 24 x $6 - $40 = $104 in lifetime margin. Cohort B churns at 4 months average, before payback, so each device loses about $16: only $24 of margin against the $40 subsidy. Same product, same price; the churn rate flips the business from profit to loss. That is why the case’s real lesson is retention economics, not the demo.
Under the hood, the business metric depends on telemetry quality. The backend should keep a device lifecycle state separate from billing state: manufactured, provisioned, shipped, activated, attached to network, reporting, suspended, lost, replaced, cancelled, refurbished, or decommissioned. MQTT or HTTPS event ingestion, SIM or eSIM account records, warehouse shipment data, billing records, and support tickets all need a shared device identifier so finance can reconcile active devices with actual network and cloud cost.
Cost instrumentation should be designed into the platform. Tag messages by customer, device, firmware version, reporting profile, region, and network plan before they enter services such as AWS IoT Core, Azure IoT Hub, object storage, stream processing, and analytics warehouses. Without those tags, the team cannot tell whether margin erosion came from one enterprise customer, a bad firmware retry loop, roaming traffic, dashboard queries, or a pricing assumption that was never true.
38.7 Under-the-Hood Knowledge Check
38.8 What To Remember
Subsidised connected-device models are not validated by activations alone. They need retained billable devices, per-device margin, payback visibility, and lifecycle telemetry that proves whether each device has moved from subsidy recovery into profit.
38.9 See Also
- IoT Business Model Case Studies - compares the case patterns that motivate this contract.
- Financial Metrics - defines LTV, CAC, margin, and payback language.
- Pricing Strategies - connects the unit economics to pricing choices.