35 IoT Unit Economics Metrics Contracts
35.1 Start With the Story
Begin with one deployed device and ask whether it earns or consumes value over time. This contract chapter makes unit economics explicit so device cost, cloud cost, service labor, replacement risk, and recurring revenue can be checked before the fleet scales.
35.2 Learning Objectives
After this page, you should be able to:
- Explain why IoT financial metrics must include hardware, connectivity, cloud, support, warranty, and field-service costs.
- Separate one-time hardware margin from recurring service contribution margin.
- Build cohort metrics from acquisition, activation, recurring revenue, churn, support load, returns, and data cost.
- Identify the telemetry, billing, support, and operations records needed for reliable LTV, CAC, payback, and TCO calculations.
- Use cost attribution to decide when pricing, packaging, onboarding, or service levels need to change.
35.3 Why This Follows Financial Metrics
Financial Metrics introduces LTV, CAC, ARPU, churn, payback, revenue projections, and total cost of ownership. This page isolates the data contract underneath those metrics: an IoT business cannot trust unit economics until product telemetry, billing records, support work, device lifecycle state, and cloud cost drivers agree at the customer, cohort, and device level.
Use it when a business model review reports healthy ARR or LTV:CAC but does not show hardware subsidy, installation cost, SIM data, message volume, storage retention, support load, warranty returns, field visits, and churn by cohort.
35.4 Hardware, Cloud, Ops Economics
IoT financial metrics are not just SaaS metrics with devices attached. The business may pay for hardware manufacturing, installation, connectivity, cloud ingestion, long-term storage, warranty returns, support calls, firmware maintenance, security updates, and field service. Those costs change the meaning of margin, LTV, CAC, and payback. A smart lock, fleet tracker, industrial vibration sensor, and cold-chain monitor may all report monthly recurring revenue, but each has a different bill of materials, installation pattern, support risk, and data-cost curve.
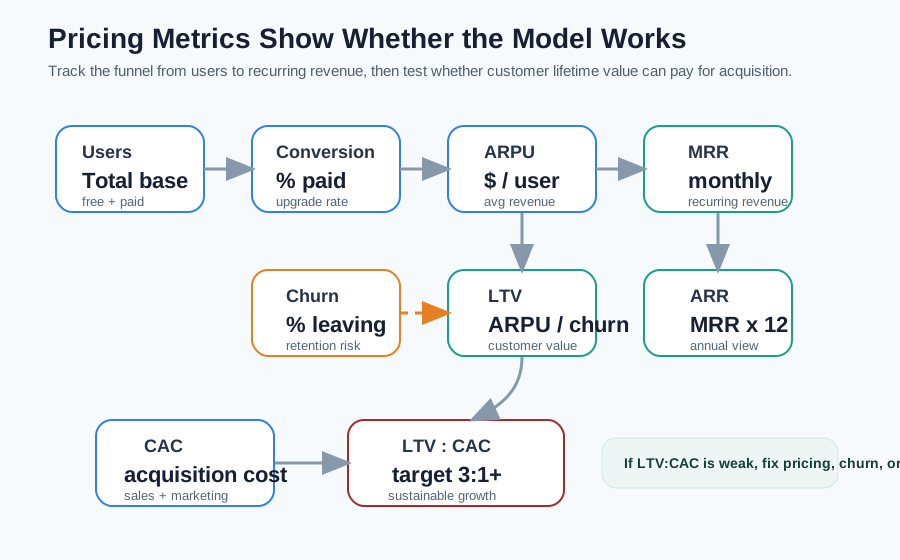
A connected product can look healthy if revenue is counted but device subsidy, SIM data, video storage, message processing, truck rolls, and support labor are hidden. A useful financial model separates one-time hardware margin from recurring service contribution margin, then checks whether retention and expansion can pay back acquisition and deployment costs. It also separates provider economics from customer economics. The provider may see attractive ARR while the customer sees integration labor, training time, compliance review, cellular coverage work, and workflow disruption that delay realized value.
The practical question is not “is the subscription price high enough?” but “which customer cohort can be served profitably at the promised service level?” A pilot sold through an enterprise sales team, a self-serve SMB plan, and an OEM bundle can have different CAC, payback, support load, and expansion paths even if the devices and dashboard are identical. Treat financial metrics as a product design constraint: if the model cannot explain the cost of keeping devices secure, connected, and useful after launch, the business case is incomplete.
- LTV: Recurring contribution over the customer life, after churn, gross margin, and cost-to-serve are included.
- CAC: Sales, marketing, demos, pilots, partner commissions, installation subsidies, and onboarding needed to win a customer.
- TCO: The customer-side and provider-side costs that continue after the device is activated.
35.5 Cohorts and Cost Drivers
Start with a cohort: customers or devices activated in the same month, channel, plan, segment, or region. Track activation rate, paid conversion, ARPU or ARPA, gross margin, churn, net revenue retention, support contacts, device returns, and data cost over time. Cohorts reveal whether a channel is profitable or simply producing short-lived customers. For example, a distributor-led agriculture cohort may have lower CAC but higher support cost during irrigation season, while a direct enterprise manufacturing cohort may have high CAC, longer payback, and stronger expansion revenue once the integration is stable.
IoT products need cost-driver metrics beside revenue metrics. For each customer segment, estimate messages per device, storage GB per month, video minutes retained, API calls, firmware-download volume, notification volume, cellular data, replacement rate, warranty reserve, and support minutes. These numbers explain why two customers on the same plan can have very different margins. A pricing review should include a unit-cost sheet for AWS IoT Core or Azure IoT Hub messages, object storage, warehouse queries, SMS or push notifications, OTA downloads, observability retention, and human support. Without those drivers, discounting decisions are guesses.
- Separate revenue streams. Track hardware revenue, subscription revenue, usage revenue, service fees, partner revenue, and professional services separately.
- Compute contribution margin. Subtract cloud COGS, connectivity, payment fees, support, warranty, and field operations before calculating LTV.
- Watch retention quality. Compare logo retention, gross revenue retention, net revenue retention, device activity, and alert acknowledgement.
- Use payback discipline. Calculate CAC payback using contribution margin, not top-line revenue, especially when hardware is subsidized.
A reliable practitioner workflow produces one review table per cohort: acquired accounts, activated devices, paid attach rate, monthly recurring revenue, gross margin, churn, expansion, support hours, returns, and payback month. Finance can own the definitions, but product and engineering must own the signals that feed them. If a customer is paying but devices are inactive, alerts are ignored, or onboarding is incomplete, the cohort is carrying future churn risk that may not appear in invoices yet.
Use the table to make explicit decisions. Raise price when high-usage customers create negative margin. Add an overage tier when data volume varies widely. Invest in onboarding when early activation predicts retention. Rework packaging when support tickets cluster around one feature. Pause paid acquisition when CAC payback drifts beyond the target window. The metric is only useful when it changes a roadmap, a sales motion, or a service-level promise.
35.6 Reliable Event and Billing Data
Financial metrics depend on product telemetry and billing records agreeing. The platform needs durable customer ids, account ids, device ids, plan ids, activation timestamps, usage events, invoice lines, refund events, support tickets, warranty replacements, and cancellation reasons. Without this join, ARPU, churn, and LTV become spreadsheet guesses. The same physical device may be sold by a reseller, assigned to a site, transferred to another account, replaced under warranty, and later reactivated, so identity and lifecycle state must be modeled deliberately.
Cost attribution is equally important. Message brokers, IoT hubs, object storage, time-series databases, data warehouses, video processing, notification services, and observability tools can each create recurring costs. Teams often combine usage from systems such as AWS IoT Core, Azure IoT Hub, S3, BigQuery, Snowflake, TimescaleDB, Stripe, Zendesk, Salesforce, or a CMMS/EAM platform to understand cost-to-serve. The data pipeline should preserve the pricing dimension that matters: device count, message count, payload size, retained days, query volume, alert count, support case, field visit, or entitlement.
Under the hood, this usually means a governed metrics mart rather than a dashboard-only spreadsheet. Raw telemetry lands with device and account identifiers. Billing systems provide invoices, credits, discounts, renewals, and plan changes. Support and field-service tools provide tickets, truck rolls, parts, and warranty outcomes. A transformation layer such as dbt, Spark, SQL models, or warehouse views maps those events into cohort tables with tested definitions for MRR, ARR, gross margin, logo churn, gross revenue retention, net revenue retention, CAC payback, and LTV:CAC. Version those definitions because a small change in churn or margin logic can change investment decisions.
Financial health also has operational signals. A rising cloud bill may be acceptable if paid usage and retention rise faster. It is dangerous if inactive devices still stream data, support tickets climb, firmware failures cause returns, or one customer segment uses far more storage than pricing assumed. Metrics should trigger product decisions, not just board slides. Good monitoring therefore includes anomaly checks for unbilled usage, inactive-but-chatty devices, duplicate invoice lines, missing cancellation reasons, unsupported firmware cohorts, and customers whose service cost exceeds their plan margin.
- Revenue data: Invoice line, plan, usage unit, discount, refund, expansion, contraction, renewal, and cancellation reason.
- Product data: Activation, active device count, message volume, storage, alerts, API usage, firmware version, and failure events.
- Operations data: Support contacts, replacement shipments, field visits, onboarding effort, SLA credits, and root-cause categories.
35.7 Knowledge Check
35.8 Summary
Unit economics only become trustworthy when revenue, device lifecycle, usage, support, warranty, and cloud-cost signals describe the same cohort. The core review asks whether a customer segment can be acquired, activated, retained, supported, and expanded at a contribution margin that pays back the full acquisition and deployment cost.
35.9 What’s Next
Next, GTM strategy connects these unit-economics signals to channel choice, sales motion, onboarding design, and expansion planning.