7 Data Encoding and Codecs
IoT data encoding, IoT codecs, telemetry formats, media streams IoT, IoT data storage formats
7.1 Start With the Data Nobody Can Read
A camera feed, a microphone clip, and a temperature stream can all reach storage successfully and still be useless if the next system cannot decode them with the right time, units, and metadata. Encoding choices matter because they decide whether a dashboard, replay tool, or investigation can turn stored bytes back into trustworthy evidence.
7.2 In 60 Seconds
Visualization depends on data arriving in a form that can be decoded, trusted, aligned in time, and displayed. Encoding is the way data is represented for transport or storage. A codec is a method for encoding and decoding signals such as audio, image, or video. A container is a file or stream wrapper that can hold encoded media and metadata.
For IoT visualization, encoding choices affect:
- dashboard latency
- network use
- edge compute load
- browser or tool compatibility
- data fidelity
- timestamp accuracy
- storage and replay
- whether the visualization can explain uncertainty or stale state
The right choice starts with the visualization question. A fault dashboard, a wildlife microphone, a security camera, and a long-term analytics archive need different encodings.
7.3 Learning Objectives
By the end of this chapter, you will be able to:
- distinguish data encoding, codec, and container
- choose between human-readable and compact telemetry encodings
- explain lossy and lossless encoding tradeoffs for IoT visualization
- identify when media codecs matter for camera, microphone, and image streams
- preserve metadata needed for trustworthy visualizations
- evaluate encoding choices by fidelity, latency, compute, compatibility, and replay needs
7.4 Quick Check: Data Encoding and Codecs
7.5 Encoding, Codec, And Container
These terms are related but not interchangeable.
- Encoding: how data is represented. Examples include JSON, CSV, CBOR, Protocol Buffers, JPEG, PNG, Opus, H.264, and H.265.
- Codec: a coder-decoder used for signals such as audio, image, or video. It compresses data for transport or storage and decodes it for playback or analysis.
- Container: a wrapper that holds encoded streams and metadata. Examples include MP4, WebM, WAV, and Matroska.
Common confusion:
- MP4 is a container, not a video codec.
- H.264 is a video codec, not a container.
- JSON is a telemetry encoding, not a media codec.
- A dashboard may use JSON for sensor values and H.264 for a camera view at the same time.
7.6 Visualization Encoding Pipeline
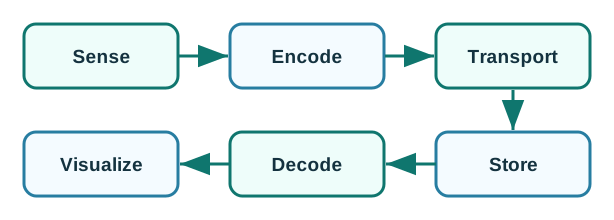
Use Figure 7.1 to check whether the data can be decoded and trusted at every step.
7.7 Telemetry Encodings
Most IoT dashboards begin with telemetry: timestamped records such as temperature, pressure, location, status, battery state, or event counts.
Common options:
- JSON: easy to inspect and widely supported. Good for prototypes, APIs, and debugging. Larger than binary encodings.
- CSV: compact for flat rows and easy to import. Weak for nested state, units, schemas, and event meaning.
- CBOR: compact binary form that maps well to JSON-like structures. Useful when devices need smaller payloads but flexible fields.
- Protocol Buffers: compact schema-based records. Useful when producer and consumer can share a stable schema.
- Apache Arrow or Parquet: useful for analytics and column-oriented storage after ingestion, not usually a constrained-device payload format.
Choose based on the visualization task:
- Human debugging favors readable formats.
- Battery and bandwidth constrained links favor compact formats.
- Long-term analytics favors schema and column structure.
- Mixed-device dashboards need clear versioning and metadata.
7.8 Payload Budget Example
Small payloads change battery life, airtime, and retry behavior. Suppose protocol and security overhead leave 51 bytes of application payload for each uplink. A compact JSON representation of one small reading may cost about 32 bytes, so it fits one reading and leaves little room for timestamp, unit, or quality fields. A CBOR representation at about 18 bytes can fit two comparable readings in the same payload. A raw binary record at about 4 bytes can fit many readings, but only if every receiver already knows the field order, scale factor, byte order, status mapping, and schema version.
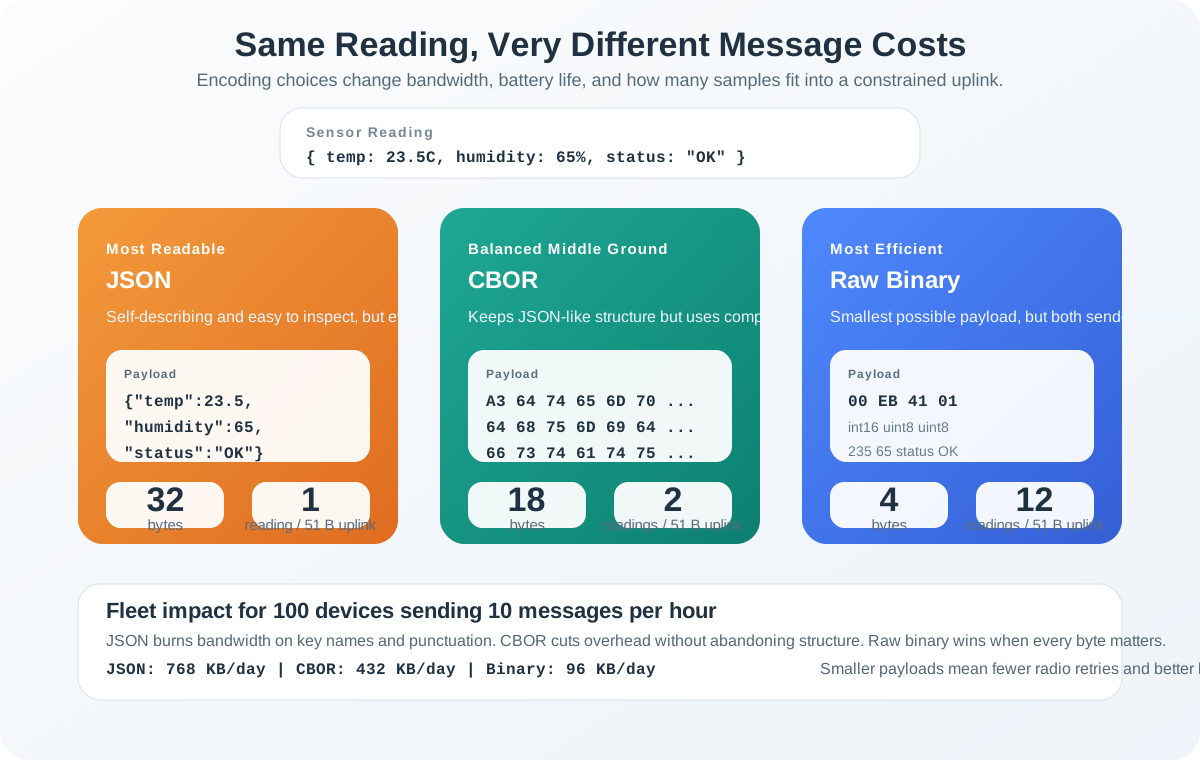
Use Figure 7.2 to avoid the simple but dangerous conclusion that the smallest payload is always best. JSON is easy to inspect during commissioning. CBOR keeps JSON-like structure with less airtime. Raw binary wins only when schema control, decoder compatibility, and rollback behavior are proven.
7.9 Metadata Is Part Of The Encoding
A value without context can mislead the visualization.
Include:
- timestamp and clock source
- unit
- device identity
- sensor type
- location or asset
- sampling interval
- quality flag
- current, stale, estimated, or missing state
- calibration or firmware version when relevant
- coordinate reference for maps
Do not rely on the chart title to carry this information. The data record should preserve enough meaning for the chart, alert, replay, and support path.
7.10 Lossless And Lossy Choices
Lossless encoding preserves the original data exactly after decoding. Lossy encoding discards some information to reduce size or bitrate.
Use lossless or near-lossless approaches when:
- records are used for audit or investigation
- downstream analysis needs exact values
- small changes matter
- calibration or diagnosis is required
- the signal will be transformed more than once
Use lossy approaches when:
- humans are visually inspecting images or video
- bandwidth is limited
- approximate visual quality is acceptable
- the stream must be viewed in real time
- retention length matters more than exact reconstruction
For visualization, the key question is not “Which codec is best?” The key question is “What information must survive decoding for the task?”
7.11 Numeric Time-Series Compression
Time-series storage often gets large savings without losing exact raw values. The trick is exploiting regularity column by column. Timestamps are near-periodic, so delta-of-delta encoding stores the change in the interval rather than every full timestamp. A steady 10-second cadence becomes a long run of zeros after the first values. Numeric values can use Gorilla-style XOR compression: each floating-point value is compared with its predecessor, and because adjacent sensor readings often differ only slightly, the XOR has long runs of leading and trailing zero bits.
This only works well when the storage layout groups similar values together. A column of timestamps, a column of temperatures, and a column of quality flags each give the encoder a predictable pattern. A row that mixes timestamps, JSON blobs, identifiers, units, and arbitrary strings gives the codec much less to exploit.
For a 10-second sensor, timestamp deltas are usually 10, 10, 10, 10. Delta-of-delta stores the change between those deltas: 0, 0, 0 after the first value. If one packet arrives late and the interval becomes 12 seconds, the encoder records a small exception and then returns to zeros when the cadence stabilizes. That is different from storing every full timestamp, and it is still lossless.
Separate three decisions in the storage plan:
- use lossless column compression for the raw audit window so incidents can be replayed exactly;
- use rollups or downsampling only after the team defines which questions no longer need raw samples;
- keep schema and unit metadata beside compressed values so a dashboard can distinguish a physical change from an encoding, unit, or calibration change.
7.12 Media Codecs For IoT Visualization
Media streams include camera video, still images, microphone audio, vibration audio, and spectrogram-like outputs.
A raw-media budget check explains why codecs show up so quickly in IoT systems. A 16 kHz, 14-bit mono audio stream is already about 224 kbps before headers. CD-quality stereo audio is about 1.4 Mbps. A single 1024 by 1024 RGB image is roughly 3 MB before compression, and 720p RGB video at 24 frames per second is above 500 Mbps. Those numbers are not release evidence by themselves, but they force the review to name where compression happens and what information may be lost.
A useful compression review separates the stages. Time-frequency or spatial decomposition exposes structure such as DCT, wavelet, short-time Fourier, or similar transform coefficients. Quantization is the lossy step that spends fewer bits on less important detail. Entropy coding, such as Huffman-style or arithmetic coding, is the lossless packing step that assigns shorter codes to frequent symbols. For audio this may depend on psychoacoustic masking; for images, JPEG-style paths commonly convert RGB display values into luma/chroma channels before discarding or subsampling detail. The deployment record should say whether the lost detail matters for inspection, alarm review, or later audit.
Common image and video choices:
- JPEG: useful for still images where small file size matters and minor visual loss is acceptable.
- PNG: useful for diagrams, masks, labels, or evidence images where exact edges matter.
- MJPEG: simple stream of JPEG frames. Easy to decode but inefficient for continuous video.
- H.264: widely supported video codec for live viewing and browser compatibility.
- H.265: often more compact than H.264 but may require more compute and may have compatibility constraints.
- AV1: efficient modern codec, often better suited to capable edge or cloud processing than small devices.
For video, the review should also name the prediction structure rather than only the codec brand. An I-frame is self-contained enough to become a seek point or recovery point. P-frames predict from earlier pictures, and B-frames can use past and future references, which improves compression but can add buffering and delay. Motion estimation, block size, transform choice, quantization, run-length coding, and entropy coding all affect the same deployment question: whether the retained stream still supports the inspection, control, or audit task. If the product needs low-latency viewing, short recovery after packet loss, or frame-accurate evidence, the GOP length and reference-frame policy belong in the release record.
Common audio choices:
- PCM: uncompressed audio; useful for reference capture and diagnosis but large.
- FLAC: lossless compressed audio for archival or analysis.
- Opus: flexible speech and audio codec with good low-latency behavior.
- AAC: common compressed audio for media playback.
The visualization should state when users are seeing compressed media, sampled media, delayed media, or representative thumbnails.
Quality evaluation should match the media claim. PSNR and SSIM can compare images or video against a reference, but they do not prove that a human operator sees the difference that matters. Audio reviews may use subjective tests such as ABX, ABC/HR, or MUSHRA when listeners must judge audible differences, and objective models such as PEAQ when a perceptual estimate is acceptable for screening. The release note should keep the test method, reference material, codec settings, and pass/fail threshold together; otherwise a single quality score can hide the artifact that breaks the application.
Older multimedia vocabulary is still useful when reviewing legacy demos, SDKs, or vendor claims. Treat the names as evidence prompts rather than as automatic design choices:
- Computer vision: image analysis that should record frame source, model or rule version, latency, and failure examples. A camera demo is not a vision system until the team can name the capture path, preprocessing step, feature or model decision, and the action that follows. Frame cameras and event-style cameras such as dynamic vision sensors create different data streams, so the review should preserve the timing, threshold, and calibration evidence that makes the interpretation reproducible. Libraries such as OpenCV, SimpleCV, or vendor SDKs can shorten implementation, but they do not replace evidence about lighting, motion blur, occlusion, frame rate, false positives, and whether the result is good enough for the IoT decision.
- Camera lab setup: prototype evidence should say which image library stack was installed, which camera device or stream was opened, and how the capture path was tested. A Linux board exercise might use Python imaging libraries, OpenCV or SimpleCV wrappers, and a
/dev/video*camera, but the release record still needs a repeatable camera check, dependency list, failure notes for missing imaging libraries, and any server or scheduled-capture process that makes pictures available remotely. - Native SDKs: platform toolkits, such as an Android NDK or board vendor SDK, that need pinned versions, build flags, and device compatibility evidence.
- Multimedia and home-platform stacks: terms such as multimedia home platform, MIDI, real media, video telephony, DirectX, OpenGL, JavaScript, and QuickTime point to different layers: content format, application API, rendering API, scripting layer, or container/player behavior. The review should name which layer is responsible for decoding, rendering, user interaction, and fallback.
- Interframe coding and delta frames: video compression that stores changes between frames, so loss, seeking, and key-frame interval evidence matter.
- Subsampling and color spaces: reductions such as chroma subsampling or sRGB conversion can save bytes, but the release record should prove that labels, safety colors, and inspection details still survive.
- Display artifacts: tearing, overlay composition, motion-video smoothness, and video mapping are rendering-path issues, not sensor facts. Confirm refresh timing, GPU or browser support, and what happens when the display cannot keep up.
7.13 Codec Decision Map
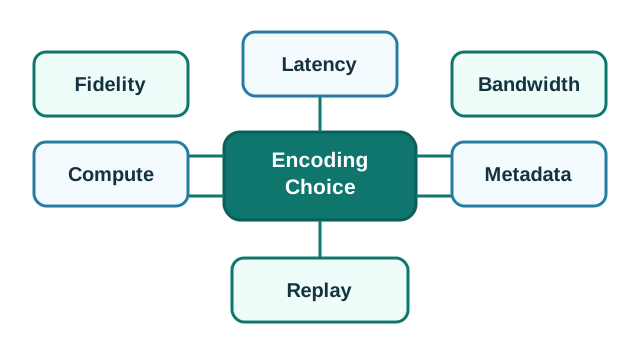
Use Figure 7.3 to compare codec choices before a deployment locks them in.
7.14 Latency And Real-Time Display
Real-time visualization is not only about fast networks. Encoding can add delay.
Check:
- capture delay
- encoding delay
- transport buffering
- broker or server buffering
- decoding delay
- dashboard refresh behavior
- browser playback support
For a live control view, choose formats and settings that preserve timely feedback. For an archive view, higher compression and slower encoding may be acceptable.
7.15 Compatibility And Decode Paths
An encoding choice fails if the receiver cannot decode it reliably.
Check:
- device encoder support
- gateway transcoding needs
- browser playback support
- dashboard library support
- analytics tool support
- mobile device support
- hardware acceleration availability
- fallback format for older clients
Avoid making every viewer depend on a rare codec unless the deployment controls the full device and software stack.
On Android-style endpoints, make the media path explicit in the same way. A MediaPlayer-class wrapper may accept a local file, URI, or URL and hide the decoder details, but the review still needs to record supported formats, buffering behavior, network permissions, error callbacks, and what happens when storage or connectivity disappears. An AudioManager-style service owns audio focus and output routing, so a kiosk, wearable, or gateway display should prove whether alerts, calls, media streams, Bluetooth devices, and other apps can interrupt or duck each other safely. Treat those classes as responsibility boundaries, not as proof that playback will be reliable in the final device context.
7.16 Worked Example: Environmental Dashboard
Scenario:
- A building dashboard shows temperature, humidity, occupancy, and device health.
- Operators need current state, trend, and stale-data awareness.
Encoding approach:
- Use schema-backed telemetry records for device readings.
- Include timestamp, unit, room, device identity, and quality state.
- Keep current dashboard payloads small.
- Store historical records in an analytics-friendly format after ingestion.
- Make stale and missing state explicit rather than treating missing values as zero.
Visualization result:
- The dashboard can show current values, trend history, stale readings, and device health without guessing what each field means.
7.17 Worked Example: Remote Camera View
Scenario:
- A remote camera shows periodic images and occasional live video.
- Users need enough detail to inspect events, but the link is constrained.
Encoding approach:
- Use still images or low frame rate previews for routine monitoring.
- Use a widely supported video codec for live inspection.
- Preserve event time, camera identity, location, and quality state with the media.
- Store key frames or clips for replay if the event needs review.
- Show users whether the view is live, delayed, or a saved clip.
Visualization result:
- Users can distinguish a current stream from replay, and the system avoids sending more media than the task requires.
7.18 Review Checklist
Before accepting a visualization encoding design, confirm:
- the visualization question is clear
- the encoding can carry timestamp, unit, identity, and quality state
- the decoder path is known for every viewer
- lossy choices preserve the information needed for the task
- real-time views account for encoding and buffering delay
- archive formats support replay and analysis
- stale, missing, estimated, and current states remain distinguishable
- fallback behavior is defined when a client cannot decode a stream
7.19 Common Defects
Watch for:
- Container-codec confusion: assuming MP4 support means every video stream inside it will play.
- Missing metadata: plotting values without units, device identity, or freshness.
- Over-readable payloads: using large text payloads on constrained links only because they are easy to debug.
- Over-compact payloads: using binary records without schema, versioning, or inspection tools.
- Lossy analysis damage: compressing signals in a way that removes features needed by analytics.
- Hidden delay: presenting delayed media as if it were live.
- No fallback: choosing a codec that some dashboards or browsers cannot decode.
7.20 Knowledge Check
7.21 Matching Quiz
7.22 Ordering Quiz
7.23 Summary
Data encoding and codecs shape what an IoT visualization can show, how quickly it can show it, and how much users can trust it. Telemetry records need schema, timestamp, unit, identity, and quality state. Media streams need codec and container choices that match fidelity, latency, compute, compatibility, and replay needs.
7.24 Key Takeaway
Visualization codecs should preserve time, units, quality, and structure so dashboards do not misrepresent telemetry.
7.25 Concept Relationships
This chapter connects to:
- Visualization Overview for why data must be understandable quickly.
- Visualization Types for matching data shape to chart type.
- Dashboard Design for presenting encoded data safely.
- Real-Time Visualization for latency and streaming behavior.
- Visualization Tools for tool compatibility.
7.26 What’s Next
Continue with:
- Visualization Tools, if you need to choose dashboard or stream tooling.
- Real-Time Visualization, if encoding delay affects the view.
- Dashboard Design, if users need to interpret encoded telemetry safely.