Host and gateway stacks
aiocoap (Python), libcoap (C + CLI), Californium (Java) run on Linux hosts, gateways, and cloud bridges.
A lab can appear to work because the browser prints a value, while the packet trace shows token confusion, wasteful Confirmable messages, stale cache data, or repeated DTLS handshakes. The implementation is not accepted until the trace explains the behavior.
This page turns the lab into a release contract: choose the stack, map each handler, capture the response evidence, then debug by Message ID, Token, options, Max-Age, Observe state, and security session records.
After this page, you should be able to:
CoAP Implementation Labs gives you runnable Python and ESP32 code. This page narrows in on the implementation contract behind those examples: which stack owns the protocol machinery, what each handler must prove, how the client accepts a response, and what a packet trace should show when the implementation is correct.
The CoAP implementation proof stays concrete: a CoAP implementation is accepted only when a working handler is tied to URI, method, response code, payload, Token, Message ID, and trace evidence.
Use it when you are turning a classroom lab into a repeatable acceptance test, comparing Python and embedded implementations, debugging Observe notifications, or reviewing whether a constrained deployment is wasting battery through avoidable ACKs or repeated security handshakes.
Almost no production code assembles the 4-byte header and delta-encoded options by hand. A CoAP library does the messaging layer for you: Confirmable retransmission, deduplication, token generation, and option encoding. Your code deals in resources, methods, and payloads. On general-purpose hosts and gateways the common stacks are aiocoap (Python, asyncio — the library these labs use), libcoap (C, which also ships the handy coap-client CLI), and Eclipse Californium (Java).
On microcontrollers you reach for stacks sized to kilobytes of RAM: RIOT's gcoap and nanocoap, Contiki-NG's Erbium, Zephyr's CoAP subsystem, and Arduino/ESP32 libraries such as coap-simple used later in this chapter. They implement the same RFC 7252 on the wire, so an aiocoap client can talk to an ESP32 server — interoperability is the whole point of the standard.
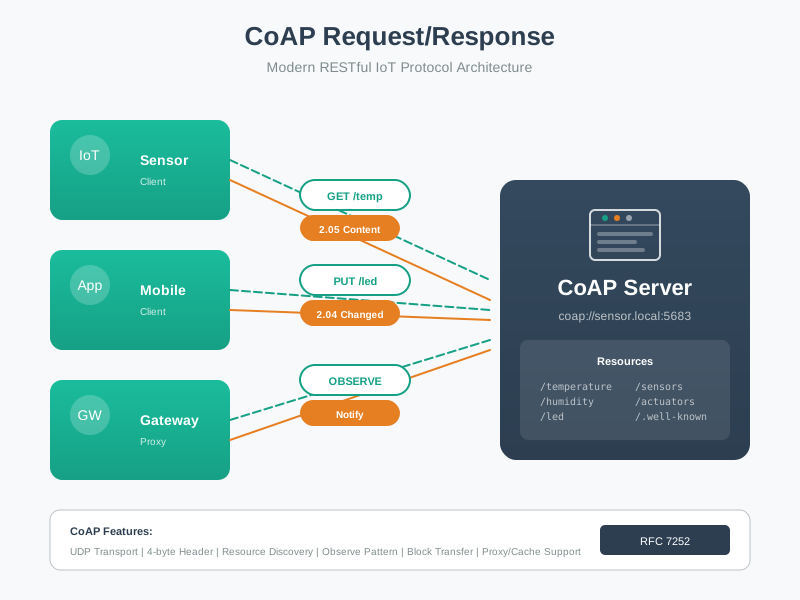
Treat each lab as a contract between a client command, a URI, a handler, and the response evidence. A laptop might run coap-client -m get coap://node/temperature and expect 2.05 Content with a numeric payload; the same server might accept a PUT /led from a mobile tool and return 2.04 Changed; an Observe registration keeps the same Token while notifications report later temperature values. That framing keeps the code examples from becoming copy-paste snippets: every run should leave a response code, a payload sample, and a packet trace you can compare with the handler you wrote.
aiocoap (Python), libcoap (C + CLI), Californium (Java) run on Linux hosts, gateways, and cloud bridges.
RIOT gcoap/nanocoap, Contiki-NG Erbium, Zephyr CoAP, and ESP/Arduino libraries fit constrained nodes.
You register a handler per URI path and method; the library routes incoming requests to it.
You issue a request to a coap:// URI and read the response code and payload back.
On the server side you attach behavior to a path. In aiocoap you subclass Resource and implement render_get, render_put, and so on; the library reads the incoming Uri-Path options and the method Code and dispatches to the right method, which returns a representation plus a response code (a read returns 2.05 Content, a write returns 2.04 Changed). On the client side you send a request to a coap:// URI and inspect two things on what comes back: response.code to branch on success or error, and response.payload for the representation. For Observe you register once and then iterate the stream of notifications instead of polling.
Verify on the wire, not just in your logs. A small toolkit proves the exchange is doing what you think.
Make the acceptance test small enough to repeat after every edit. Start the server on UDP port 5683, run one GET for the sensor resource, one PUT for the actuator resource, one deliberately bad path, and one Observe registration if the stack supports it. The expected record is concrete: GET returns 2.05 plus a parseable value, PUT returns 2.04 or another documented success code, the bad path returns 4.04, and the Observe trace repeats the Token across notifications. If an ESP32 version and a Python version expose the same resource contract, use the same client checklist for both; only the build and deployment step changes.
The single most common implementation bug in hand-rolled correlation is matching responses by Message ID instead of Token. A piggybacked ACK does reuse the request's Message ID, which lulls people into keying on it — but a separate response and every Observe notification arrive as new messages with different Message IDs and the same Token. Code that keys on Message ID silently drops those. The rule is simple: correlate application responses by Token; the Message ID is only for message-layer ACK and duplicate handling. Good libraries already do this, which is a strong reason to use one.
Test for the bug directly: open an Observe and watch the notifications in Wireshark. You will see one Token repeated across notifications while the Message ID changes each time. If your handler only fires on the first notification, you are matching on the Message ID.
Three deployment pitfalls recur, and each is visible in a capture. First, using Confirmable for every message drains batteries — the trace shows an ACK round trip per message; send disposable telemetry as NON. Second, ignoring proxy cache semantics serves stale readings — a cache honors your Max-Age, so an over-long value returns aged data; advertise freshness that matches the real change rate. Third, re-running the DTLS handshake per request wastes energy — the capture shows a full ClientHello-through-Finished before each request; keep the session open and reuse it.
Notifications and separate responses share the Token, not the Message ID; key your dispatch on the Token.
Reserve CON for messages whose loss is unsafe; frequent readings as NON save radio-on energy.
Set freshness to the true change rate so caches and proxies never serve stale readings.
Amortize the handshake across many requests instead of renegotiating on every call.
Before shipping a CoAP implementation lab or prototype, verify these records:
response.code before trusting response.payload, and tests include at least one success path and one documented error path.Return to CoAP Implementation Labs, then continue to CoAP Advanced Features for block-wise transfer, discovery, caching, and multicast.