11 Lab: Mobile PWA and Audio Sensing
mobile PWA lab, audio sensing lab, service worker lab, Web Audio API lab, mobile sensing validation, offline sensor records
11.1 Start With the Offline Audio Story
The useful story is not just that a phone app runs. It is that the app keeps a record when connectivity changes, asks for microphone access honestly, stores the feature it computed, and explains why the audio evidence is bounded.
11.2 In 60 Seconds
These labs show how a phone can collect sensor observations through a web app while keeping the workflow reviewable. The PWA lab focuses on install metadata, cached app resources, queued records, and clear sync evidence. The audio lab focuses on microphone permission, relative audio-level features, phone placement, calibration notes, and scoped interpretation.
The goal is not to build a generic PWA tutorial or claim professional audio measurement. The goal is to produce lab evidence that another reviewer can inspect: what was collected, when, with what permission state, under what context, and with what limits.

Phoebe’s Why
Sampling multiplies the incoming sound wave by a train of evenly spaced clock pulses, and that multiplication makes copies of the signal’s spectrum repeat every sample-rate interval. A tone above this lab’s own 24 kHz Nyquist ceiling does not get ignored by that math – its copy folds back down into the audible band and lands on top of a real, lower frequency, indistinguishable from it. The lab-report body’s claim that “a 30 kHz signal captured at 48 kHz simply cannot appear in the spectrum” is only true because the phone’s own microphone hardware includes an analog low-pass filter ahead of the ADC that removes content above roughly the Nyquist frequency before this folding math ever runs. That filter is doing real, silent work every time the workbench below loads a clean tone; without it, an ultrasonic source in the room would not disappear from the reading, it would masquerade as an ordinary in-band sound.
The Derivation
Content above the Nyquist ceiling reappears (aliases) at a folded frequency:
\[f_{alias} = \left| f - f_s \cdot \mathrm{round}\!\left(\frac{f}{f_s}\right) \right|\]
Independently, the derived level this lab reads is a ratio to the loudest representable code, decibels full scale:
\[L_{dBFS} = 20\log_{10}\!\left(\frac{\text{amplitude}}{\text{full-scale amplitude}}\right)\]
An \(N\)-bit capture’s own rounding noise sets a floor below that same full scale, from the quantization-noise result used elsewhere in this course, \(\mathrm{SNR}_{dB}=6.02N+1.76\): readings within about that many dB of \(0\) dBFS are consuming the quantizer’s own noise, not the acoustic scene.
Worked Numbers: This Lab’s Own 48 kHz Context
- This chapter’s own Nyquist ceiling: \(f_s/2=48{,}000/2=24{,}000\) Hz, matching the workbench instructions above exactly.
- An unfiltered 30 kHz tone folded at 48 kHz: \(|30{,}000-48{,}000\times\mathrm{round}(30{,}000/48{,}000)|=|30{,}000-48{,}000|=18{,}000\) Hz – a clean, audible-looking 18 kHz reading, not silence.
- A 26 kHz tone, just past the ceiling: \(|26{,}000-48{,}000|=22{,}000\) Hz – still folds, but lands close enough to the true tone that a careless reviewer might not notice the mirroring.
- Noise floor for a common 16-bit capture path: \(\mathrm{SNR}=6.02(16)+1.76=98.1\) dB, so the quantization floor sits at about \(-98.1\) dBFS. A relative-level reading closer to 0 dBFS than that is real signal; a reading pinned near \(-98\) dBFS is measuring the converter, not the room.
- What this means for the lab record: “relative (dB full scale), not absolute SPL” is not just a legal disclaimer, it is a statement about where these two floors sit – the anti-alias filter’s cutoff and the quantizer’s noise floor – both of which the lab report should treat as fixed properties of the capture chain, not of the sound being measured.
11.3 Learning Objectives
By the end of this chapter, you will be able to:
- Plan a mobile PWA lab that preserves records when connectivity is unavailable.
- Identify the evidence needed for manifest, service worker, local queue, and sync behavior.
- Review a microphone-based audio lab without overclaiming measurement precision.
- Record permission state, phone placement, feature extraction, and validation notes.
- Decide what a PWA/audio lab result can and cannot support.
11.4 Quick Check: PWA Audio
11.5 Minimum Viable Understanding
- A PWA lab should keep the app shell usable and preserve queued records until they are reviewed or sent.
- A service worker supports cached resources, but it does not make sensor data trustworthy by itself.
- Audio API readings are best treated as relative features unless the lab includes a documented calibration reference.
- Microphone permission, phone placement, and surrounding context are part of the evidence.
- A lab report should include exclusions and retest triggers, not only screenshots of a working app.
11.6 Prerequisites
Review these chapters first:
- Mobile Sensor APIs: API permission, platform support, and data quality checks.
- Mobile Phone as a Sensor: phone sensors as part of an IoT sensing system.
- Mobile Sensors Labs: how mobile lab outputs are assessed.
11.7 Lab Scope
This chapter covers two practical lab workflows:
- PWA sensing workflow: a browser-based mobile app with install metadata, cached app resources, and queued sensor records.
- Audio sensing workflow: a microphone-permission workflow that extracts a relative audio-level feature and records the evidence needed to interpret it.
Do not turn either lab into a broad platform claim. The result should be a bounded record that says what was tested, what worked, what failed, and what remains outside the claim.
11.8 PWA Lab Workflow
A reviewable PWA sensing lab has four pieces:
- Manifest: name, icons, display mode, and start URL are present and consistent with the lab.
- Cached resources: the app shell can reload without fetching every asset again.
- Queued records: observations are stored locally with units, timestamp, source, and permission state.
- Sync evidence: the lab records whether records stayed queued, were sent, or failed to send.
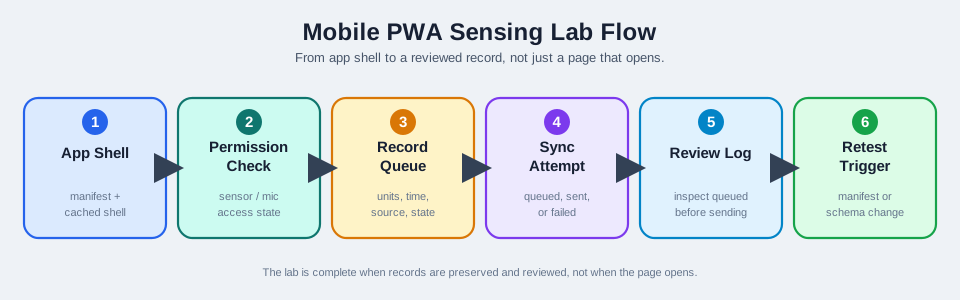
Use Figure 11.1 as a checklist. The lab is not complete if it only shows that the page opens; it must show how records are preserved and reviewed.
11.8.1 PWA Evidence To Capture
Record:
- The app route or install entry point used in the lab.
- Which app resources were expected to be available after the first load.
- What local storage mechanism held queued records.
- A sample record with source, units, timestamp, permission state, and context.
- What happened when a sync attempt succeeded, failed, or was deferred.
- How duplicate or stale queued records were avoided.
- The retest trigger for manifest, service worker, or record schema changes.
11.8.2 PWA Review Prompts
Ask:
- Can a learner explain what remains available when the network is unavailable?
- Are queued records inspectable before they are sent?
- Does the app show a clear state for available, unavailable, queued, sent, and failed records?
- Does the lab avoid implying that a service worker alone validates sensor readings?
- Does the record schema preserve the meaning of the measurement?
11.9 Audio Lab Workflow
The audio lab uses microphone access to derive a relative audio-level feature. The review should avoid claiming calibrated sound level unless the lab includes a reference procedure and a documented offset or calibration note.
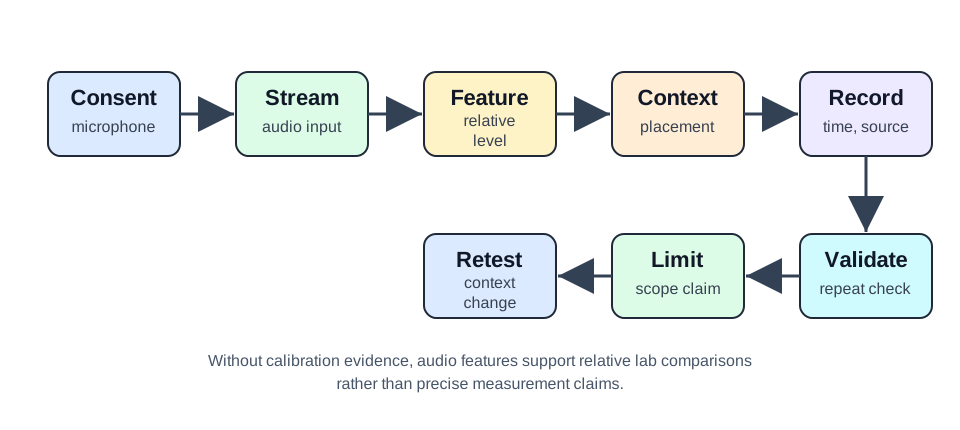
Use Figure 11.2 to keep the lab focused on evidence. The feature can support comparisons inside the lab, but it should not be presented as a professional sound measurement without calibration evidence.
11.9.1 Audio Evidence To Capture
Record:
- The user action that requested microphone permission.
- Whether permission was granted, denied, unavailable, or interrupted.
- The feature extracted from the audio stream, such as a relative level or frequency summary.
- The phone placement and surrounding context during the reading.
- Whether the result was a raw stream, a derived feature, or a short sample.
- A validation note, such as a repeated quiet/active comparison under the same placement.
- The limits of interpretation.
11.9.2 Audio Review Prompts
Ask:
- Does the lab state that the audio feature is relative unless calibrated?
- Is microphone permission handled visibly?
- Does the record avoid saving more audio data than the lab question requires?
- Is phone placement stable enough for comparisons?
- Are quiet, active, interrupted, and denied states handled?
11.10 Combined Lab Report
A concise report should include:
- Question: what the lab was trying to observe.
- API path: PWA shell, storage path, audio API, and any other sensor API used.
- Permission state: granted, denied, unavailable, or interrupted.
- Record schema: fields, units, timestamp, source, and context.
- Queue behavior: queued, sent, failed, or deferred.
- Validation evidence: repeated observation, comparison condition, or manual check.
- Exclusions: claims the lab does not support.
- Retest trigger: what change requires the lab to be rerun.
11.11 Worked Example: Audio Field Note
Suppose a learner builds a phone page that lets a user make a short field note with a relative audio-level feature.
Question: was the inspection location quieter or louder than a previous check made with the same phone placement?
PWA evidence:
- The page loads after first use.
- The record is queued locally when network access is unavailable.
- The queued record has timestamp, source, permission state, context, and feature value.
Audio evidence:
- The microphone request happens after a user action.
- The reading is stored as a derived relative feature, not as a broad environmental claim.
- The phone placement is documented.
- A repeated quiet/active comparison is recorded.
Decision:
The lab supports a scoped comparison inside the exercise. It does not support precise sound-level reporting, public compliance claims, or broad environmental conclusions.
11.12 Common Mistakes
- Treating a PWA manifest as proof that sensor records are preserved.
- Forgetting to inspect the queued record before sync.
- Hiding permission denial behind a generic error message.
- Recording audio features without phone placement or context.
- Calling relative audio features calibrated measurements without reference evidence.
- Keeping raw audio when a derived feature would answer the lab question.
- Omitting stop conditions for sensing and record collection.
- Linking to resource lists instead of documenting lab evidence.
11.13 Reproduce the Audio Math
Run it: Before the knowledge checks, reproduce the audio-lab math yourself in the synthesized workbench below. Load Speech-band tone to read a relative level as RMS and dB, then find the tone as the orange peak in the computed FFT. Switch the FFT size between 1024, 2048, and 4096 at 48 kHz and watch the bin width and window duration change while df x T stays 1 – the 2048-point setting reproduces the 23.4375 Hz bins and 42.7 ms window from Ada’s audit exactly. No microphone is used; every value is computed from the synthesized buffer, so the numbers are the same each time you run it.
11.14 Knowledge Check
11.15 Matching Quiz
11.16 Ordering Quiz
Turning a Phone Mic Into a Frequency Sensor
A phone microphone becomes a measurement instrument through the Web Audio API. The browser captures sound with getUserMedia, feeds the stream into an AudioContext running at a fixed sample rate, and an AnalyserNode runs a Fast Fourier Transform (FFT) that converts the raw waveform into a spectrum — how much energy sits at each frequency.
That spectrum is what makes audio a sensor rather than a recording: a hum, a whistle, a machine's vibration each leave a signature at specific frequencies. But every link in the capture chain — sample rate, FFT size, and the browser's own audio processing — shapes what you can and cannot measure.
Intuition: the waveform is like a chord played on a piano; the FFT is the trained ear that names which notes are sounding and how loud. The spectrum tells you what frequencies are present, not just that there is noise.
A reviewable lab starts with a permissioned microphone stream, not a hidden recording. The learner should document the action that requested access, the permission state returned by the browser, and the exact feature extracted from the stream. For a simple sensing exercise, the safest artifact is usually a derived feature such as a short-time spectrum, dominant-frequency band, or relative level summary. That preserves evidence for the lab question while avoiding unnecessary raw-audio retention.
The capture chain also needs metadata. A spectrum without sample rate, FFT size, timestamp, device placement, and browser-processing settings is hard to compare later. If two readings claim that a pump room became louder, the record must show that the same phone position, analysis settings, and validation routine were used. Otherwise the difference may come from the browser, the user holding the phone differently, or a changed analysis window rather than a changed environment.
Overview Knowledge Check
Sample Rate, Nyquist, and Bin Resolution
Two settings decide what the spectrum can show — the context sample rate and the FFT size:
highest analysable frequency = sampleRate / 2        (Nyquist)
frequency resolution (per bin) = sampleRate / fftSize
number of bins = fftSize / 2  (frequencyBinCount)
Worked example: a 48 kHz context with a 2048-point FFT
sampleRate = 48000 Hz, fftSize = 2048

  Nyquist (max frequency) = 48000 / 2 = 24000 Hz
  bins = 2048 / 2 = 1024 bins spanning 0..24 kHz
  resolution per bin = 48000 / 2048 = 23.4 Hz

So this spectrum can distinguish tones ~23 Hz apart,
up to 24 kHz. To tell a 100 Hz hum from a 110 Hz one
you are fine; to resolve 100 vs 105 Hz you need a
larger fftSize for finer bins.
The Nyquist limit is the same rule that governs any sampled sensor: you cannot analyse a frequency above half the sample rate. Audio just makes it audible — a 30 kHz signal captured at 48 kHz simply cannot appear in the spectrum.
The FFT size should follow the lab question. At 48 kHz, a 2048-point FFT uses a 42.7 ms window and gives 23.4 Hz bins. A 4096-point FFT uses an 85.3 ms window and gives 11.7 Hz bins. The larger window is better when the lab needs to separate a 100 Hz motor hum from a nearby 120 Hz electrical hum, because the bins are narrower. The smaller window is better when the lab cares about when a short clap, knock, or machine event happened, because the spectrum updates with less delay.
A practical report should name the selected sample rate and FFT size, then connect them to the evidence claim. For example, "48 kHz with fftSize 4096 gives about 11.7 Hz per bin, so the lab can compare broad low-frequency hum bands but not certify an exact machine fault." The report should also record whether the reading is a snapshot, an average over several windows, or a peak over a fixed interval. Those choices change the number a reviewer sees even when the acoustic scene is unchanged.
When learners compare readings, keep the phone placement and analysis settings stable before interpreting the result. A retest should be triggered if the browser, device model, microphone constraint settings, FFT size, or placement changes. The calculation is simple; the discipline is making sure the same calculation was applied to comparable input.
Practitioner Knowledge Check
The Time-Frequency Trade and Uncalibrated Levels
Two realities separate a pretty spectrum from a trustworthy measurement.
Finer frequency costs time
The FFT window duration is fftSize / sampleRate. A 2048-point FFT at 48 kHz spans 42.7 ms, giving 23.4 Hz bins. Doubling fftSize halves the bin width but doubles the window — you cannot have fine frequency and fast time at once.
Web Audio levels are relative
The magnitudes are relative (dB full scale), not absolute sound-pressure level. Phone mic sensitivities vary widely, so reporting real dB(A) needs calibration against a reference sound-level meter.
Turn off the browser's helpers
By default getUserMedia enables echo cancellation, noise suppression, and auto gain control — all of which distort a measurement. For sensing, request these constraints set to false so the raw signal reaches the FFT.
Secure context and consent
Microphone capture requires HTTPS and explicit user permission, revocable at any time. A PWA service worker can cache the app shell for offline capture, but the audio itself still needs local storage and later sync.
Those browser helpers are valuable for calls, but they are hostile to measurement. Echo cancellation may suppress steady tones that look like feedback, noise suppression may reduce the very background sound the lab is trying to compare, and automatic gain control can make a quiet scene and a loud scene appear closer together. A sensing lab should request echoCancellation: false, noiseSuppression: false, and autoGainControl: false where the browser supports them, then record whether the settings were actually applied.
The PWA side adds another constraint: offline operation does not remove the need for consent, minimization, and a reviewable local record. The app shell may be cached, but the microphone stream still depends on a secure context and an active permission decision. The queue should store the derived feature, analysis settings, timestamp, permission state, placement note, and sync state. It should not keep raw audio unless the lab question truly requires it and the report explains retention and deletion.
Finally, calibrated sound pressure is a different claim from relative audio sensing. A calibrated SPL result needs a reference meter or known acoustic calibrator, a documented offset, weighting choice, and a stable measurement geometry. Without that, the honest statement is narrower: under the same phone, placement, browser settings, and analysis window, this derived feature was higher, lower, or concentrated in a different frequency band.
So an honest audio-sensing lab picks an FFT size that balances the frequency detail it needs against the time response it can tolerate, disables the browser's automatic gain and noise processing, and states plainly that its levels are relative unless calibrated against a real meter. The spectrum is only as truthful as the chain that produced it.
Under-the-Hood Knowledge Check
11.17 Summary
Mobile PWA and audio labs are strongest when they produce evidence, not just a demo. The PWA side should show app-shell availability, queued records, sync state, and record schema. The audio side should show microphone permission, derived feature, phone placement, validation note, and scoped interpretation.
Keep claims narrow. A lab can support a controlled comparison or a workflow demonstration without claiming precise environmental measurement.
11.18 Key Takeaway
PWA and audio labs should make permissions, sampling behavior, device compatibility, privacy, and offline behavior part of the evidence record.
11.19 Concept Relationships
- PWA shell keeps the lab interface available after the first load.
- Local queue preserves records until they are reviewed or sent.
- Permission state determines whether sensor access can proceed.
- Audio feature summarizes microphone input for the lab question.
- Context record explains phone placement and collection conditions.
- Validation evidence supports confidence in the lab result.
- Retest trigger identifies when the lab must be rerun.
11.20 What’s Next
Continue with:
- Mobile Web Sensor Labs: practice browser-based motion, orientation, and location sensor workflows.
- Participatory Sensing: review mobile data collection when many users contribute observations.
- Mobile Sensors Assessment: check your understanding of mobile sensor lab choices.
Previous: Mobile Sensors Labs
Next: Mobile Web Sensor Labs