Smart Home
Learn about Smart Home IoT systems -- from sensors and protocols to automation scenes, energy optimization, and security
Smart Home
Learning Objectives
By the end of this topic guide, you will be able to:
- Explain the core components and layered architecture of a smart home IoT system
- Compare smart home communication protocols (Zigbee, Z-Wave, Wi-Fi, Thread/Matter, Bluetooth) and select appropriately
- Calculate energy savings ROI for key smart home devices (thermostat, lighting, plugs)
- Design automation scenes with reliability and latency considerations
- Identify common pitfalls in smart home deployments and apply best practices to avoid them
- Smart homes use IoT sensors, actuators, and automation rules to manage lighting, heating, security, and appliances — reducing energy waste by up to 30% and improving convenience without manual intervention
- Protocol selection is the most consequential design decision: local-first protocols (Zigbee, Thread/Matter) achieve 99.5%+ uptime and sub-500 ms latency, while cloud-dependent Wi-Fi devices drop to 98% uptime and 500-2000 ms latency — compounding exponentially across devices in automation scenes
- Start with the highest-ROI device (smart thermostat: $249 investment, $194/year savings, 78% first-year ROI), prove value over 3 months, then expand to lighting and security — most failures come from over-investing in low-impact gadgets before understanding actual household needs
Temperature Terry is standing by the front door of a new house. “Welcome to our smart home! I’m a motion sensor, and my job is to notice when people walk in and out of rooms.”
the LED flickers excitedly from the living room ceiling. “And when Sammy sees someone walk in, I turn on! When the room is empty for 5 minutes, I turn off to save energy. It’s like I have a superpower — I never waste electricity!”
the microcontroller sits inside the smart hub on the shelf. “I’m the brain of this house. Sammy tells me someone walked in, I tell Lila to turn on, and I also tell the thermostat to warm up this room. I keep a schedule too — at bedtime, I lock all the doors, turn off all the lights, and set the temperature to sleeping mode. The family just says ‘Good night, house!’ and I do everything!”
Bella the Buzzer guards the windows. “I’m part of the security team! If someone opens a window at night when the alarm is on, I sound the alert AND send a message to Mom’s phone. But here’s the clever part — I work with Sammy to make sure it’s not just the family cat setting me off. We call it sensor fusion — two sensors are smarter than one!”
The Big Idea: A smart home is like a team of helpful robots. Each sensor has one job (detect motion, measure temperature, check if a door is open), but when they all talk to each other through a central brain (the hub), they can do amazing things — save energy, keep the house safe, and make life easier for everyone!
| Character | Smart Home Role | Real-World Device |
|---|---|---|
| Sammy | Motion detector | PIR sensor in hallway |
| Lila | Smart light | Philips Hue bulb |
| Max | Smart hub/brain | SmartThings or Home Assistant hub |
| Bella | Security alert | Window/door contact sensor |
A smart home uses IoT (Internet of Things) technology to automate and remotely control household systems like lighting, heating, security, and appliances. Instead of manually flipping switches and adjusting thermostats, sensors detect conditions and the system responds automatically.
How It Works in 4 Steps:
- Sensors detect what is happening (motion in a room, temperature dropping, door opening)
- A hub or controller processes sensor data and applies rules you have set
- Actuators respond automatically (lights turn on, thermostat adjusts, locks engage)
- You get notified on your phone when important events happen (child arrives home, water leak detected)
Simple Example: You leave for work. Your phone’s GPS tells the smart home you have left. Automatically: lights turn off, thermostat sets to “away” mode (saving energy), doors lock, and the security camera starts recording. When you return, everything reverses — lights on, comfortable temperature, doors unlock.
Why Does This Matter?
- The average US household wastes $400+ per year heating and cooling empty rooms
- A smart thermostat alone reduces HVAC costs by 18% (the single biggest energy saver)
- Smart security with multi-sensor fusion reduces false alarms by up to 87%
Key Protocols (Communication Languages):
| Protocol | Best For | Power | Range |
|---|---|---|---|
| Zigbee | Lights, sensors | Very low | 10-100m mesh |
| Z-Wave | Locks, switches | Low | 30m mesh |
| Wi-Fi | Cameras, streaming | High | 50m |
| Thread/Matter | Next-gen local control | Very low | 10-100m mesh |
| Bluetooth | Wearables, proximity | Very low | 10m |
The Golden Rule: Start with 2-3 high-impact devices (thermostat + a few smart bulbs), prove the value over a few months, then expand based on what actually improves your daily life. The biggest beginner mistake is buying too many devices before understanding what helps.
Overview
Key Concepts: home automation, voice assistants (Alexa, Google Home, Siri), smart thermostat, smart lighting, home security, Matter/Thread protocol, Zigbee mesh, Z-Wave, scene automation, energy optimization, occupancy sensing, demand response
A smart home integrates IoT sensors, actuators, communication protocols, and intelligence (local rules or cloud AI) into a unified system that manages household functions. The field spans residential automation (individual homes) to commercial building automation systems (BAS) managing large office buildings, campuses, and facilities.
Smart Home System Architecture
The following diagram shows the three-layer architecture common to most smart home deployments:
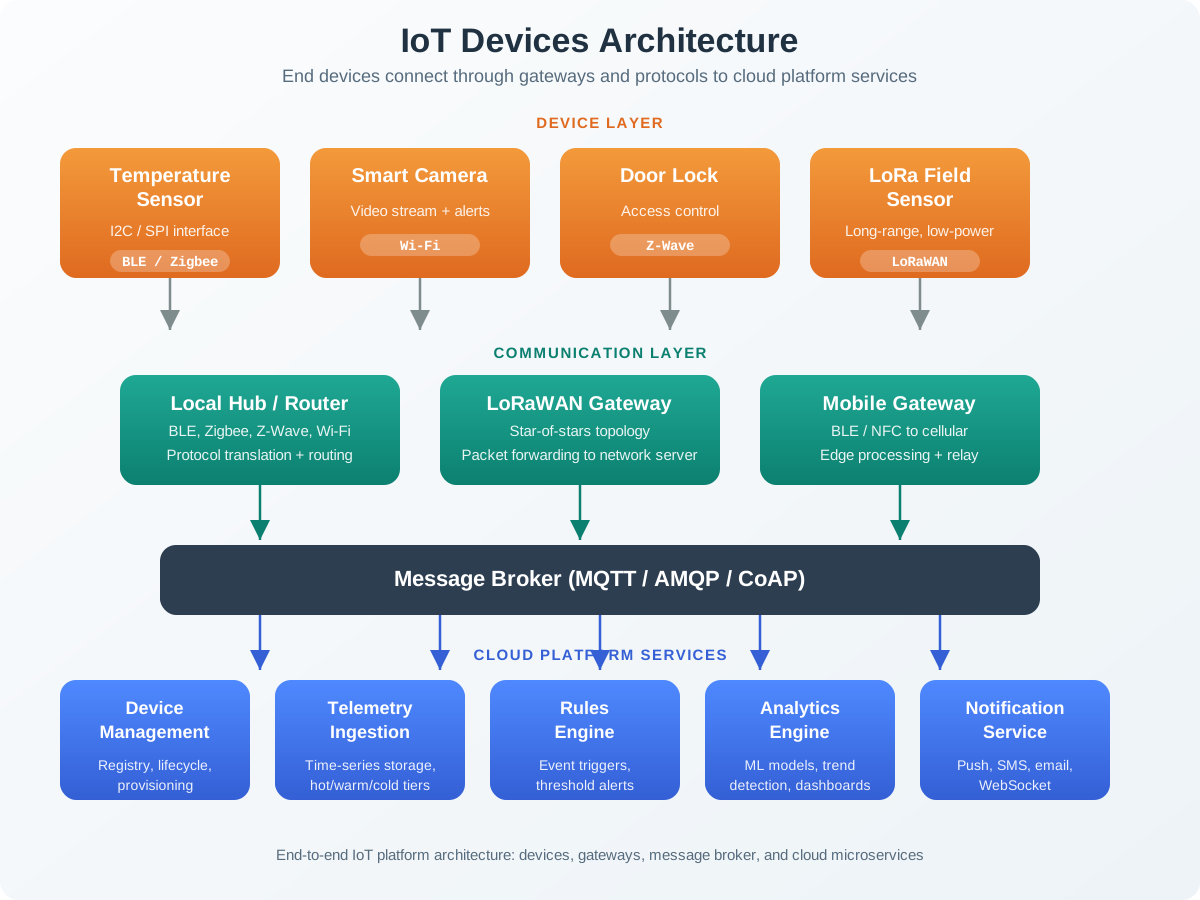
Layer Responsibilities
- Device Layer: Physical sensors and actuators that interact with the home environment. Each device category addresses a core household function (climate, lighting, security, appliances).
- Communication Layer: Wireless protocols that carry data between devices and controllers. Protocol choice determines latency, reliability, power consumption, and cloud dependency.
- Control Layer: Intelligence that processes sensor data, applies automation rules, and exposes control interfaces (voice, app, physical buttons).
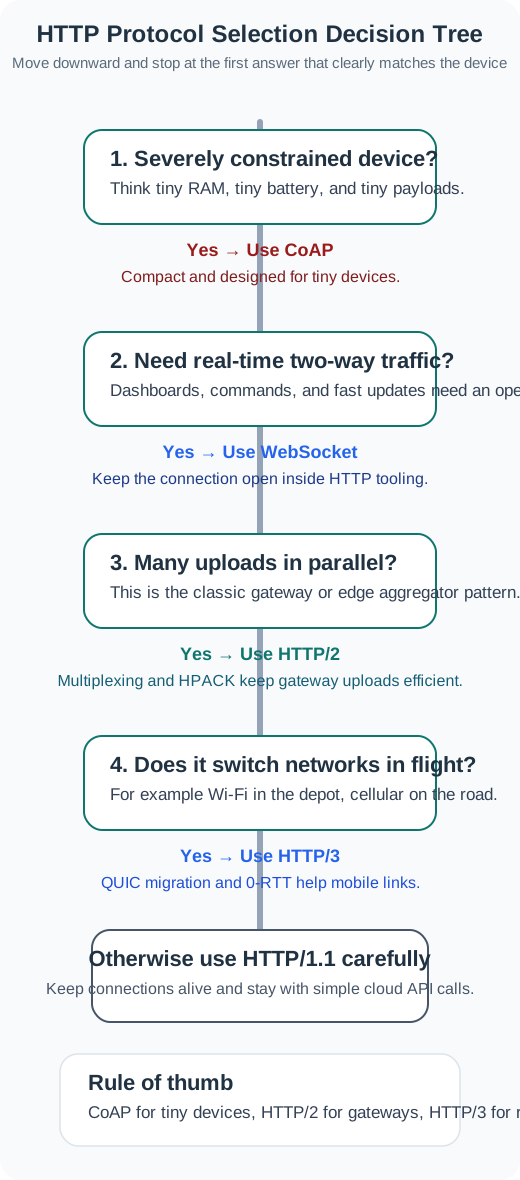
Smart Home Protocol Selection
Choosing the right communication protocol is one of the most consequential decisions in smart home design. The following decision tree guides protocol selection based on device requirements:
| Protocol | Range | Power | Latency | Cloud Dependency | Best For |
|---|---|---|---|---|---|
| Zigbee | 10-100m mesh | Very low | 100-500 ms | Low (local hub) | Lights, sensors |
| Z-Wave | 30m mesh | Low | 100-500 ms | Low (local hub) | Locks, switches |
| Wi-Fi | 50m | High | 500-2000 ms | High (most devices) | Cameras, streaming |
| Thread | 10-100m mesh | Very low | 50-200 ms | None (local) | Next-gen devices |
| Matter | Varies | Varies | 50-500 ms | Low (local first) | Cross-ecosystem |
| Bluetooth | 10m | Very low | 100-300 ms | Low | Wearables, personal |
Automation Scene Reliability
When designing automation scenes (groups of actions triggered together), reliability degrades exponentially with device count. The following diagram illustrates this:
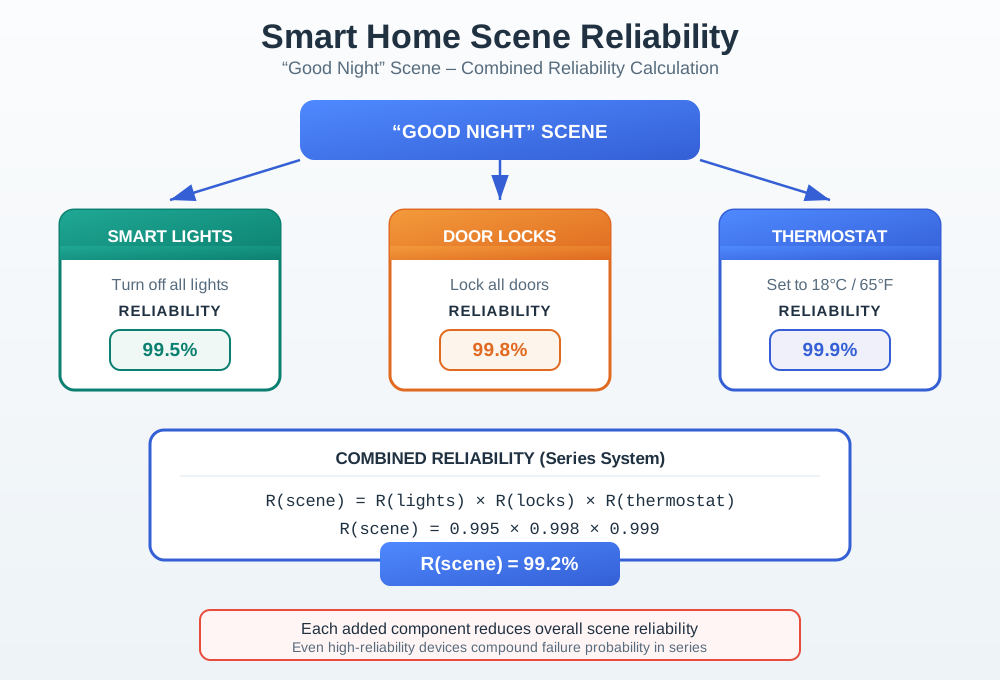
Key takeaway: A scene with 22 independent devices achieves only ~82% success rate. Splitting into “essential” (local Zigbee only) and “extended” (cloud Wi-Fi) groups ensures critical functions (lights off, doors locked) always succeed, even when non-critical ones (entertainment system, garage door) occasionally fail.
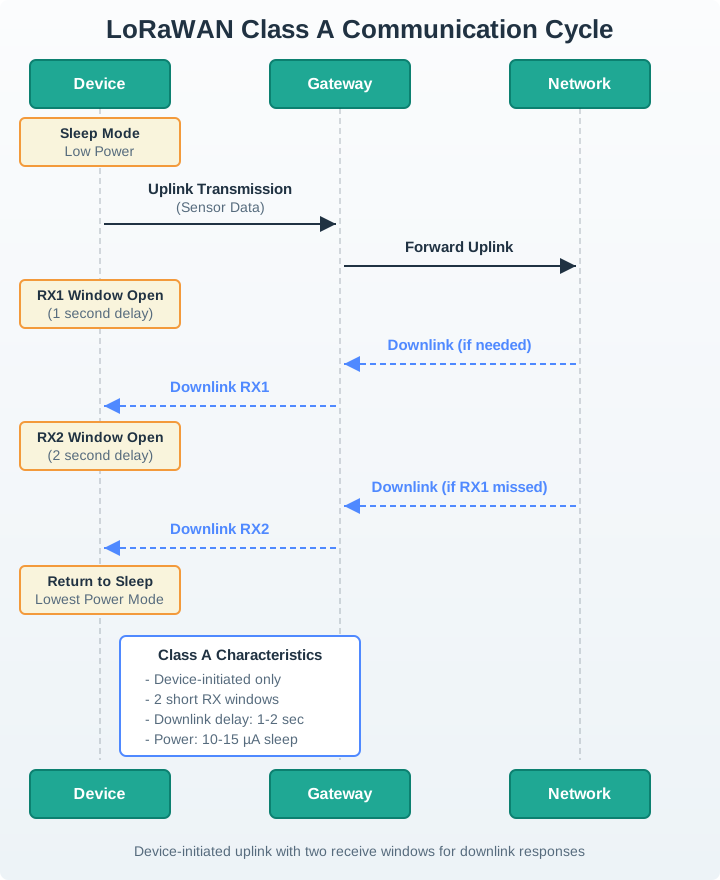
Voice Command Latency Path
Understanding the latency breakdown of a voice command helps identify optimization opportunities:
Worked Example: Smart Home Energy Optimization ROI
Scenario: A homeowner wants to evaluate whether a smart home energy management system is worth the investment. They want to know the payback period and 5-year savings.
Given Information:
- Current annual electricity bill: $2,400 ($200/month average)
- HVAC: 45% of total ($1,080/year)
- Plug load: 25% ($600/year)
- Lighting: 15% ($360/year)
- Other: 15% ($360/year)
Investment:
| Device | Cost | Energy Savings |
|---|---|---|
| Ecobee smart thermostat | $249 | 18% HVAC reduction = $194/year |
| 8 smart plugs ($20 each) | $160 | 7% plug load = $42/year |
| 6 smart bulbs ($15 each) | $90 | 35% lighting (occupancy-based) = $126/year |
| SmartThings hub | $130 | (enables automation) |
| Total | $629 | $362/year |
Step 1 — Calculate Simple Payback:
Step 2 — Calculate 5-Year Net Savings (with 3% annual rate increases):
| Year | Savings | Cumulative |
|---|---|---|
| 1 | $362 | $362 |
| 2 | $373 | $735 |
| 3 | $384 | $1,119 |
| 4 | $396 | $1,515 |
| 5 | $407 | $1,922 |
5-year net savings = $1,922 - $629 = $1,293
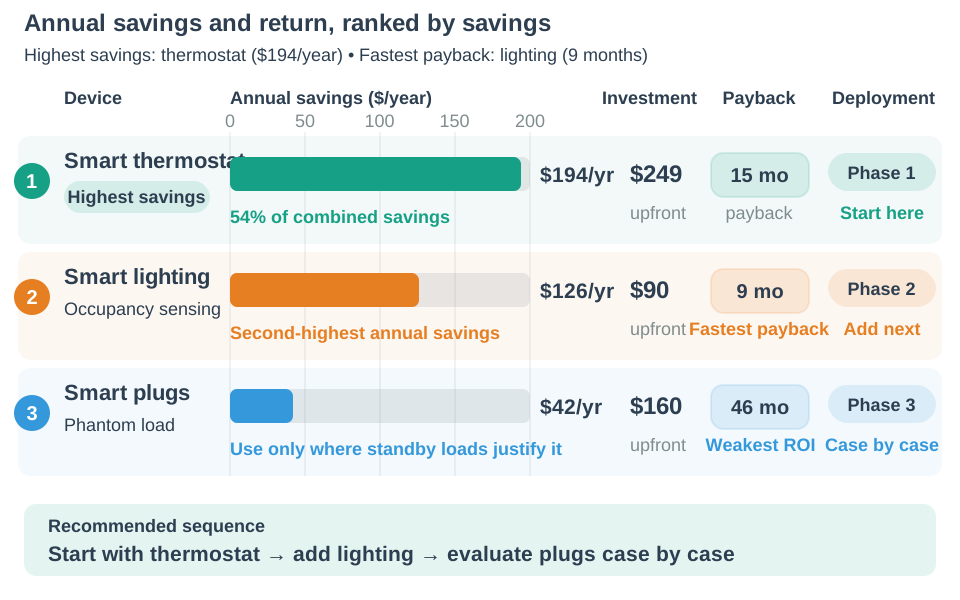
Step 3 — Identify Highest-ROI Component:
| Device | First-Year ROI | Payback |
|---|---|---|
| Smart thermostat | 78% ($194/$249) | 15 months |
| Smart bulbs | 140% ($126/$90) | 9 months |
| Smart plugs | 26% ($42/$160) | 46 months |
Key Insight: The smart thermostat alone delivers 54% of total savings. Smart bulbs have the fastest payback (9 months), but the thermostat has the largest absolute impact. Smart plugs have the worst ROI and should be the last priority. Start with the thermostat, add bulbs, then evaluate whether plugs are worth it for your household.
Common Pitfalls
Pitfall 1: Over-Automating Before Understanding Needs
Installing dozens of smart devices and complex automation rules before observing actual household usage patterns. A family buys 40 devices on Black Friday, spends a weekend setting everything up, and within a month half the automations are disabled because they trigger at wrong times or annoy household members.
Fix: Start with 2-3 high-impact devices. Monitor for 3 months. Let actual friction points guide expansion.
Pitfall 2: Ignoring Household Buy-In
The “tech enthusiast” in the family deploys a smart home system that other household members find confusing, unreliable, or invasive. Symptoms include family members using manual overrides, disabling automations, or complaining “the house is broken.”
Fix: Involve all household members in device selection. Ensure manual controls always work as fallback. Start with simple, predictable automations before adding complex ones.
Pitfall 3: Mixing Too Many Protocols Without a Strategy
Buying devices across Zigbee, Z-Wave, Wi-Fi, Bluetooth, and Thread without understanding that each protocol requires its own hub/radio and that inter-protocol communication adds latency and failure points.
Fix: Choose a primary protocol (Zigbee or Thread/Matter) for most devices. Use Wi-Fi only where bandwidth demands it (cameras). Minimize protocol diversity in automation scenes.
Pitfall 4: Cloud Dependency for Critical Functions
Relying on cloud-connected devices for essential functions like door locks, alarm systems, or heating. When the internet goes down (average US household: 8+ hours/year), these devices stop working.
Fix: Use local-first protocols (Zigbee, Z-Wave, Thread) for security and safety devices. Ensure your hub has local automation capability. Test by unplugging your router — do locks and alarms still work?
Pitfall 5: Neglecting Security Updates
Smart home devices running outdated firmware are vulnerable to attacks. The 2016 Mirai botnet compromised hundreds of thousands of IoT devices (cameras, routers) using default credentials.
Fix: Enable automatic firmware updates. Change all default passwords. Use a separate Wi-Fi network (VLAN) for IoT devices. Regularly audit which devices have internet access.
Smart Home Energy Savings Hierarchy
Understanding which devices deliver the most savings helps prioritize investment:
Knowledge Check
Test your understanding of smart home IoT concepts with the following questions.
Learning Resources
- Application Domains: Smart Home — Full chapter with detailed worked examples, ROI calculations, and commercial building automation
- Zigbee, Thread & Matter — Deep dive into the most important smart home protocols
- Matter Architecture — How the cross-ecosystem Matter standard unifies local-first control
- Sensor Types and Selection — Understanding the sensors that power smart homes
Summary
Smart home IoT encompasses residential automation and commercial building management, delivering measurable value through energy optimization, security enhancement, and convenience.
Core Architecture: Smart homes operate on three layers — devices (sensors and actuators), communication protocols (Zigbee, Z-Wave, Wi-Fi, Thread/Matter), and control intelligence (local hubs, cloud AI, voice assistants, smartphone apps).
Protocol Selection Matters Most: Local-first protocols (Zigbee, Thread/Matter) achieve 99.5%+ uptime with sub-500 ms latency. Cloud-dependent Wi-Fi devices drop to 98% uptime and 500-2000 ms latency. This difference compounds exponentially in automation scenes — a 22-device scene using mixed protocols achieves only ~82% success rate.
Energy ROI Hierarchy: Smart thermostat ($194/year, 15-month payback) delivers the highest absolute savings. Smart lighting ($126/year, 9-month payback) has the fastest percentage return. Smart plugs ($42/year, 46-month payback) are lowest priority. Total system payback: 21 months with $1,293 net savings over 5 years.
Voice Latency Optimization: Eliminating cloud-to-cloud hops via local LAN control reduces voice command latency from 3,200 ms to 1,800 ms (44% improvement) — the single biggest optimization available today.
Security: Multi-layer false alarm reduction (hardware filtering, sensor placement, sensor fusion, AI verification) achieves 87% reduction in false positives. For device security, use separate VLANs, enable automatic firmware updates, and prefer local-first protocols for critical functions.
Start Simple: Begin with the highest-ROI device (thermostat), prove value for 3 months, then expand based on actual household friction points. The most common failure mode is over-automation before understanding real needs.
What’s Next
- Smart City Topic Guide — Scale smart home concepts to city-level infrastructure
- Zigbee, Thread & Matter — Master the most widely deployed smart home protocol
- Sensor Types and Selection — Understand the sensing devices that power smart homes