Smart City
Learn about Smart City IoT systems -- how connected sensors, data analytics, and intelligent infrastructure transform urban life through smarter traffic, energy, waste, safety, and citizen services.
Smart City
Learning Objectives
After completing this topic guide, you will be able to:
- Explain the core domains and infrastructure layers that compose a smart city
- Identify the sensors, communication protocols, and data flows used across smart city subsystems (traffic, lighting, waste, water, safety)
- Evaluate trade-offs between centralized and distributed smart city architectures
- Design a data pipeline for a smart city use case, from edge sensing to cloud analytics
- Assess privacy, security, and interoperability challenges unique to city-scale IoT deployments
If you take away only three things from this topic:
- A smart city is a system of systems — traffic, lighting, waste, water, energy, and public safety subsystems share data through a common IoT platform, enabling cross-domain optimization that standalone systems cannot achieve (e.g., traffic data improving emergency response times by 25-40%).
- The critical design choice is centralized vs. federated architecture — a single city-wide platform simplifies analytics but creates a single point of failure and privacy risk, while federated architectures (per-department platforms with data sharing APIs) are more resilient but harder to integrate.
- Citizen data privacy is the make-or-break factor — smart city projects that fail to address surveillance concerns, data ownership, and transparent governance lose public trust and political support, regardless of technical merit. The most successful deployments use privacy-by-design with data minimization and anonymization at the edge.
Hey Sensor Squad! Imagine our four friends live in a city that is getting a big brain upgrade:
Temperature Terry is mounted on a lamppost at a busy intersection. “I can see how many cars are waiting at the red light!” Sammy says. “When the line gets really long, I tell the traffic computer to make the green light last longer. Last Tuesday, I helped 200 extra cars get through before school started!”
Lila the Lightbulb lives in a streetlight on Oak Street. “I used to stay bright ALL night, even when nobody was around. What a waste! Now I have a motion sensor friend — when the street is empty at 2 AM, I dim down to save energy. But the moment someone walks by, WHOOSH, I brighten right up! Our whole street saves enough electricity to power 15 houses.”
the microcontroller sits inside a smart rubbish bin in the park. “My job is SO cool — I measure how full I am! When I am 80% full, I send a message to the garbage truck: ‘Come get me!’ Before I got smart, the truck came every day whether I was full or not. Now the truck only visits bins that actually need emptying. The truck drives 40% fewer kilometres!”
the battery powers a water pipe sensor underground. “I listen to the pipes all day and night. Normal water flow sounds like a gentle hum. But a leak? That sounds like a whistle! Last month I heard a tiny whistle at 3 AM and sent an alert. The repair crew fixed a small leak before it became a BIG flood. I saved the city 50,000 litres of water!”
The Big Idea: A smart city works because Sammy, Lila, Max, and Bella all SHARE their data on one platform. When Sammy sees a big event at the stadium, Lila brightens the walking paths, Max expects more rubbish, and Bella prepares for extra water use in nearby buildings. Together, they make the city work like a team instead of a bunch of separate parts!
Think of a smart city as a regular city that has learned to “feel” and “think” using thousands of sensors and computers.
Every city has the same basic jobs: move people around, keep the lights on, collect rubbish, deliver clean water, and keep everyone safe. A smart city does all of these jobs, but adds three superpowers:
- Sensing — tiny sensors everywhere measure traffic flow, air quality, noise levels, bin fullness, water pressure, and more. These are the city’s “nerve endings.”
- Connecting — wireless networks (LoRaWAN, NB-IoT, Wi-Fi) carry sensor data to computers. This is the city’s “nervous system.”
- Deciding — software analyses the data and makes (or recommends) decisions in real time. This is the city’s “brain.”
A real example: Barcelona installed smart water sensors across the city. They detected leaks faster, adjusted irrigation based on weather forecasts, and saved 58 million litres of water per year — enough to fill 23 Olympic swimming pools.
Key difference from a “normal” city: In a traditional city, the traffic lights follow a fixed timer regardless of actual traffic. In a smart city, the traffic lights see the traffic and adapt. That single change can reduce commute times by 15-25%.
The catch: All those sensors collect data about how people move and behave. Smart cities must be designed with strong privacy protections so that “smart” does not become “surveillance.”
Overview
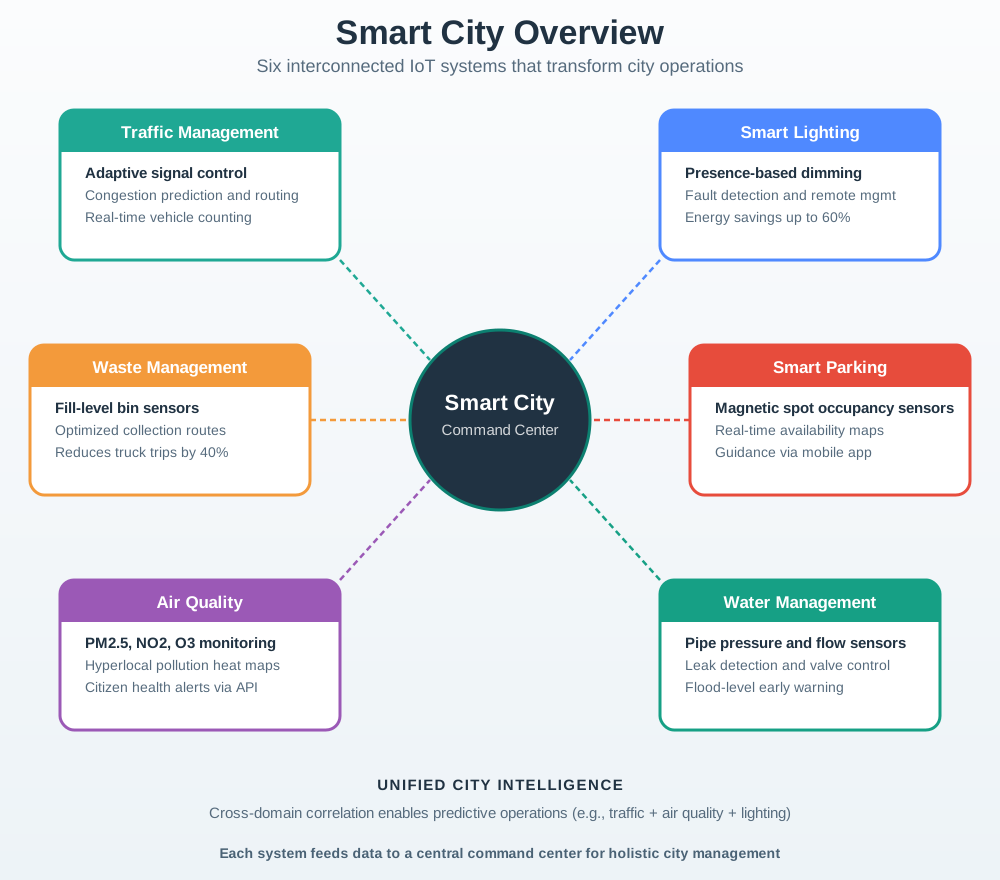
A smart city uses Internet of Things (IoT) sensors, communication networks, and data analytics platforms to improve urban services, reduce resource consumption, and enhance quality of life for citizens. Rather than a single technology, a smart city is a system of interconnected systems spanning transportation, energy, water, waste, public safety, and citizen engagement.
Key Concepts: traffic management, smart parking, adaptive lighting, waste management, water monitoring, air quality sensing, public safety, citizen engagement platforms, urban data platforms, digital twins
Smart City Domains
Smart city deployments typically span six interconnected domains. Each domain generates distinct data types and has different latency, reliability, and privacy requirements.
Transportation
Smart transportation is often the first domain cities invest in because traffic congestion has immediate, measurable economic costs (the average US driver loses 54 hours and USD 1,377 per year to congestion).
- Adaptive traffic signals: Inductive loops, radar, and camera sensors feed real-time vehicle counts to controllers that dynamically adjust signal timing. Systems like SCOOT and SCATS reduce delays by 15-25%.
- Smart parking: Magnetometer or ultrasonic sensors in each parking space transmit occupancy status to a guidance system, reducing cruising-for-parking time (which accounts for up to 30% of urban traffic).
- Public transit: GPS-equipped buses and trains provide real-time arrival predictions. Passenger counting sensors optimize route frequency.
Energy and Lighting
- Adaptive street lighting: LED luminaires with ambient light and motion sensors dim to 30-50% when no pedestrians or vehicles are detected, saving 50-70% of energy versus fixed-schedule lighting.
- Smart grid integration: Building energy meters, solar panel inverters, and EV chargers share data with the grid operator for demand-response balancing.
Water Management
- Leak detection: Acoustic sensors on water mains detect pressure drops and ultrasonic signatures of leaks. Cities like Tel Aviv have reduced water loss from 30% to under 10%.
- Smart irrigation: Soil moisture sensors combined with weather forecasts optimize park and median irrigation, reducing water use by 25-40%.
Waste Management
- Fill-level monitoring: Ultrasonic sensors inside bins report fill percentage over LoRaWAN or NB-IoT. Collection routes are dynamically optimized, reducing truck trips by 30-50%.
- Recycling analytics: Computer vision at sorting facilities identifies contamination rates and feeds back to citizen education campaigns.
Public Safety
- Acoustic gunshot detection: Microphone arrays triangulate gunshot locations within seconds, reducing police response times from 7+ minutes to under 2 minutes.
- Crowd analytics: Wi-Fi probe requests and camera-based counting (with privacy-preserving processing at the edge) monitor crowd density at events to prevent dangerous overcrowding.
Environmental Monitoring
- Air quality networks: Low-cost particulate matter (PM2.5, PM10), NO2, and O3 sensors provide block-by-block pollution maps. Calibrated against reference stations, they enable health advisories and traffic restriction triggers.
- Noise mapping: MEMS microphone arrays continuously measure noise levels, enabling evidence-based noise ordinance enforcement.
Smart City Communication Architecture
Choosing the right communication protocol for each smart city subsystem is critical. Different domains have different requirements for range, power, bandwidth, and latency.
| Domain | Typical Protocol | Why | Data Rate | Latency |
|---|---|---|---|---|
| Smart parking | LoRaWAN | Battery-powered sensors, infrequent updates | < 1 kbps | Minutes |
| Smart bins | LoRaWAN / NB-IoT | Low data rate, wide area | < 1 kbps | Minutes |
| Traffic signals | Ethernet / LTE | Real-time control, mains powered | 10-100 kbps | < 1 sec |
| Street lighting | LoRaWAN / 6LoWPAN | Mains powered but low data rate | < 10 kbps | Seconds |
| Video surveillance | Wi-Fi / 5G / Fibre | High bandwidth video streams | 1-20 Mbps | < 100 ms |
| Air quality | NB-IoT / LoRaWAN | Moderate frequency, wide coverage | 1-10 kbps | Minutes |
| Emergency alerts | LTE / 5G | Low latency, high reliability | 10-100 kbps | < 1 sec |
Smart City Data Pipeline
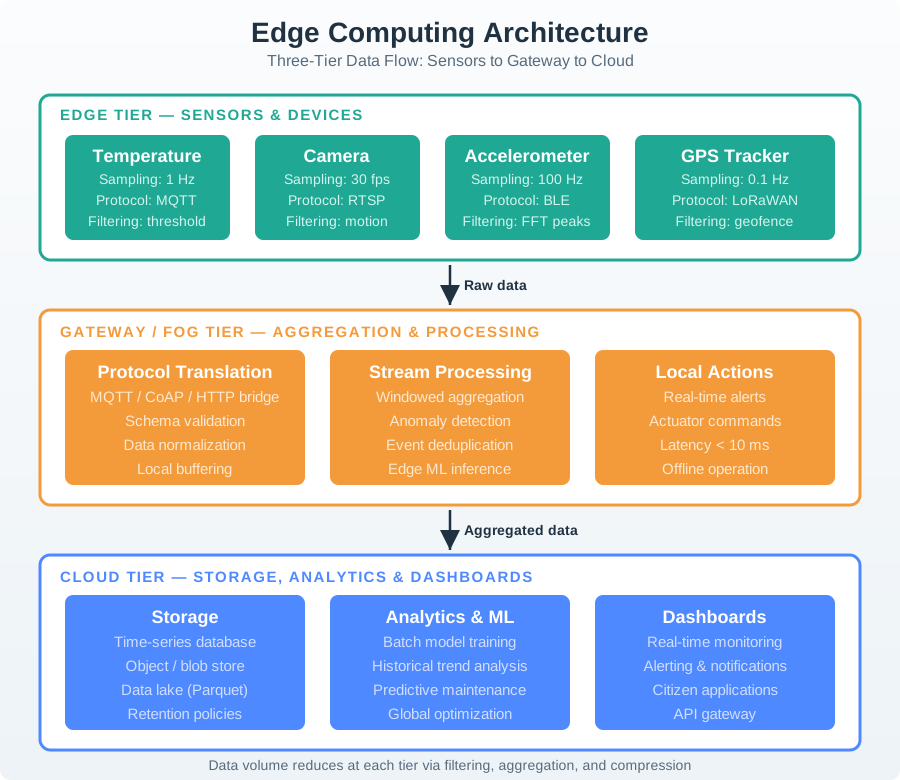
A smart city generates massive volumes of heterogeneous data. An effective data pipeline must handle ingestion, processing, storage, and analytics across all domains.
Edge Processing
In a city with 100,000+ sensors, sending all raw data to the cloud is impractical. Edge gateways perform:
- Filtering: Discard redundant readings (e.g., parking spot still occupied)
- Aggregation: Compute 5-minute averages from per-second samples
- Anomaly detection: Flag unusual values (e.g., sudden air quality spike) for immediate forwarding
- Data reduction: Compress or downsample before transmission, reducing bandwidth by 80-95%
Cloud Analytics
The cloud platform handles:
- Cross-domain correlation: Linking traffic congestion with air quality deterioration
- Predictive models: Forecasting demand for parking, energy, and transit
- Digital twins: 3D city models updated in near-real-time for planning simulations
- Open data: Publishing anonymized datasets for researchers and entrepreneurs
Privacy, Security, and Governance
Smart cities face unique privacy and security challenges due to the scale of data collection and the public nature of the infrastructure.
Key Privacy Principles
- Data minimization: Collect only what is needed. A parking sensor needs occupancy (yes/no), not license plate images.
- Edge anonymization: Process personally identifiable information (PII) at the edge before it reaches the cloud. Face blurring, MAC address hashing, and location fuzzing should happen on the gateway.
- Purpose limitation: Data collected for traffic optimization must not be repurposed for law enforcement without explicit legal authority and public notice.
- Transparency: Publish a public register of all city sensors, what they collect, and how long data is retained. Barcelona and Amsterdam maintain such registries.
- Democratic governance: Establish citizen advisory boards and public comment processes before deploying surveillance-capable infrastructure.
Security Considerations
- Attack surface: A city with 100,000 sensors has 100,000 potential entry points. Firmware update mechanisms must be secure (signed updates, secure boot).
- Availability: Traffic signals and water systems are critical infrastructure. DDoS protection and network segmentation are essential.
- Supply chain: Sensors from multiple vendors must be vetted for backdoors and secure default configurations.
-
Vendor lock-in through proprietary platforms: Many cities deploy a vendor-specific smart city platform only to discover that adding a new sensor type or switching providers requires a complete system replacement. Mitigation: Require open APIs (FIWARE NGSI-LD, OGC SensorThings) and data portability clauses in all procurement contracts.
-
Deploying surveillance infrastructure without governance: Installing cameras or acoustic sensors “for safety” without clear policies on data access, retention, and oversight erodes public trust and may violate GDPR/local privacy laws. Mitigation: Establish a public sensor registry and citizen oversight board BEFORE deployment.
-
Ignoring interoperability across departments: The traffic department deploys LoRaWAN, the water department uses NB-IoT, and the energy department picks Sigfox — each with its own platform, creating data silos. Mitigation: Define a city-wide IoT architecture with shared gateways, a common data platform, and standard data models.
-
Underestimating maintenance costs: A pilot with 50 sensors works perfectly; scaling to 10,000 sensors reveals that 5-10% fail annually, requiring field replacement crews, recalibration schedules, and battery replacement logistics. Mitigation: Budget 15-25% of deployment cost annually for operations and maintenance, and choose sensors with 5+ year battery life for unattended installations.
-
Pilot purgatory: Running endless small-scale pilots that never transition to city-wide deployment because the business case, procurement process, or political support is not established. Mitigation: Define success metrics and a go/no-go decision framework BEFORE the pilot starts, with a committed timeline for scaling.
Worked Example: Smart Parking System Design
Scenario: The city of Greenfield (population 200,000) wants to deploy a smart parking system in its downtown district with 2,000 on-street parking spaces across 50 city blocks. The goals are to reduce cruising-for-parking time (currently averaging 12 minutes per driver), increase parking revenue by detecting violations, and provide real-time availability data to citizens via a mobile app.
Step 1: Sensor Selection
Each parking space needs an individual occupancy sensor. Options considered:
| Sensor Type | Cost/Unit | Battery Life | Accuracy | Installation |
|---|---|---|---|---|
| Magnetometer (in-road) | USD 80-120 | 5-8 years | 95-98% | Cut into pavement |
| Ultrasonic (surface-mount) | USD 60-90 | 3-5 years | 90-95% | Bolt to curb |
| Radar (pole-mount) | USD 200-300 | Mains powered | 97-99% | One per 8-10 spaces |
Decision: In-road magnetometer sensors. Higher accuracy justifies the installation cost, and 5-8 year battery life minimizes maintenance visits. 2,000 sensors at USD 100 each = USD 200,000 for sensors.
Step 2: Communication Network
2,000 sensors across 50 blocks, each sending a status update when occupancy changes (approximately 8-12 messages per day per sensor):
- Data per message: 20 bytes (sensor ID, status, battery level, timestamp)
- Daily volume: 2,000 sensors x 10 messages x 20 bytes = 400 kB/day (trivial)
- Latency requirement: < 60 seconds (drivers need near-real-time availability)
Decision: LoRaWAN network with 4 gateways covering the downtown area. Each gateway costs USD 1,500; LoRaWAN’s 2-5 km range in urban environments means 4 gateways provide redundant coverage. Total: USD 6,000 for network infrastructure, plus USD 500/year cloud hosting for the network server.
Step 3: Data Platform
- Ingestion: MQTT broker receives sensor events from LoRaWAN network server
- Processing: Simple state machine (occupied/vacant) with 2-minute debounce to avoid false triggers from passing pedestrians
- Storage: Time-series database (InfluxDB) for occupancy history; PostGIS for spatial queries (“find nearest vacant space”)
- API: REST API serving current availability by block, street, or radius from GPS coordinates
- Citizen app: Mobile app with map showing color-coded space availability (green = vacant, red = occupied, grey = unknown)
Step 4: Cost-Benefit Analysis
| Item | Cost |
|---|---|
| 2,000 magnetometer sensors | USD 200,000 |
| 4 LoRaWAN gateways | USD 6,000 |
| Installation labor | USD 150,000 |
| Data platform (Year 1) | USD 45,000 |
| Mobile app development | USD 80,000 |
| Total Year 1 | USD 481,000 |
| Annual operations (Year 2+) | USD 60,000 |
Benefits (estimated annually):
- Reduced cruising time: 12 min to 4 min average -> fewer emissions, less congestion
- Increased parking revenue from violation detection: +USD 180,000/year
- Higher turnover (10% more parking transactions): +USD 120,000/year
- Payback period: approximately 1.6 years
Step 5: Privacy Safeguards
- Sensors detect vehicle presence only (magnetometer), not identity — no license plate recognition
- No personal data is stored; occupancy events are anonymous
- Aggregated occupancy statistics published as open data for urban planners
- Clear signage: “This block uses smart parking sensors to help you find spaces. No personal data is collected.”
Knowledge Check
Test your understanding of smart city IoT concepts.
Real-World Case Studies
Barcelona: City-wide IoT Platform
Barcelona deployed over 19,500 smart sensors across the city, covering:
- Smart water: Saved 58 million litres/year through irrigation optimization and leak detection
- Smart lighting: 1,100 smart streetlights reduced energy consumption by 30%
- Smart parking: 400 sensor-equipped spaces provide real-time availability to a citizen app
- Smart waste: Fill-level sensors in bins optimized collection routes, saving USD 3.8 million/year
- Open data: Published 450+ datasets through the city’s Open Data portal, spawning 47 new startups
Key lesson: Barcelona used the open-source FIWARE platform, avoiding vendor lock-in and enabling a local ecosystem of solution providers.
Singapore: Digital Twin and Urban Planning
Singapore’s “Virtual Singapore” project created a 3D digital twin of the entire city-state, integrating:
- Real-time traffic and transit data
- Building energy consumption
- Pedestrian flow simulations
- Solar irradiance modeling for rooftop solar panel placement
Key lesson: A digital twin enables simulation-based planning (e.g., “What if we convert this road to pedestrian-only?”) that is impossible with traditional analytics.
Copenhagen: Climate-Focused Smart City
Copenhagen’s goal of becoming carbon-neutral by 2025 drove IoT deployment focused on:
- Cycling infrastructure: Sensors on bike lanes count cyclists and trigger green waves for bicycle traffic
- District heating: Smart meters and predictive algorithms optimize heating distribution, reducing energy waste by 10%
- Harbour monitoring: Water quality sensors ensure the harbour remains safe for swimming — a unique citizen engagement strategy
Key lesson: Aligning smart city investments with a clear climate goal (carbon neutrality) creates political consensus and long-term funding stability.
Learning Resources
- Start here: Application Domains — Smart Cities for comprehensive coverage of smart city use cases
- Communication: LoRaWAN Overview for the most common smart city LPWAN protocol
- Data pipeline: Edge Data Acquisition for sensor data ingestion patterns
- Privacy: Introduction to Privacy for governance frameworks applicable to public-space sensing
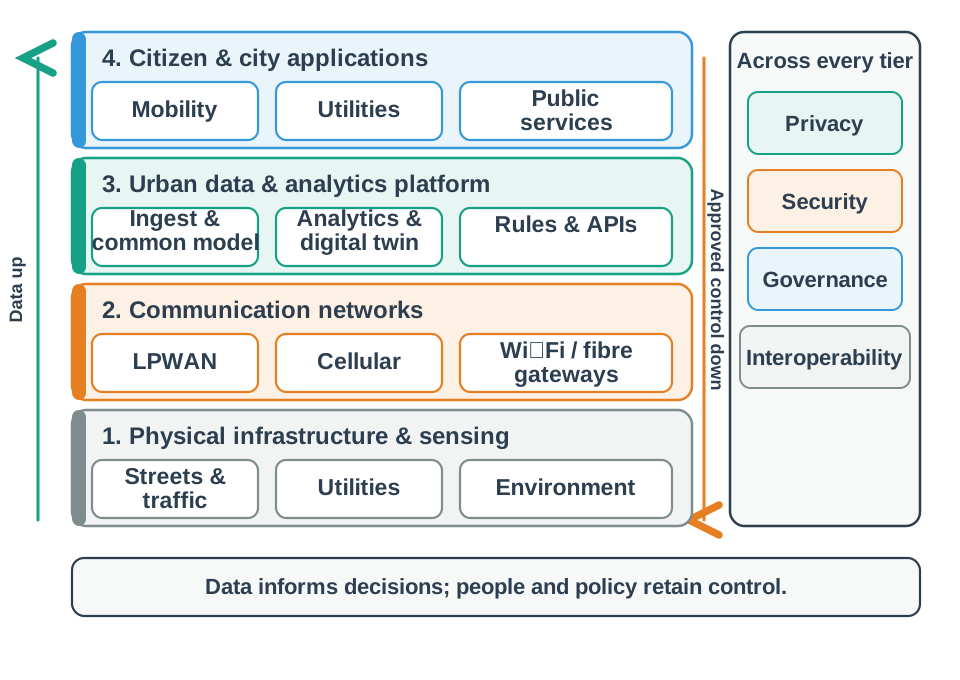
- Architecture: IoT Reference Models for the layered architecture design used in city platforms
- Case study: Lessons from Real Deployments: Barcelona Smart City for the Barcelona water and lighting deployment referenced above
Summary
Smart cities represent one of the most ambitious and impactful applications of IoT technology. The key takeaways from this topic guide are:
| Aspect | Key Insight |
|---|---|
| Scope | A smart city spans 6+ domains (traffic, energy, water, waste, safety, environment) that must interoperate through a common data platform |
| Architecture | Layered: physical sensors, communication networks (LoRaWAN/NB-IoT/5G), data platform (stream processing + storage), and citizen-facing applications |
| Protocol choice | Match protocol to requirements: LoRaWAN for battery-powered low-data sensors, NB-IoT for moderate-frequency reporting, 5G/LTE for real-time video and control |
| Data pipeline | Edge processing reduces bandwidth by 80-95%; cloud analytics enables cross-domain correlation and predictive models |
| Privacy | Privacy-by-design is non-negotiable: data minimization, edge anonymization, purpose limitation, public sensor registries, and citizen oversight |
| Governance | Open standards (FIWARE, OGC SensorThings) prevent vendor lock-in; citizen engagement builds trust and political support |
| Economics | Smart city projects with clear ROI metrics (parking revenue, water savings, energy reduction) achieve payback in 1-3 years and scale from pilots to city-wide deployment |
| Maintenance | Budget 15-25% of deployment cost annually for operations; choose sensors with 5+ year battery life for unattended installations |
The most successful smart cities treat IoT as a platform for urban innovation rather than a collection of isolated technology projects. By establishing open data platforms, strong governance frameworks, and citizen engagement processes, cities create sustainable ecosystems where government, industry, and citizens co-create value from urban data.
What’s Next
- Explore Smart Home for residential-scale IoT that complements city-wide infrastructure
- Study LoRaWAN and Cellular IoT for the communication technologies that connect smart city sensors
- Learn about Edge Computing for the processing architecture that handles city-scale data volumes
- Review Edge Data Acquisition design patterns for ingesting and analysing multi-domain sensor streams