Smart Agriculture
Learn about Smart Agriculture in IoT systems -- from soil moisture monitoring to precision irrigation and crop health analytics
Smart Agriculture
Learning Objectives
By the end of this topic guide, you will be able to:
- Describe the core components of a smart agriculture IoT system (sensors, gateways, cloud analytics, actuation)
- Compare connectivity options (LoRaWAN, NB-IoT, cellular) for agricultural deployments
- Explain how soil moisture monitoring, crop health imaging, and weather stations integrate into precision farming
- Identify common pitfalls in agricultural IoT deployments and how to avoid them
- Design a basic sensor deployment plan for a precision irrigation scenario
- Precision agriculture replaces uniform field treatment with site-specific, data-driven management — IoT sensors monitor soil moisture, weather, crop health, and livestock in real time, enabling 20-30% water savings and 10-15% yield improvements
- LoRaWAN is the dominant connectivity choice for agricultural IoT because a single gateway covers 500-1,000 hectares, nodes cost $50-150 with no carrier fees, and batteries last 5-10 years at hourly transmission intervals
- The real value is in actionable insights, not raw data — a soil moisture reading alone is meaningless; combining it with weather forecasts, crop growth models, and irrigation schedules turns sensor data into automated irrigation decisions that save water and improve yields
Temperature Terry is planted in the soil of a big wheat field. “I can feel the dirt around me getting drier and drier! The plants need water, but the farmer can’t tell just by looking.”
the LED lights up on a dashboard inside the farmhouse. “I got Sammy’s message! I’m turning orange to warn Farmer Dan that Section 3 needs watering. But Section 7 is still nice and wet — no water needed there!”
the microcontroller coordinates everything. “Think of me as the farm’s brain. I take Sammy’s soil data, check the weather forecast (no rain for 3 days!), and tell the irrigation valve to open for exactly 20 minutes in Section 3. That’s precision farming — giving each part of the field exactly what it needs!”
Bella the Buzzer watches over the cows in the pasture. “Each cow wears a sensor collar. If Daisy the cow suddenly stops moving and her temperature goes up, BUZZ! I alert the farmer that Daisy might be sick — before the farmer could even tell by looking at her!”
The Big Idea: Smart agriculture is like giving every plant and animal on the farm its own doctor and weather forecaster! Instead of treating the whole farm the same, sensors help farmers give each section exactly what it needs — saving water, growing healthier food, and keeping animals safe.
| Character | Farm Role | What They Monitor |
|---|---|---|
| Sammy | Soil sensor | Moisture, temperature, pH underground |
| Lila | Dashboard display | Alerts and status for the farmer |
| Max | Farm controller | Combines sensor data with weather to make decisions |
| Bella | Livestock monitor | Animal health, location, and behavior |
The Problem with Traditional Farming:
Traditional farmers water their entire field on a schedule (say, every Tuesday and Friday) regardless of whether the soil is already wet or bone dry. They apply the same amount of fertilizer everywhere, even though some areas may need more and others less. This wastes water, fertilizer, and energy — and can actually harm crops by over- or under-treating them.
The Smart Agriculture Solution:
Smart agriculture (also called precision agriculture) uses IoT sensors spread across a farm to collect real-time data about soil conditions, weather, crop health, and livestock. This data flows to a central system that makes intelligent decisions:
- Soil moisture sensors tell the irrigation system exactly which zones need water and how much
- Weather stations on the farm predict frost, rain, and heat events hours in advance
- Camera-equipped drones fly over fields to spot diseased or stressed plants early
- Animal wearables (like smart collars) track livestock health and location
Key Terms Simplified:
| Term | What It Means | Real-World Example |
|---|---|---|
| Precision Agriculture | Treating each part of a field individually based on data | Watering dry zones more, wet zones less |
| Soil Moisture Sensor | A device buried in soil that measures water content | Like a plant’s “thirst meter” |
| Variable Rate Application | Applying different amounts of water/fertilizer to different zones | More fertilizer where soil is poor, less where it is rich |
| LoRaWAN | Long-range wireless technology for farm sensors | Reaches sensors 5-10 km away on tiny batteries |
| Precision Irrigation | Automated watering based on real-time sensor data | Drip system that turns on only when soil is dry |
Why It Matters:
The world needs to produce 50% more food by 2050 with less water and land. Smart agriculture is one of the most impactful IoT applications because it directly addresses food security, water conservation, and sustainable farming.
Overview
Key Concepts: soil moisture monitoring, precision irrigation, crop health monitoring, livestock tracking, weather stations, variable rate application, drone-based imaging, LoRaWAN connectivity
Smart agriculture represents one of the most impactful applications of IoT technology. By deploying sensors across farms, ranches, and greenhouses, farmers gain real-time visibility into soil conditions, crop health, water usage, and animal well-being. The goal is to move from uniform field treatment to site-specific management — applying the right amount of water, fertilizer, and pesticide to the right place at the right time.
Smart Agriculture IoT Architecture
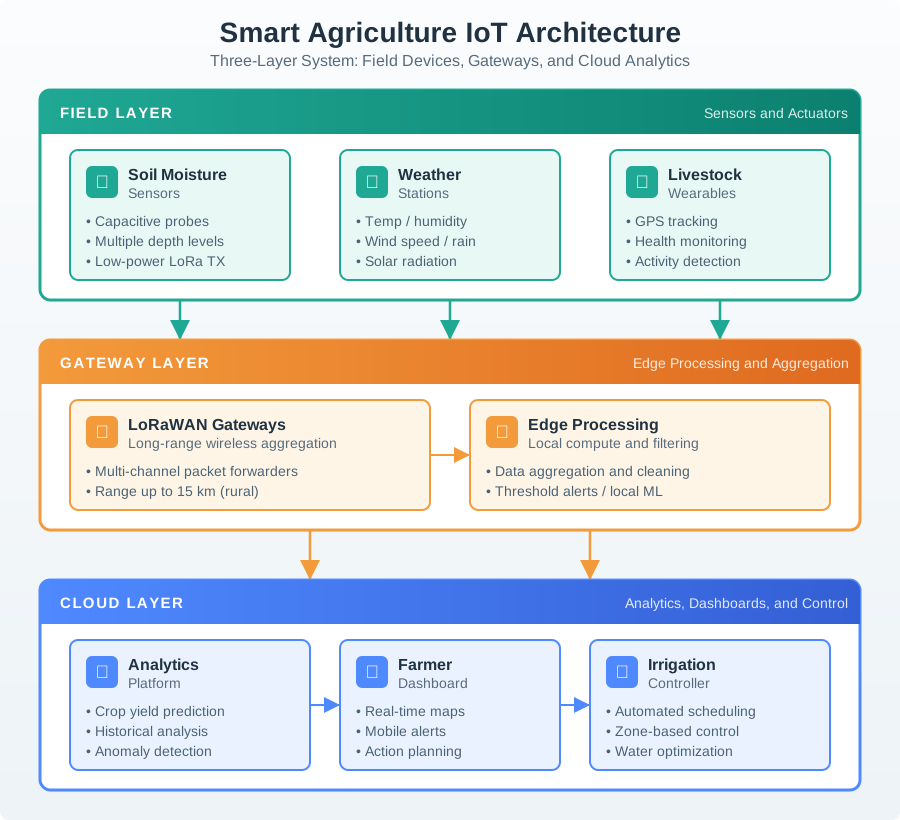
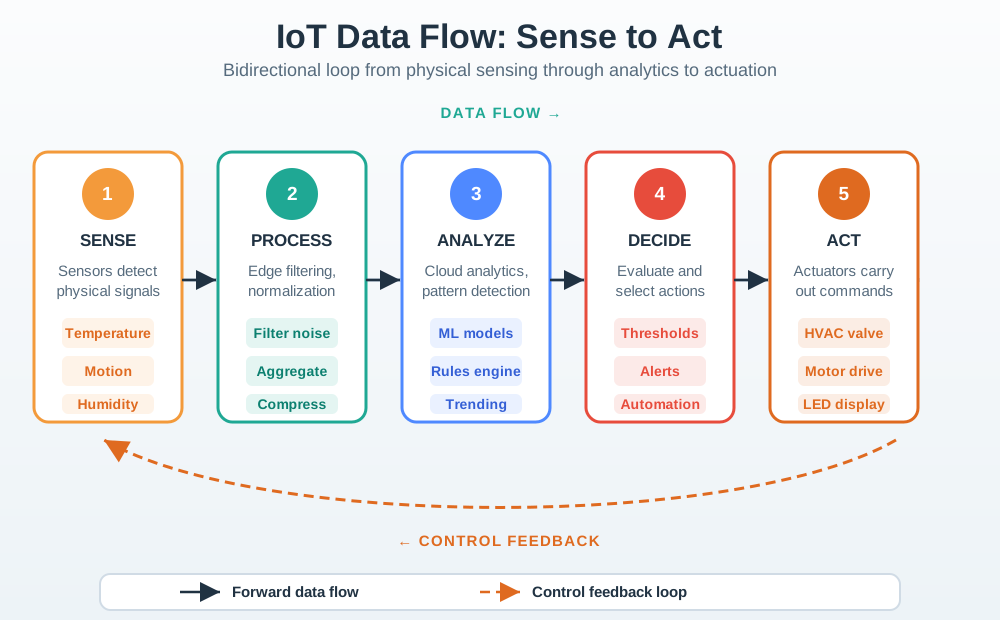
Precision Agriculture Data Flow
The value chain in smart agriculture flows from raw sensor data through analytics to actionable irrigation and treatment decisions:
Connectivity Technology Selection for Agriculture
Choosing the right wireless technology is critical for agricultural IoT. The decision depends on range, power budget, data rate, and cost per node:
Sensor Deployment: Spacing and Coverage
Proper sensor placement is one of the most important — and most frequently misunderstood — aspects of agricultural IoT. Soil conditions can vary dramatically over short distances:
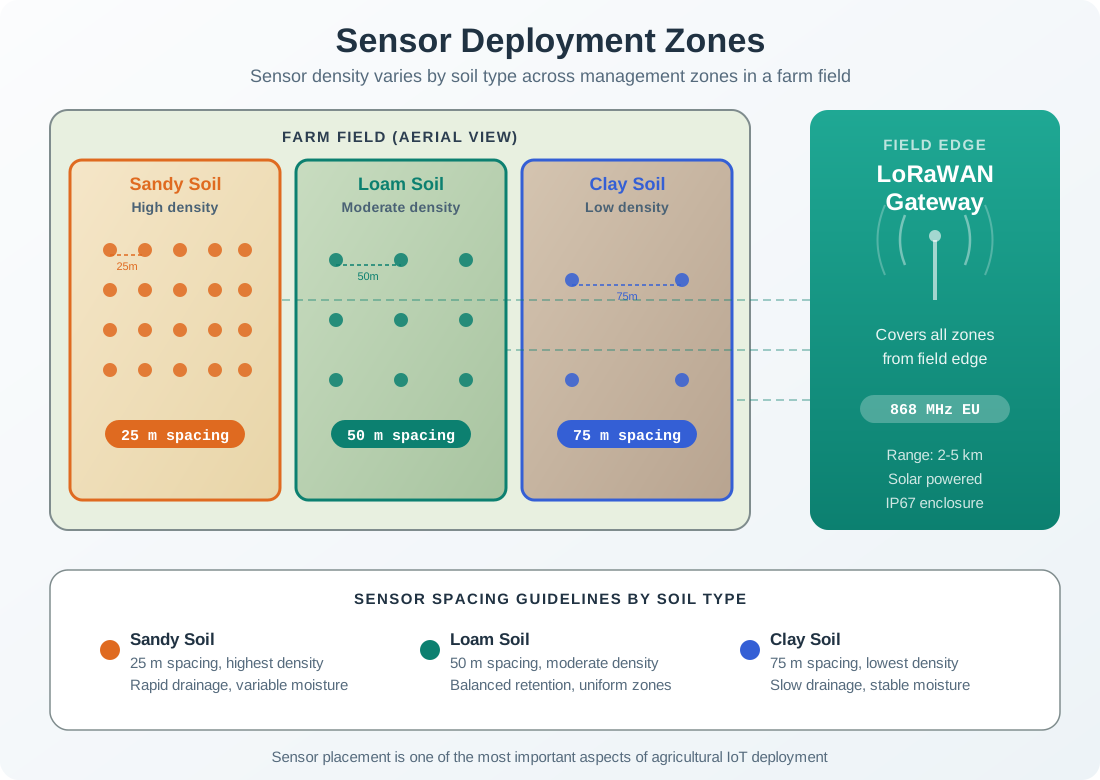
Sensor Spacing Guidelines by Soil Type:
| Soil Type | Variability | Recommended Spacing | Sensors per Hectare |
|---|---|---|---|
| Sandy | High (drains fast) | 25-30 m | 12-16 |
| Loam | Medium | 40-60 m | 4-6 |
| Clay | Low (retains water) | 60-100 m | 1-3 |
| Mixed/Unknown | Start dense | 30-40 m | 8-12 |
Livestock Monitoring Architecture
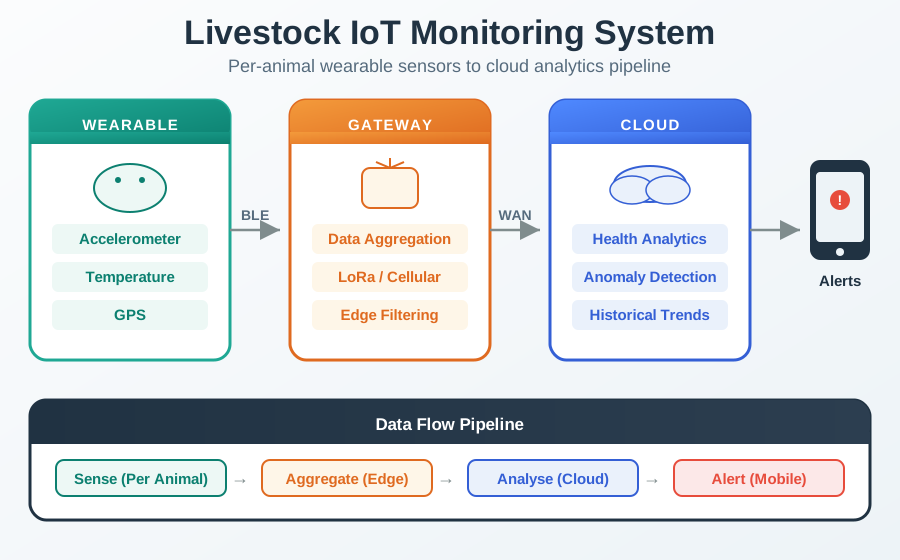
Livestock health monitoring must calibrate thresholds per individual animal, not herd averages. A temperature of 39.5 C may be normal for one cow but indicate fever in another. Multi-sensor correlation (temperature + activity + rumination) reduces false alerts by up to 80%.
Common Pitfalls in Agricultural IoT
1. Uniform sensor spacing across variable soil types. Sandy soils drain water 5-10x faster than clay soils. Deploying sensors at uniform spacing (e.g., one per hectare everywhere) means sandy zones are under-monitored and clay zones are over-monitored. Always conduct a soil survey first and adjust sensor density per zone.
2. Ignoring sensor burial depth. Soil moisture varies dramatically with depth. A sensor at 10 cm reads surface moisture (relevant for germination) but misses root-zone moisture at 30-60 cm. Deploy sensors at multiple depths or select the depth that matches your crop’s root zone.
3. Choosing cellular when LoRaWAN suffices. Many agricultural deployments send small packets (50-100 bytes) every 15-60 minutes — perfect for LoRaWAN at $0/month carrier cost. Cellular (NB-IoT, LTE-M) adds $5-15/month per node, which multiplied by hundreds of sensors becomes a significant operating expense. Reserve cellular for high-data-rate needs like camera traps or video.
4. No on-farm weather station. Relying on regional weather forecasts (which may represent conditions 20-50 km away) instead of on-site microclimate data leads to poor irrigation decisions. Temperature, humidity, and wind can vary significantly across even a single farm. Deploy at least one weather station per farm.
5. Forgetting wildlife and machinery damage. Field-deployed sensors get damaged by tractors, plows, livestock, and wildlife far more often than expected. Use ruggedized enclosures (IP67+), mark sensor locations with visible flags, and budget for 10-15% annual replacement.
Worked Example: Designing a Precision Irrigation System
Scenario: A vineyard owner wants to deploy an IoT-based precision irrigation system across 50 hectares of wine grapes. The vineyard has three soil types (sandy loam in the east, clay loam in the center, and gravel in the west). The nearest cellular tower is 8 km away. The budget is $25,000 for hardware.
Step 1: Soil Survey and Zone Mapping
Conduct a soil survey to identify management zones:
- Zone A (East, 15 ha): Sandy loam — high drainage, needs denser monitoring
- Zone B (Center, 25 ha): Clay loam — moderate retention, standard monitoring
- Zone C (West, 10 ha): Gravel — very high drainage, highest sensor density
Step 2: Sensor Density Calculation
| Zone | Area | Soil Type | Spacing | Sensors Needed | Depths per Location |
|---|---|---|---|---|---|
| A | 15 ha | Sandy loam | 30 m | 15 ha x 8/ha = 120 | 2 (20 cm, 50 cm) |
| B | 25 ha | Clay loam | 60 m | 25 ha x 3/ha = 75 | 2 (20 cm, 50 cm) |
| C | 10 ha | Gravel | 25 m | 10 ha x 14/ha = 140 | 2 (20 cm, 50 cm) |
| Total | 50 ha | 335 sensor locations | 670 sensor probes |
Step 3: Connectivity Design
- Technology: LoRaWAN (long range, low power, no carrier fees)
- Gateways: 2 gateways on elevated positions (barn roof, hilltop) for redundant coverage
- Range check: 50 ha = 0.5 km^2, so max field dimension is roughly 700 m — well within LoRaWAN’s 2-5 km rural range
- Transmission interval: Every 30 minutes (48 messages/day/node) — well within LoRaWAN duty cycle limits
Step 4: Budget Breakdown
| Component | Unit Cost | Quantity | Total |
|---|---|---|---|
| Soil moisture sensor (dual-depth) | $45 | 335 | $15,075 |
| LoRaWAN gateway (outdoor) | $800 | 2 | $1,600 |
| Weather station (on-site) | $1,200 | 1 | $1,200 |
| Solenoid zone valves | $150 | 12 | $1,800 |
| Edge controller (Raspberry Pi + LoRa) | $250 | 1 | $250 |
| Installation and cabling | — | — | $3,000 |
| Cloud platform (1 year) | $1,500 | 1 | $1,500 |
| Total | $24,425 |
Step 5: Expected ROI
- Water savings: 25-30% reduction = $8,000-12,000/year (based on $35,000 annual water cost)
- Yield improvement: 10-15% from optimal irrigation timing = $15,000-25,000/year
- Labor reduction: Automated monitoring saves 15 hours/week of manual checking
- Payback period: 8-12 months
Key Design Decisions:
- Dual-depth sensors at every location because vine roots draw water from 20-60 cm depth
- Two gateways for redundancy — if one fails, the other covers the entire vineyard
- On-site weather station because microclimate data (not regional forecasts) drives irrigation timing
- 12 irrigation zones (not 3) for finer-grained control within each soil type
Knowledge Check
Test your understanding of smart agriculture IoT concepts:
Learning Resources
Interactive Animations
Smart Agriculture IoT Planner
Topics: applications, cases, agriculture, precision farming
Wireless Range Calculator
Topics: LoRaWAN range, link budget, agricultural coverage planning
Power Budget Calculator
Topics: battery life estimation, solar harvesting, duty cycling for field sensors
Further Reading
Application Domains: Agriculture
Deep dive into soil moisture monitoring, crop health analytics, and livestock IoT with worked calculations
LoRaWAN Protocol Overview
Understand the protocol that dominates agricultural IoT connectivity
Sensor Types and Selection
Guide to choosing soil moisture, temperature, humidity, and environmental sensors
Summary
Key Takeaways
| Concept | Key Insight | Practical Impact |
|---|---|---|
| Precision Agriculture | Site-specific management replaces uniform treatment | 20-30% water savings, 10-15% yield improvement |
| Connectivity Choice | LoRaWAN dominates for field sensors; cellular for cameras/video | $0 vs $5-15/month per node operating cost |
| Sensor Placement | Density varies by soil type (sandy: 25 m, clay: 75 m) | Prevents under-monitoring high-variability zones |
| Livestock Monitoring | Per-animal baselines, not herd averages | 80% reduction in false health alerts |
| Weather Data | On-farm stations beat regional forecasts | Microclimate accuracy for frost and irrigation timing |
| ROI | Typical payback in 8-18 months for high-value crops | Water, labor, and yield improvements compound |
Three things to remember:
- Smart agriculture transforms farming from “water the whole field on Tuesday” to “apply 12 mm of water to Zone 3 at 4 AM because the soil moisture dropped below threshold and no rain is forecast for 72 hours”
- The technology is mature and affordable — a 50-hectare LoRaWAN deployment costs under $25,000 with sub-12-month payback on high-value crops
- The biggest mistakes are not technology failures but deployment errors: wrong sensor depth, uniform spacing on variable soils, and relying on regional weather instead of on-farm data
What’s Next
Continue into the full-length chapters and cross-module material this guide draws on:
- Application Domains: Agriculture — detailed soil moisture monitoring calculations, sensor calibration, and business case analysis for precision farming
- Sensor Fusion Foundations — multi-sensor correlation techniques used for livestock health monitoring
- LoRaWAN Overview and Cellular IoT Fundamentals — agricultural connectivity planning across LoRaWAN, NB-IoT, and cellular
- Raspberry Pi — the edge controller platform used in the vineyard worked example above