Energy Harvesting Cycle Animation
Interactive Visualization of IoT Energy Harvesting Systems
IoT Energy Harvesting System
This interactive animation demonstrates how IoT devices can operate indefinitely by harvesting energy from environmental sources. The system shows the complete energy flow: harvest from source, store in capacitor/battery, regulate voltage, and power the load.
Understanding Energy Harvesting
Energy harvesting enables IoT devices to operate indefinitely without battery replacement by capturing ambient energy from the environment. This is crucial for:
- Remote deployments where battery replacement is impractical
- Sustainable IoT reducing battery waste
- Maintenance-free sensor networks
- Perpetual operation for monitoring applications
Energy Harvesting Cycle
The energy harvesting cycle consists of four key stages:
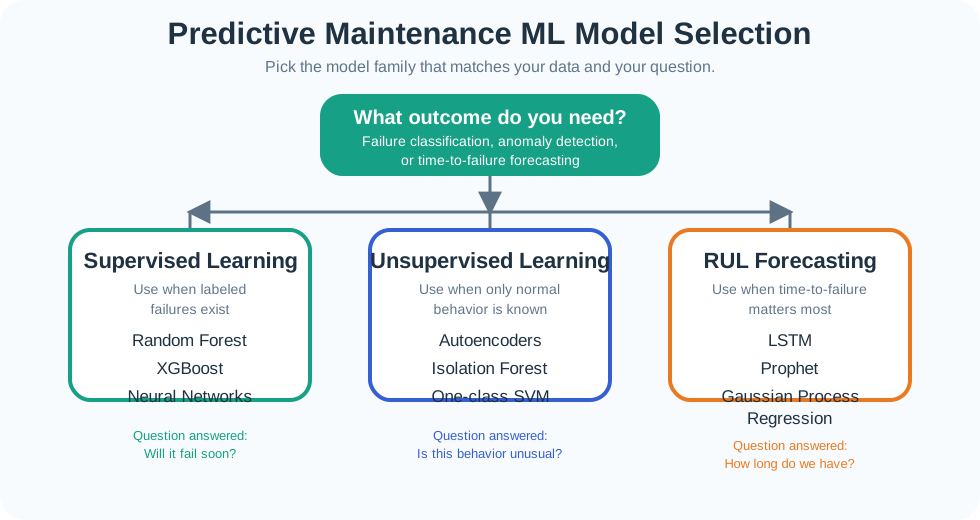
This decision tree guides energy source selection based on deployment environment. Solar provides highest power density for outdoor applications. Vibration harvesting suits machinery environments. Thermal harvesting works for body-worn devices or industrial heat sources. RF harvesting enables indoor applications near transmitters but provides very low power.
Energy Sources Comparison
| Source | Power Density | Typical Power | Advantages | Challenges |
|---|---|---|---|---|
| Solar | 10-100 mW/cm2 | 1-100 mW | High power, predictable | Light dependent, large area |
| Vibration | 0.1-1 mW/cm2 | 0.1-10 mW | Always available (machinery) | Motion dependent, resonance |
| Thermal | 10-50 uW/cm2 | 0.1-30 mW | Body heat, industrial | Low efficiency, needs gradient |
| RF | 0.1-1 uW/cm2 | 0.001-1 mW | Works indoors | Very low power, distance |
Energy Balance Equation
For sustainable operation, the energy balance must be positive or zero:
\[E_{harvested} \geq E_{consumed} + E_{storage\_loss}\]
Average power requirement:
\[P_{avg} = \frac{E_{active} \times t_{active} + E_{sleep} \times t_{sleep}}{t_{total}}\]
Where:
- \(E_{harvested}\) = Energy captured from environment
- \(E_{consumed}\) = Energy used by the IoT device
- \(E_{active}\) = Power during active mode
- \(t_{active}\) = Time in active mode
- \(E_{sleep}\) = Power during sleep mode
- \(t_{sleep}\) = Time in sleep mode
Storage Element Selection
Design Guidelines
- Oversize the harvester by 2-3x expected load for margin
- Use MPPT (Maximum Power Point Tracking) for solar to maximize efficiency
- Implement duty cycling to reduce average power consumption
- Size storage for expected periods without harvesting (night, calm weather)
- Add brownout protection to gracefully handle energy depletion
- Monitor energy budget in firmware to adapt behavior
- Undersized storage: Not enough buffer for consumption spikes
- Ignoring leakage: Storage elements lose charge over time
- No energy awareness: Software doesn’t adapt to energy availability
- Wrong harvester for environment: Using solar indoors, RF in rural areas
What’s Next
Now that you understand energy harvesting systems, explore these related topics:
- Energy-Aware Design Considerations - Comprehensive energy optimization
- Context-Aware Energy Management - Adaptive power strategies
- Duty Cycle Animation - Sleep-wake power management
- Power Budget Calculator - Interactive power analysis
- Prototyping Hardware - Energy-efficient hardware selection
Animation created for the IoT Class Textbook - ENERGY-001