viewof deviceCount = Inputs.range([100, 10000], {
  value: 1000,
  step: 100,
  label: "Number of devices:"
})

viewof deviceCost = Inputs.range([10, 200], {
  value: 50,
  step: 5,
  label: "Cost per device ($):"
})

viewof installCost = Inputs.range([5, 100], {
  value: 25,
  step: 5,
  label: "Installation cost per device ($):"
})

viewof connectivityCost = Inputs.range([5, 50], {
  value: 12,
  step: 1,
  label: "Annual connectivity per device ($):"
})

viewof cloudCost = Inputs.range([2, 30], {
  value: 8,
  step: 1,
  label: "Annual cloud cost per device ($):"
})

viewof maintenanceCost = Inputs.range([1, 20], {
  value: 5,
  step: 1,
  label: "Annual maintenance per device ($):"
})

// Calculate TCO components
year1Devices = deviceCount * deviceCost
year1Install = deviceCount * installCost
year1Connectivity = deviceCount * connectivityCost
year1Cloud = deviceCount * cloudCost
year1Maintenance = deviceCount * maintenanceCost
year1Total = year1Devices + year1Install + year1Connectivity + year1Cloud + year1Maintenance

years25Connectivity = deviceCount * connectivityCost * 4
years25Cloud = deviceCount * cloudCost * 4
years25Maintenance = deviceCount * maintenanceCost * 4
years25Total = years25Connectivity + years25Cloud + years25Maintenance

tco5Year = year1Total + years25Total
hardwarePercentage = (year1Devices / tco5Year * 100).toFixed(1)
tco_fmt_currency = value => String.fromCharCode(36) + value.toLocaleString()

html`
<div style="background: #f8f9fa; border-left: 4px solid #16A085; padding: 1.5rem; margin: 1rem 0; border-radius: 4px;">
  <h4 style="color: #2C3E50; margin-top: 0;">5-Year TCO Projection</h4>

  <div style="display: grid; grid-template-columns: repeat(auto-fit, minmax(11rem, 1fr)); gap: 1rem; margin: 1rem 0;">
    <div style="background: white; padding: 1rem; border-radius: 4px; border: 1px solid #dee2e6;">
      <div style="color: #7F8C8D; font-size: 0.875rem; margin-bottom: 0.5rem;">Year 1 Total</div>
      <div style="color: #2C3E50; font-size: 1.5rem; font-weight: 600;">${tco_fmt_currency(year1Total)}</div>
    </div>
    <div style="background: white; padding: 1rem; border-radius: 4px; border: 1px solid #dee2e6;">
      <div style="color: #7F8C8D; font-size: 0.875rem; margin-bottom: 0.5rem;">Years 2-5 Total</div>
      <div style="color: #E67E22; font-size: 1.5rem; font-weight: 600;">${tco_fmt_currency(years25Total)}</div>
    </div>
    <div style="background: white; padding: 1rem; border-radius: 4px; border: 1px solid #dee2e6;">
      <div style="color: #7F8C8D; font-size: 0.875rem; margin-bottom: 0.5rem;">5-Year TCO</div>
      <div style="color: #16A085; font-size: 1.5rem; font-weight: 600;">${tco_fmt_currency(tco5Year)}</div>
    </div>
  </div>

  <div style="display: grid; grid-template-columns: repeat(auto-fit, minmax(13rem, 1fr)); gap: 0.75rem; margin-top: 1rem;">
    <div style="background: white; padding: 0.9rem; border-radius: 4px; border: 1px solid #dee2e6;">
      <strong style="display: block; color: #2C3E50; margin-bottom: 0.5rem;">Devices</strong>
      <div style="display: flex; justify-content: space-between; gap: 1rem;"><span>Year 1</span><strong>${tco_fmt_currency(year1Devices)}</strong></div>
      <div style="display: flex; justify-content: space-between; gap: 1rem;"><span>Years 2-5</span><strong>$0</strong></div>
      <div style="display: flex; justify-content: space-between; gap: 1rem;"><span>Total</span><strong>${tco_fmt_currency(year1Devices)}</strong></div>
    </div>
    <div style="background: white; padding: 0.9rem; border-radius: 4px; border: 1px solid #dee2e6;">
      <strong style="display: block; color: #2C3E50; margin-bottom: 0.5rem;">Installation</strong>
      <div style="display: flex; justify-content: space-between; gap: 1rem;"><span>Year 1</span><strong>${tco_fmt_currency(year1Install)}</strong></div>
      <div style="display: flex; justify-content: space-between; gap: 1rem;"><span>Years 2-5</span><strong>$0</strong></div>
      <div style="display: flex; justify-content: space-between; gap: 1rem;"><span>Total</span><strong>${tco_fmt_currency(year1Install)}</strong></div>
    </div>
    <div style="background: white; padding: 0.9rem; border-radius: 4px; border: 1px solid #dee2e6;">
      <strong style="display: block; color: #2C3E50; margin-bottom: 0.5rem;">Connectivity</strong>
      <div style="display: flex; justify-content: space-between; gap: 1rem;"><span>Year 1</span><strong>${tco_fmt_currency(year1Connectivity)}</strong></div>
      <div style="display: flex; justify-content: space-between; gap: 1rem;"><span>Years 2-5</span><strong>${tco_fmt_currency(years25Connectivity)}</strong></div>
      <div style="display: flex; justify-content: space-between; gap: 1rem;"><span>Total</span><strong>${tco_fmt_currency(year1Connectivity + years25Connectivity)}</strong></div>
    </div>
    <div style="background: white; padding: 0.9rem; border-radius: 4px; border: 1px solid #dee2e6;">
      <strong style="display: block; color: #2C3E50; margin-bottom: 0.5rem;">Cloud services</strong>
      <div style="display: flex; justify-content: space-between; gap: 1rem;"><span>Year 1</span><strong>${tco_fmt_currency(year1Cloud)}</strong></div>
      <div style="display: flex; justify-content: space-between; gap: 1rem;"><span>Years 2-5</span><strong>${tco_fmt_currency(years25Cloud)}</strong></div>
      <div style="display: flex; justify-content: space-between; gap: 1rem;"><span>Total</span><strong>${tco_fmt_currency(year1Cloud + years25Cloud)}</strong></div>
    </div>
    <div style="background: white; padding: 0.9rem; border-radius: 4px; border: 1px solid #dee2e6;">
      <strong style="display: block; color: #2C3E50; margin-bottom: 0.5rem;">Maintenance</strong>
      <div style="display: flex; justify-content: space-between; gap: 1rem;"><span>Year 1</span><strong>${tco_fmt_currency(year1Maintenance)}</strong></div>
      <div style="display: flex; justify-content: space-between; gap: 1rem;"><span>Years 2-5</span><strong>${tco_fmt_currency(years25Maintenance)}</strong></div>
      <div style="display: flex; justify-content: space-between; gap: 1rem;"><span>Total</span><strong>${tco_fmt_currency(year1Maintenance + years25Maintenance)}</strong></div>
    </div>
    <div style="background: #16A085; color: white; padding: 0.9rem; border-radius: 4px;">
      <strong style="display: block; margin-bottom: 0.5rem;">Total</strong>
      <div style="display: flex; justify-content: space-between; gap: 1rem;"><span>Year 1</span><strong>${tco_fmt_currency(year1Total)}</strong></div>
      <div style="display: flex; justify-content: space-between; gap: 1rem;"><span>Years 2-5</span><strong>${tco_fmt_currency(years25Total)}</strong></div>
      <div style="display: flex; justify-content: space-between; gap: 1rem;"><span>5-year TCO</span><strong>${tco_fmt_currency(tco5Year)}</strong></div>
    </div>
  </div>

  <div style="margin-top: 1rem; padding: 1rem; background: ${hardwarePercentage < 30 ? '#fff3cd' : '#f8d7da'}; border-radius: 4px; border-left: 4px solid ${hardwarePercentage < 30 ? '#E67E22' : '#E74C3C'};">
    <strong style="color: #2C3E50;">Key Insight:</strong> Hardware represents only <strong>${hardwarePercentage}%</strong> of the 5-year cost.
    ${hardwarePercentage < 30 ? 'Organizations budgeting only upfront hardware costs will run out of funding in Year 2.' : 'This is an unusually high hardware percentage - verify your operational costs are realistic.'}
  </div>
</div>
`Interactive TCO Calculator
Interactive TCO Calculator
animation
iot
applications
Try Change Number of devices: from 1000 to 2000.
Observe Compare Year 1 Total, Years 2-5 Total, and 5-Year TCO.
Explain Explain why increasing device count from 1000 to 2000 increases every cost component.
Technical boundaries. Device and installation costs occur in year 1 only. Connectivity, cloud, and maintenance costs remain constant per device over five years.
Interactive TCO Calculator
Calculate the 5-year Total Cost of Ownership for your IoT deployment by adjusting the parameters below.
Figure 1 gives the calculator above a reference case to check your own numbers against.
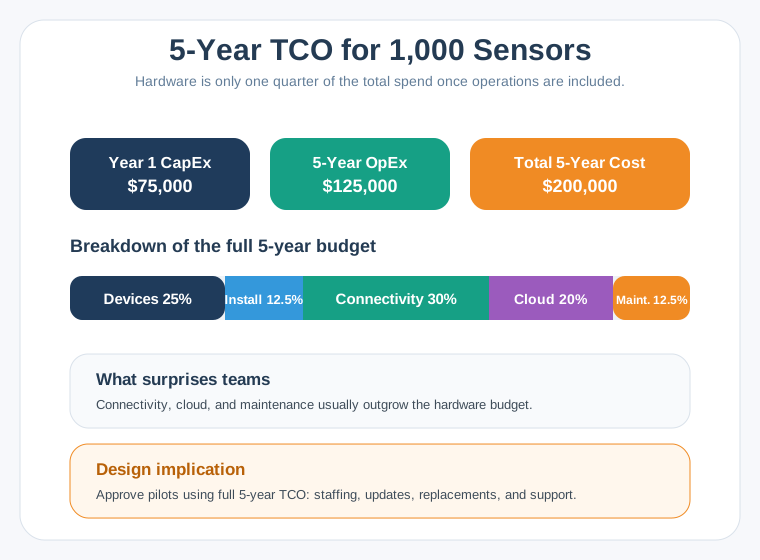
Compare your calculator output with the shape of Figure 1 rather than its exact totals. In this thousand-sensor case, devices take a quarter of the five-year budget, connectivity takes 30 percent, and cloud another 20 percent, with installation and maintenance splitting the rest evenly. Devices and installation are the year-one capital spend; everything else arrives again next year. Five-year OpEx is $125,000 (62.5% of TCO); the Year 2–5 portion is $100,000. Devices and installation account for $75,000 of CapEx, and the first-year OpEx is $25,000.