Trace a Registration Server and remote operator
Trace a wireless Thing through a gateway to a Server-PT Registration Server, observe its simulated state from a separate operator PC, and expose the server-link dependency.

Packet Pete
Predict the reading, then compare it with the measurement.
Cisco Packet Tracer
Desktop labTrace a wireless Thing through a gateway to a Server-PT Registration Server, observe its simulated state from a separate operator PC, and expose the server-link dependency.
Install the tool; build from the steps. No file yet.
Download the Packet Tracer fileSteps
Step 1
- Do
- Open lab.pkt in the Logical workspace. Find Home Gateway0 and wireless Fan-Actuator. Trace the wired line through SW-Remote and Registration-Server. Locate Operator-PC on the server side of the switch.
- You will see
- The DLG100 gateway has a wireless line to Fan-Actuator. A black wired line runs from the gateway to SW-Remote. Registration-Server and Operator-PC connect to that switch. The server-facing and local Thing paths are visibly distinct.
- Why it matters
- The local Thing needs a route towards the registration service. The operator opens the service from a separate PC. The switch connects the server-side devices. The next panels test addresses and service state, not icons alone.
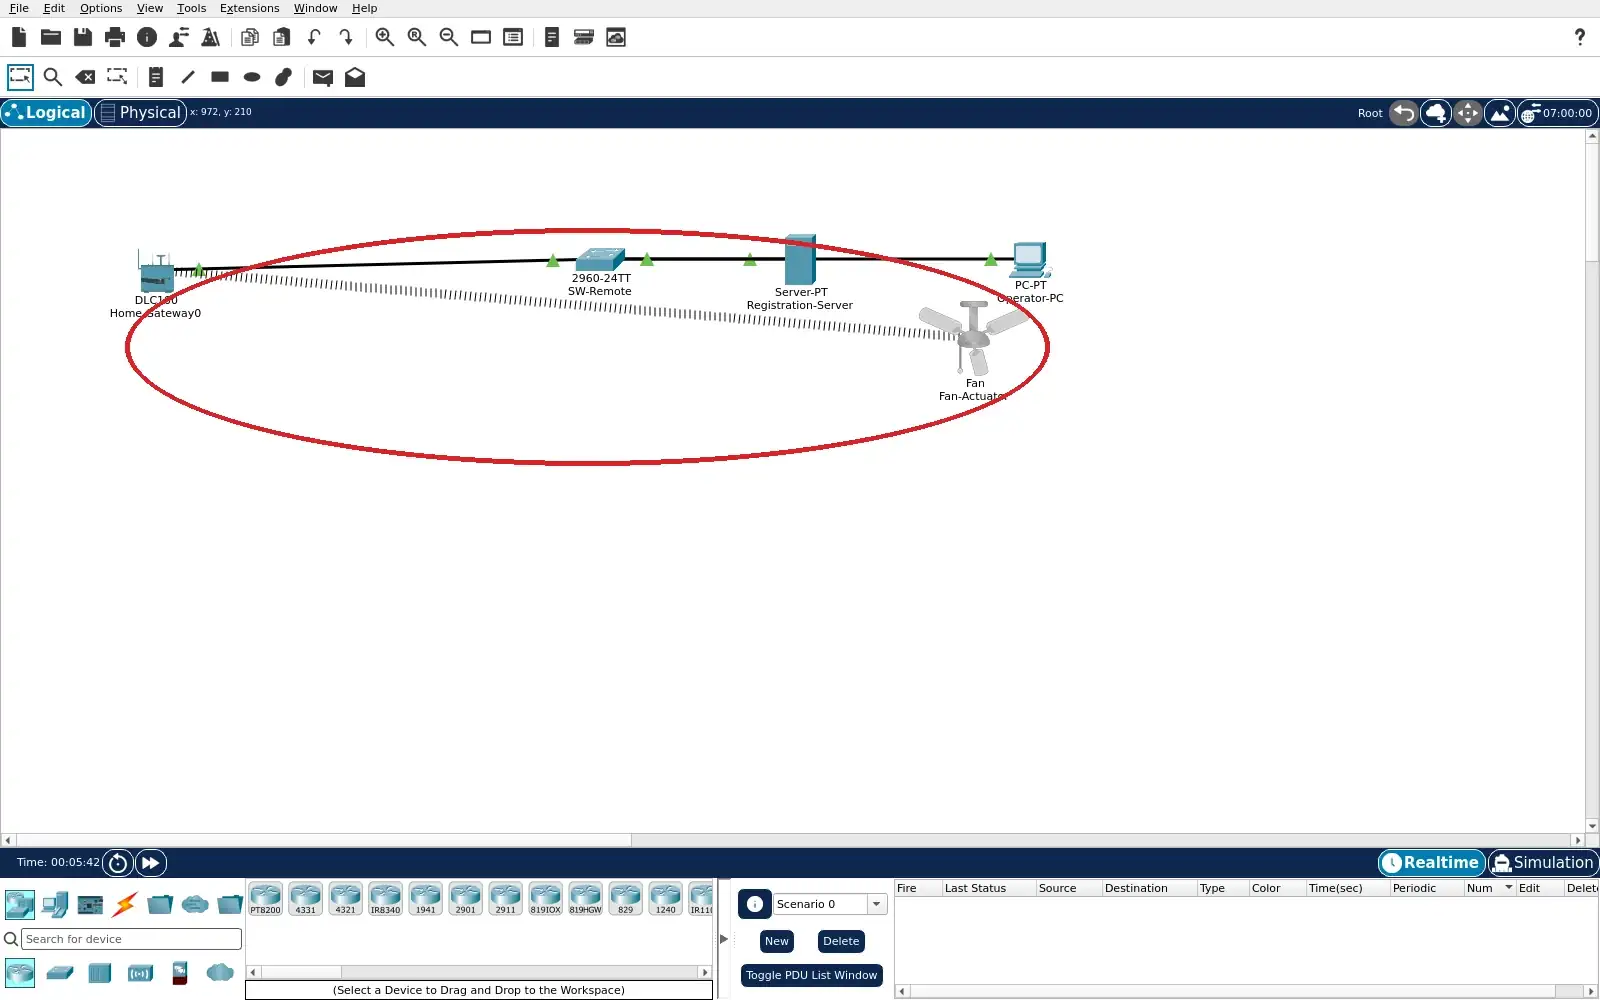
Step 1 · Cisco Packet Tracer; numbered callout added to a real capture. Enlarge screenshot (new tab) Step 2
- Do
- Open Home Gateway0 and select Config. Choose Internet from the interface list. Read the IPv4 address and subnet mask. Keep this server-facing address separate from the local LAN.
- You will see
- Internet IP Configuration is Static. The IPv4 address reads 10.10.8.1. The subnet mask reads 255.255.255.0. The local wireless network uses a different address range.
- Why it matters
- The gateway has a port in the server-side subnet. A named Internet port is not proof of Internet access. This address is the next hop for the local Thing. The server interface must be checked separately.
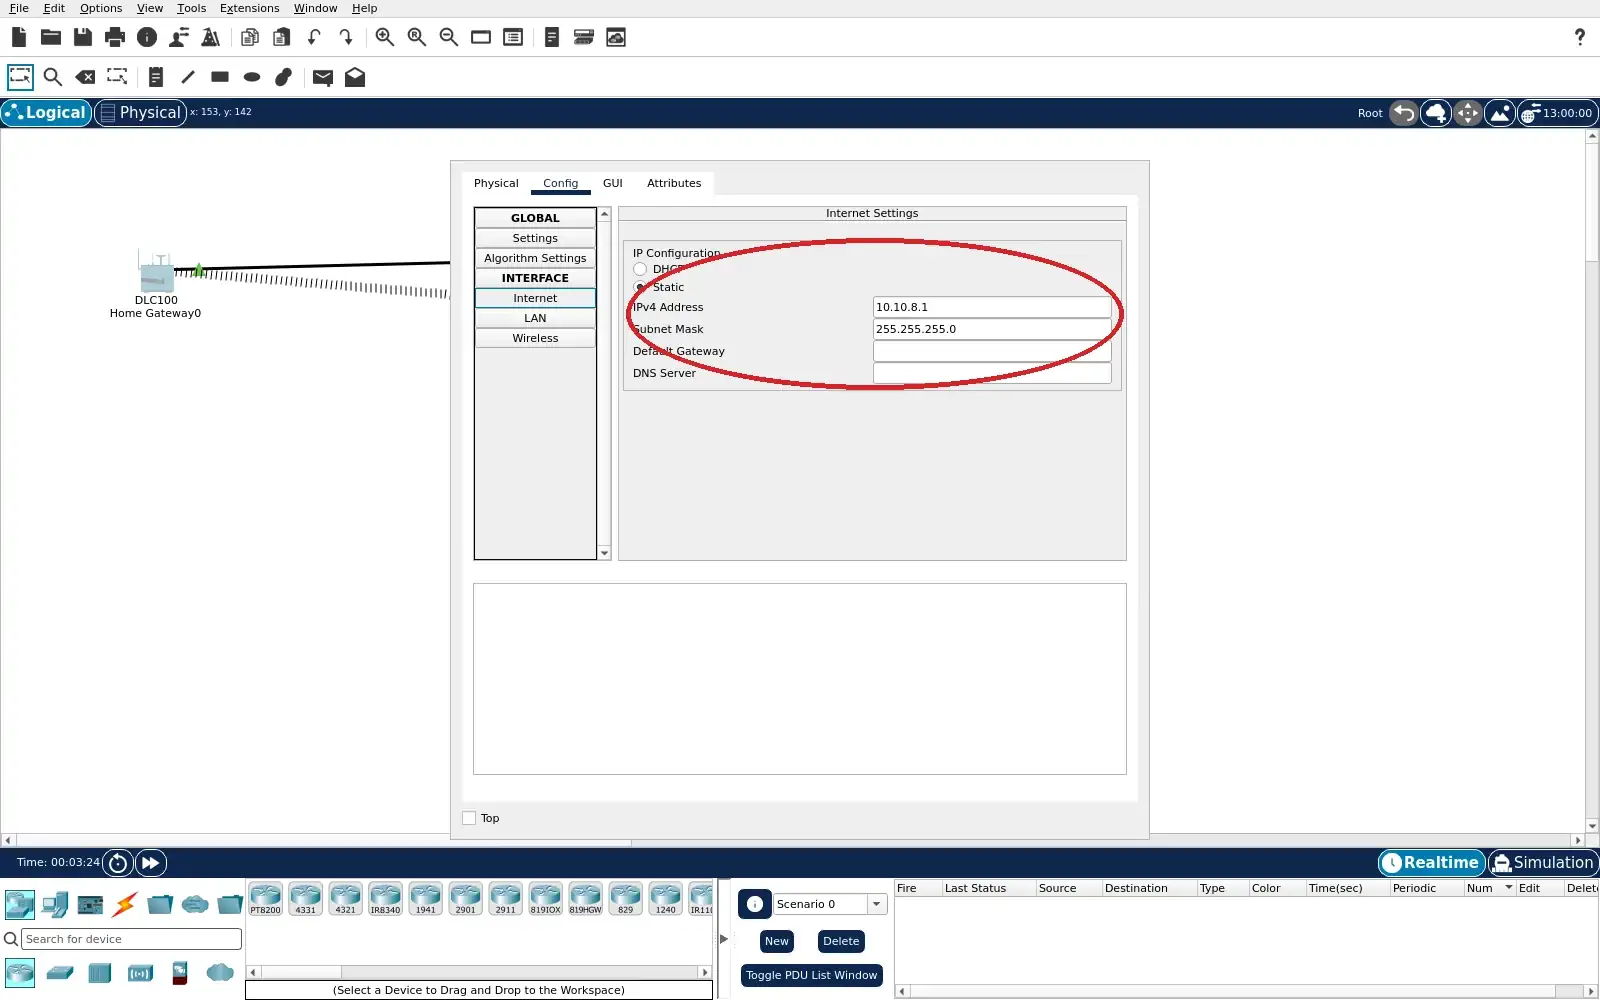
Step 2 · Cisco Packet Tracer; numbered callout added to a real capture. Enlarge screenshot (new tab) Step 3
- Do
- Open Registration-Server and select Config. Choose FastEthernet0 in the interface list. Read the IPv4 address and subnet mask. Compare them with the gateway Internet settings.
- You will see
- FastEthernet0 Port Status is On. Static IPv4 Address reads 10.10.8.10. Subnet Mask reads 255.255.255.0. The server and gateway Internet port share 10.10.8.0/24.
- Why it matters
- The server needs a reachable interface before IoT login. Matching prefixes place it on the server-side segment. The screenshot is configuration evidence only. The browser test later checks that the service answers.
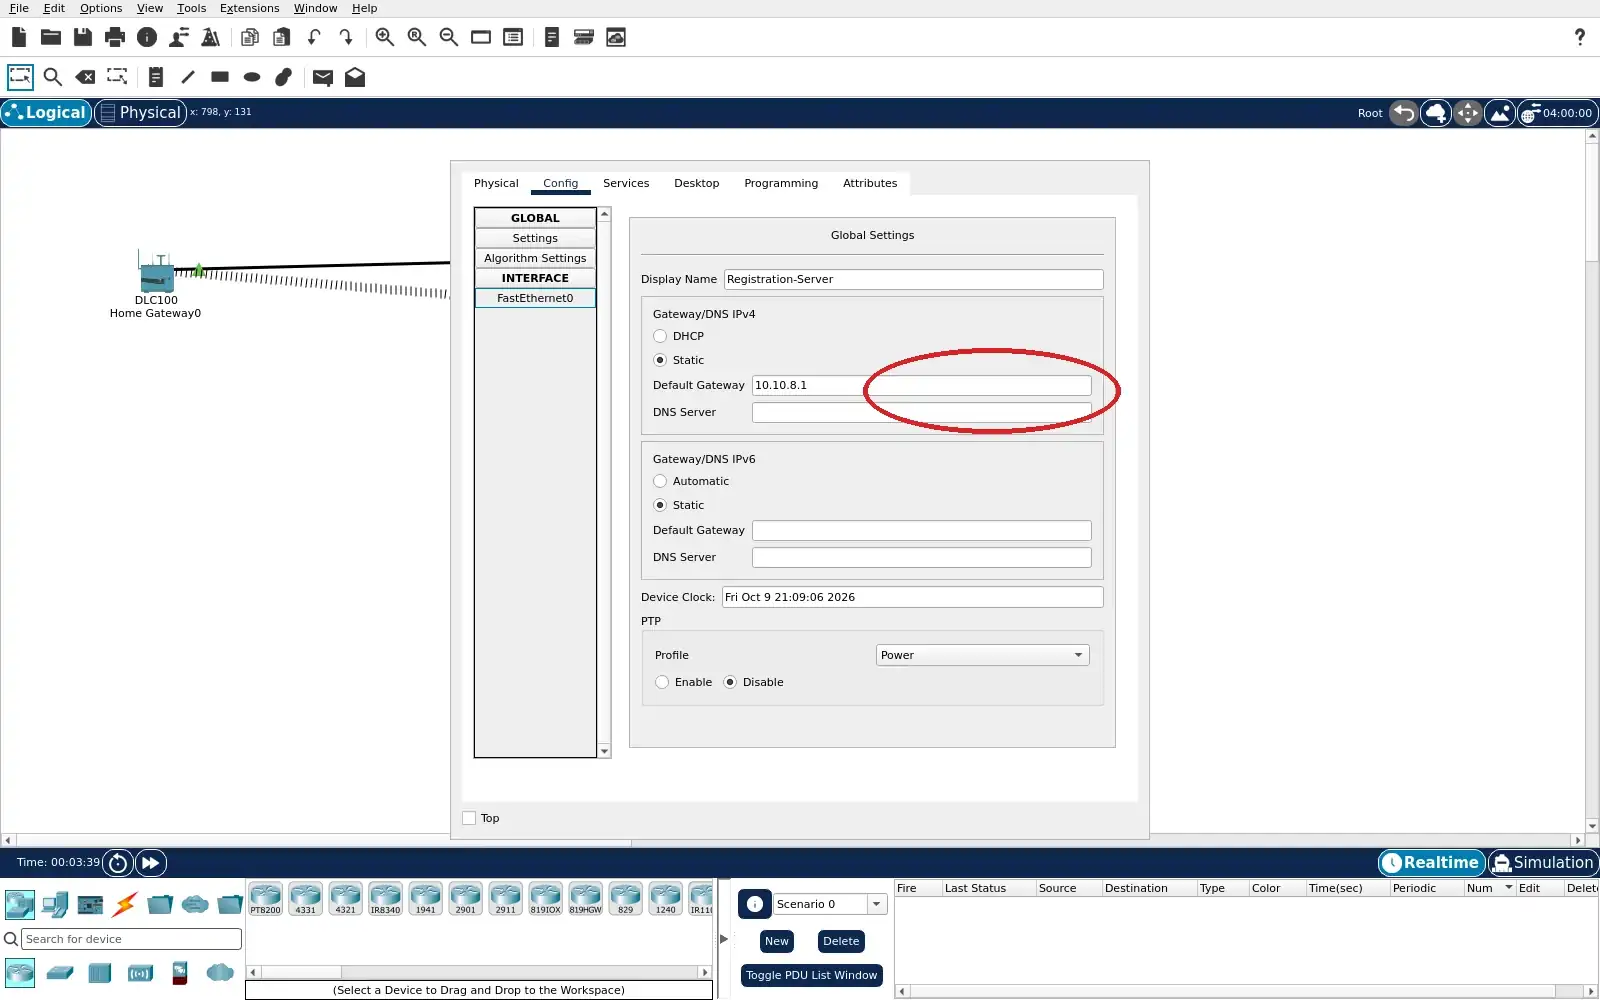
Step 3 · Cisco Packet Tracer; numbered callout added to a real capture. Enlarge screenshot (new tab) Step 4
- Do
- Stay in Registration-Server and select Services. Choose IoT from the service list. Read the page heading and Service radio state. Notice the disposable account row saved in this project.
- You will see
- The page heading reads Registration Server. The Service radio option On is selected. One lab8-demo exercise account row is visible. The page says this service runs on HTTP or HTTPS.
- Why it matters
- This establishes the service type and enabled state. An account is the identity boundary for the browser and Thing. The account is disposable simulation data. It does not prove secure transport or protocol translation.
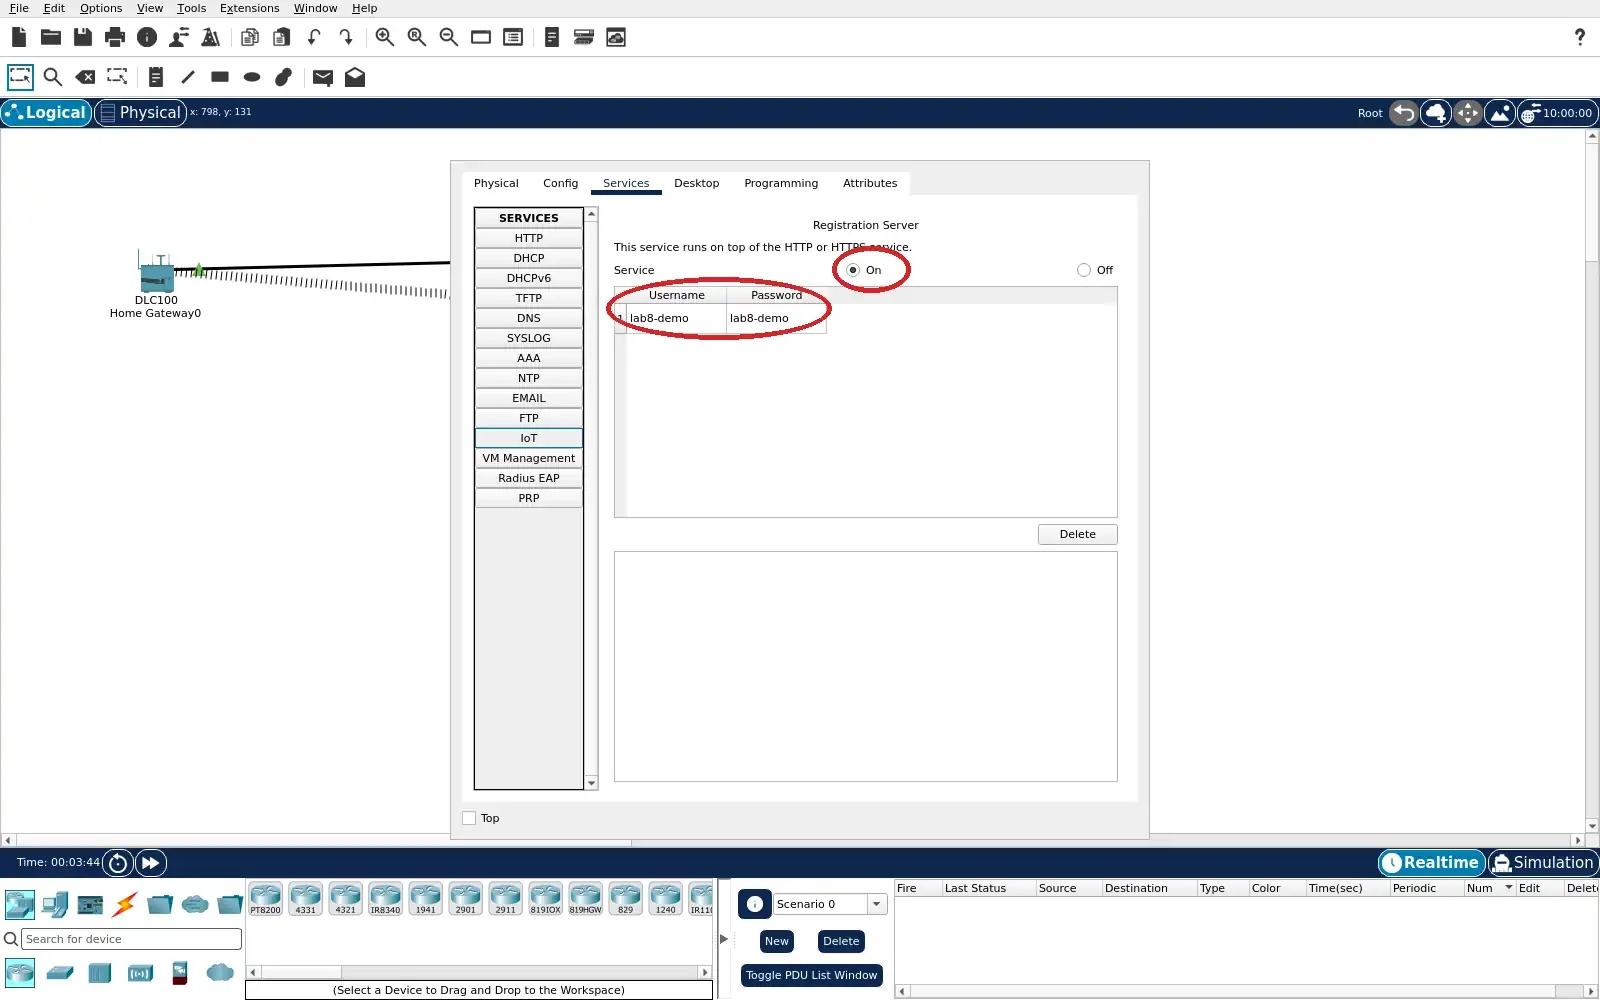
Step 4 · Cisco Packet Tracer; numbered callout added to a real capture. Enlarge screenshot (new tab) Step 5
- Do
- Open Fan-Actuator and select Config. Choose Wireless0 in the interface list. Read SSID, Port Status and IPv4 settings. Compare its local address with the gateway LAN.
- You will see
- Wireless0 Port Status is On. SSID reads HomeGateway. Static IPv4 Address reads 192.168.25.102. Subnet Mask reads 255.255.255.0.
- Why it matters
- The fan has a local wireless association and address. The static address survives a project reopen in this exercise. The SSID alone does not create an IoT registration. The remote server target is a separate setting.
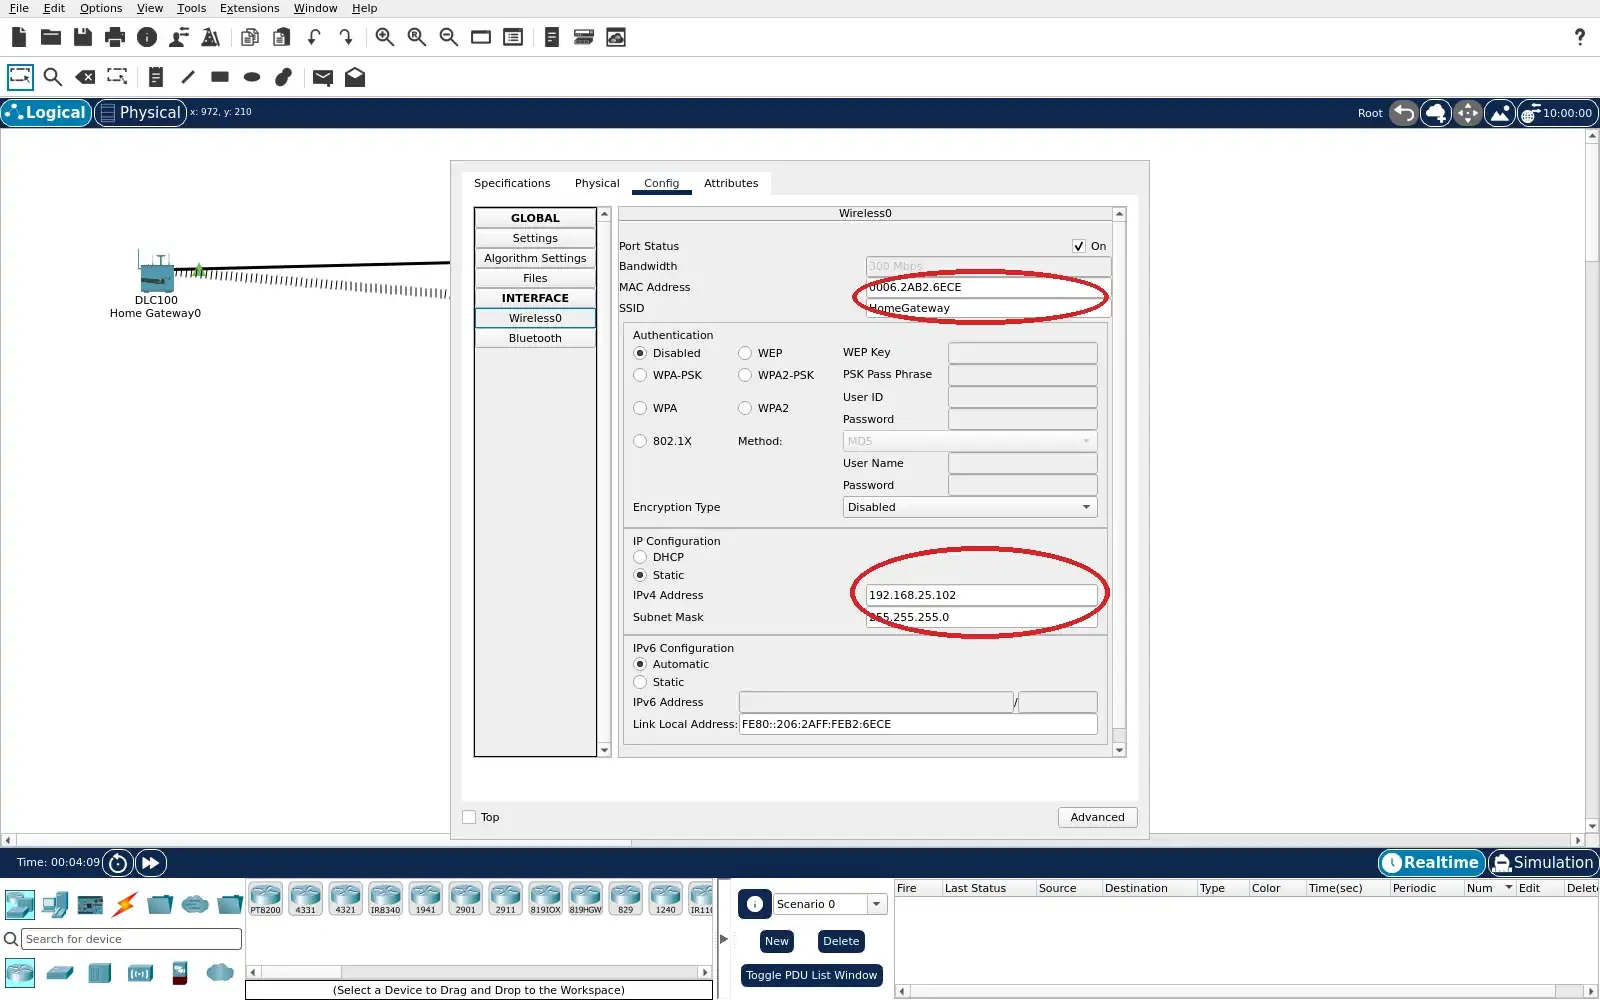
Step 5 · Cisco Packet Tracer; numbered callout added to a real capture. Enlarge screenshot (new tab) Step 6
- Do
- Select Fan-Actuator Config then Settings. Scroll to the IoT Server section. Read the selected Remote Server and target address. Check the action button after the connection settles.
- You will see
- Remote Server is selected. Server Address reads 10.10.8.10. The saved lab8-demo account fields are visible. The action button reads Refresh after connection.
- Why it matters
- The Thing names a service outside its local wireless subnet. The button state shows a connected registration session. A browser list is still needed to verify remote observation. These are disposable exercise credentials only.
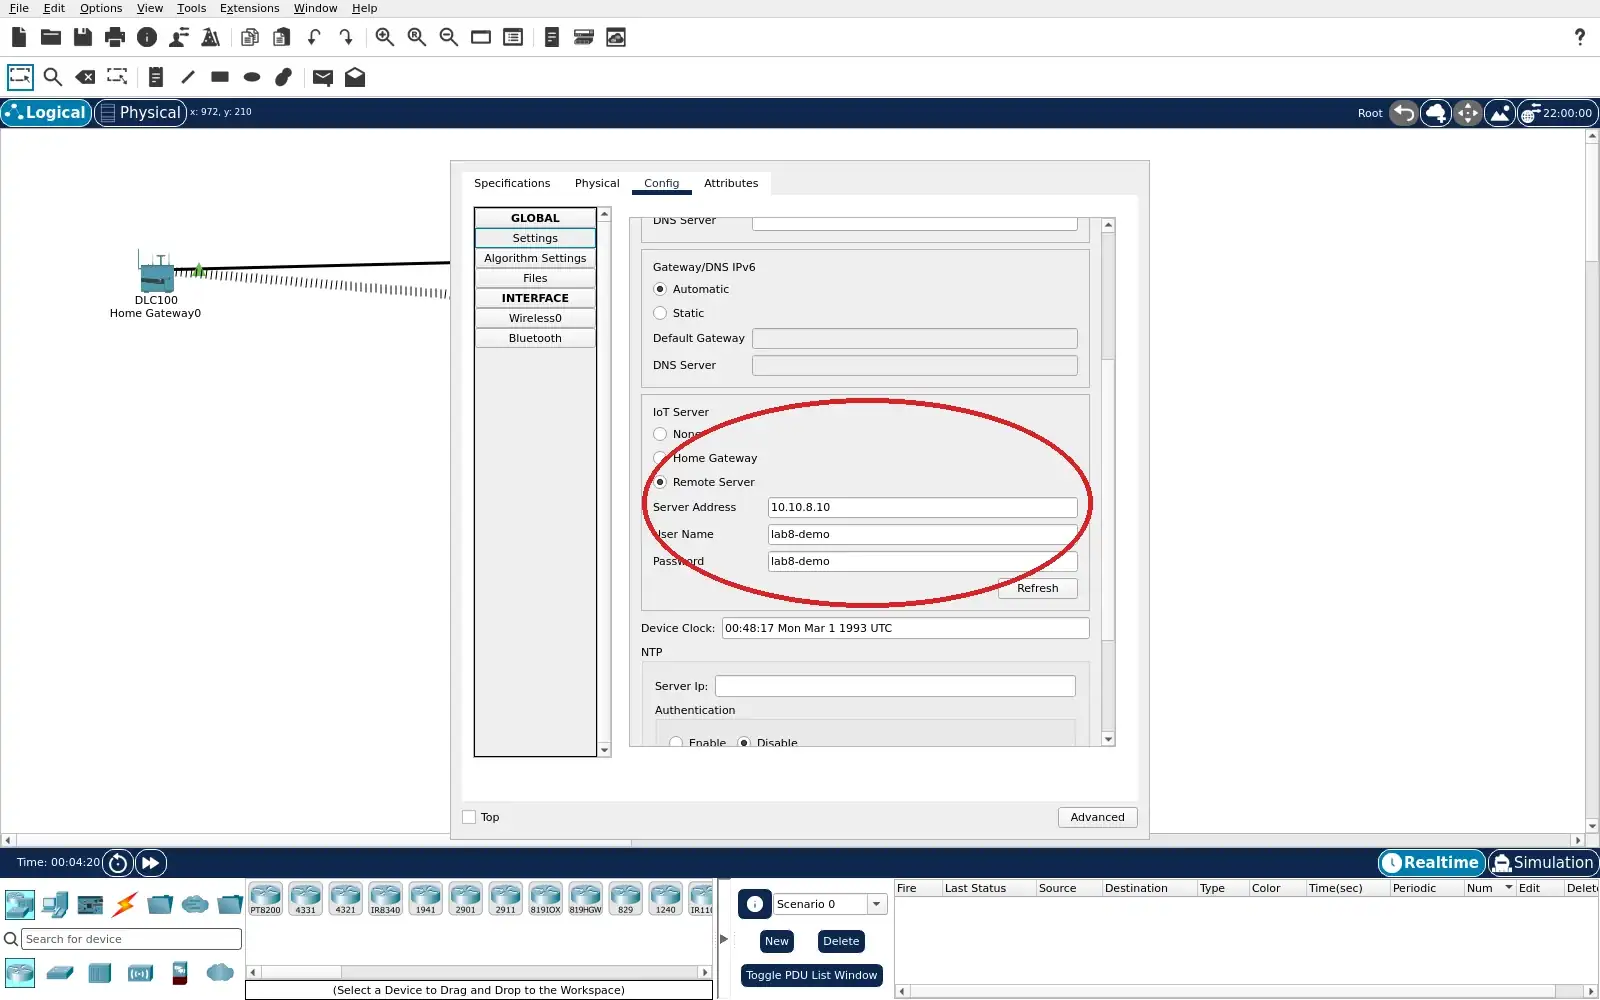
Step 6 · Cisco Packet Tracer; numbered callout added to a real capture. Enlarge screenshot (new tab) Step 7
- Do
- Expand Fan-Actuator on the operator dashboard. Read its Status row before changing it. Choose High in the browser control. Close Operator-PC to inspect the fan on the canvas.
- You will see
- Fan-Actuator is listed on the IoT Server page. The Status row shows High highlighted. The Off and Low controls remain unselected. The real PT canvas then shows fan motion marks.
- Why it matters
- The server accepted a simulated operator command. The dashboard state is visible after registration. Motion marks are PT animation, not current measurement. A local action next tests observation in the other direction.
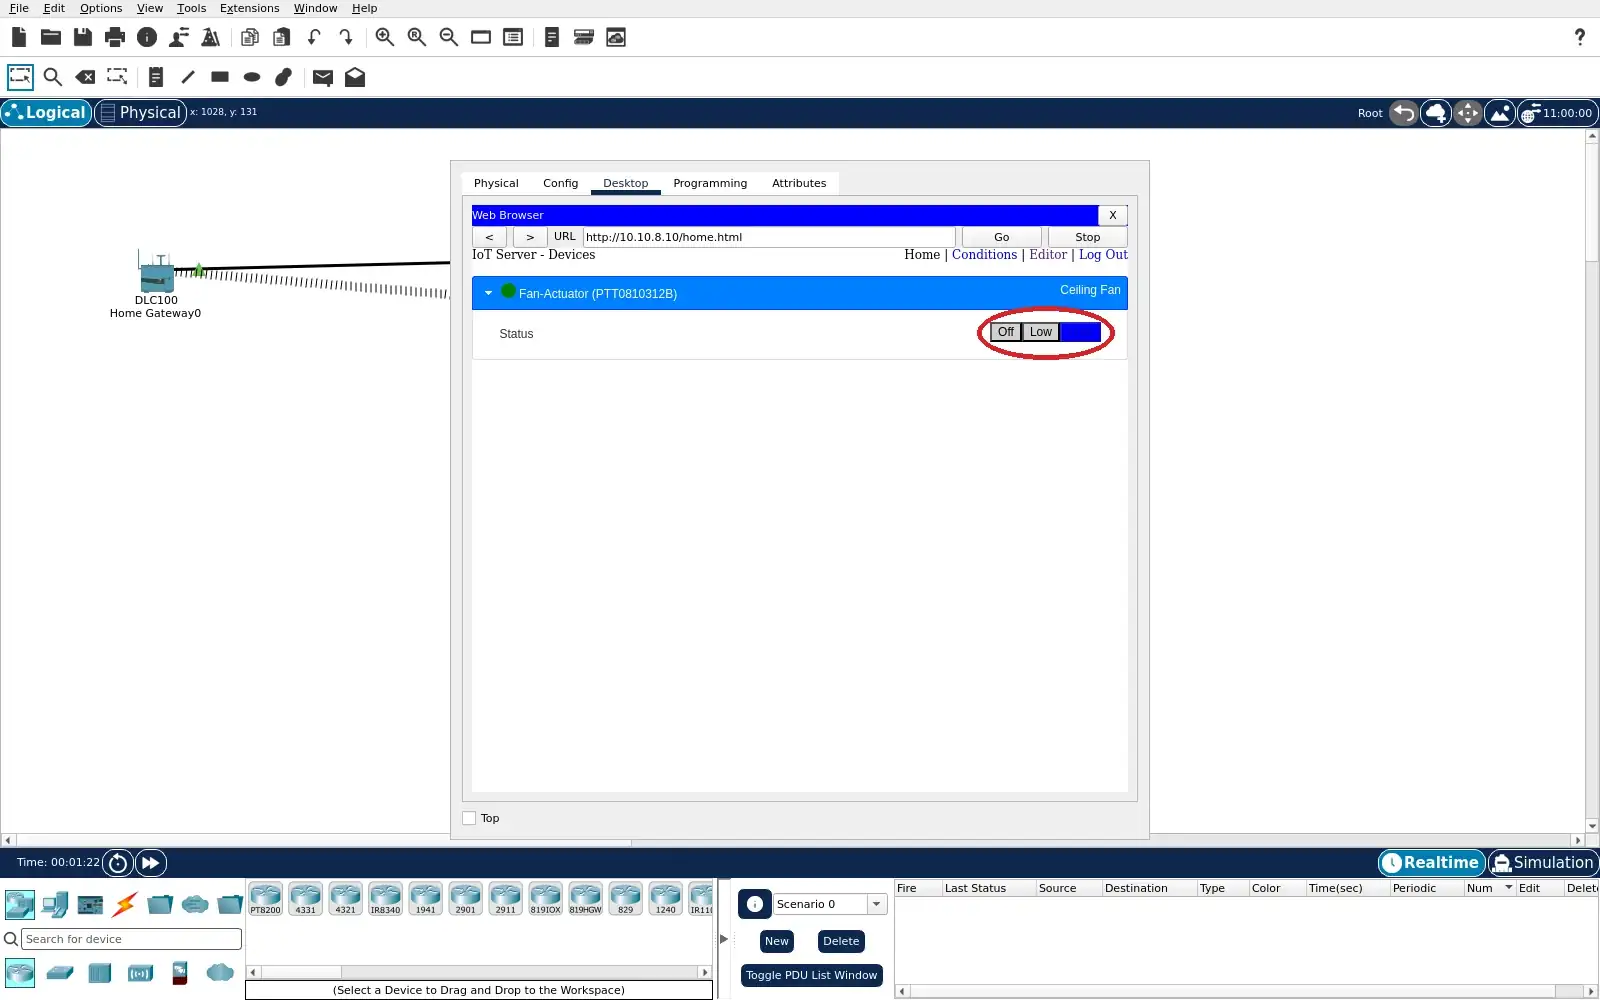
Step 7 · Cisco Packet Tracer; numbered callout added to a real capture. Enlarge screenshot (new tab) Step 8
- Do
- With Operator-PC closed, hold Alt and click Fan-Actuator once. Reopen Operator-PC and use the browser Go button on /home.html. Expand Fan-Actuator if needed. Compare the highlighted Status with the prior High capture.
- You will see
- The local canvas fan becomes still after the Alt-click. The browser keeps Fan-Actuator in the device list. Status now highlights Off instead of High. The operator view reflects the local simulated change.
- Why it matters
- The two captures show different Thing states. The remote page observed the local action after refresh. This checks the application path, not only IP reachability. No physical motor behavior is measured.
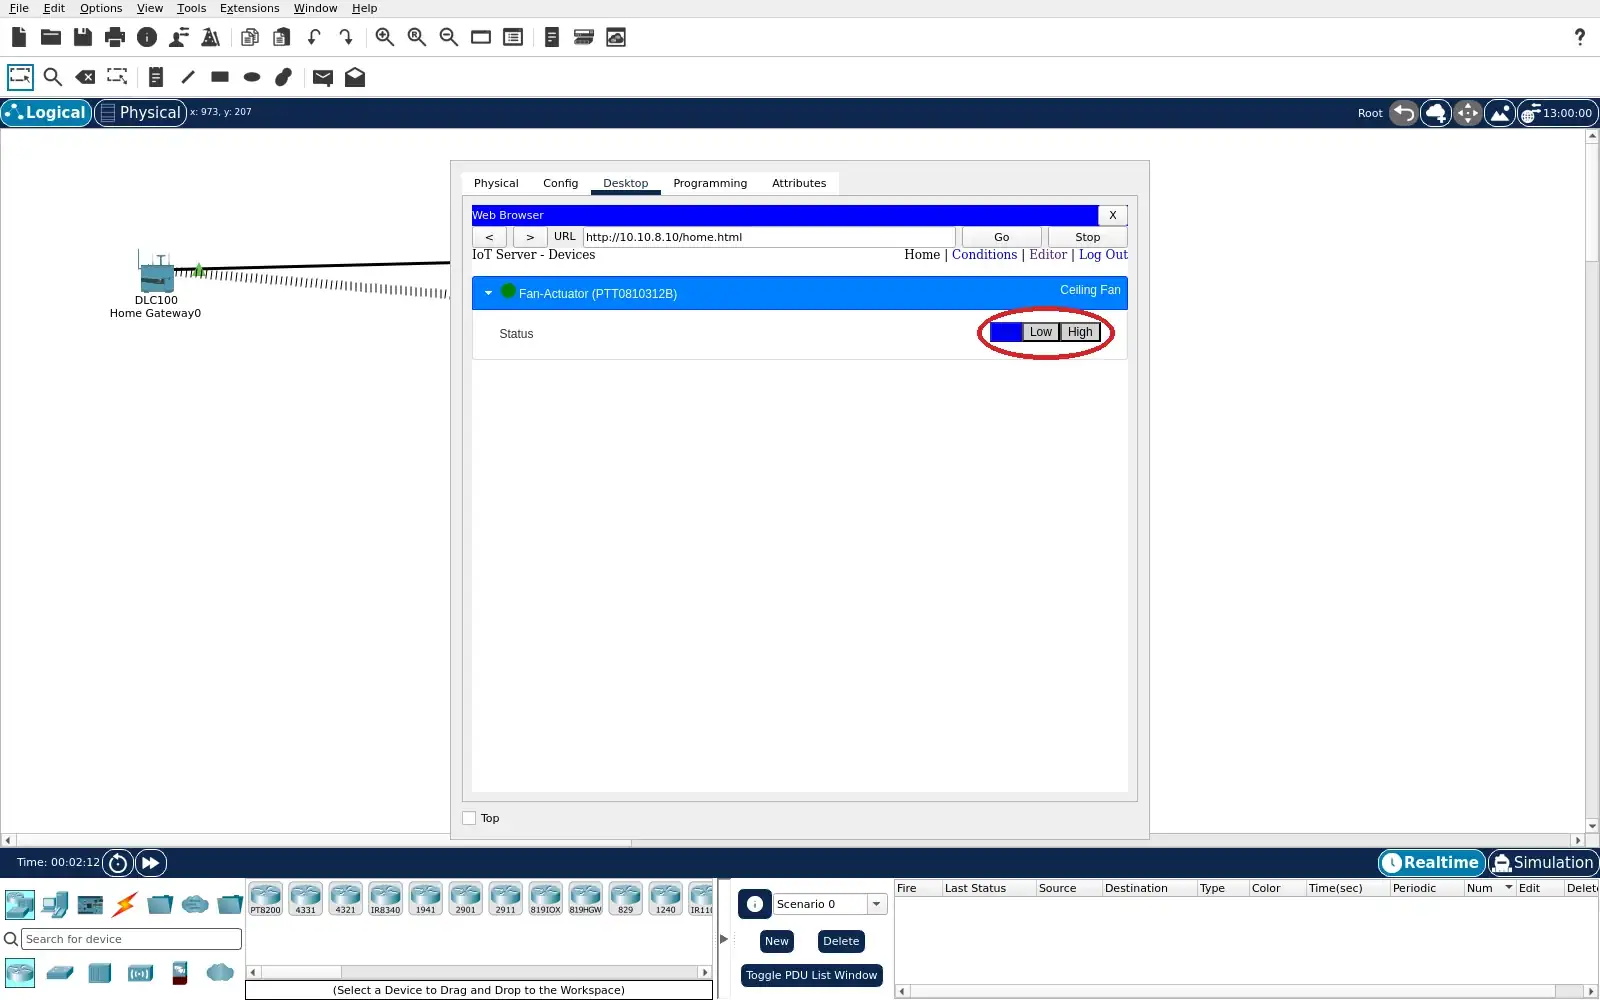
Step 8 · Cisco Packet Tracer; numbered callout added to a real capture. Enlarge screenshot (new tab) Step 9
- Do
- Open Registration-Server Config tab then FastEthernet0. Clear Port Status On for a temporary server-link fault. Navigate the operator browser to the retry URL in the README. Restore Port Status On after inspecting the result.
- You will see
- The server link markers turned red during this test. The operator browser URL contains ?retry=lab8. The page says Request Timeout. The fan remained visible on its local wireless canvas path.
- Why it matters
- The remote request depends on the server-facing path. A previously drawn dashboard can be stale after link loss. A fresh navigation exposes the failed request. Restoring the port returns the saved exercise network.
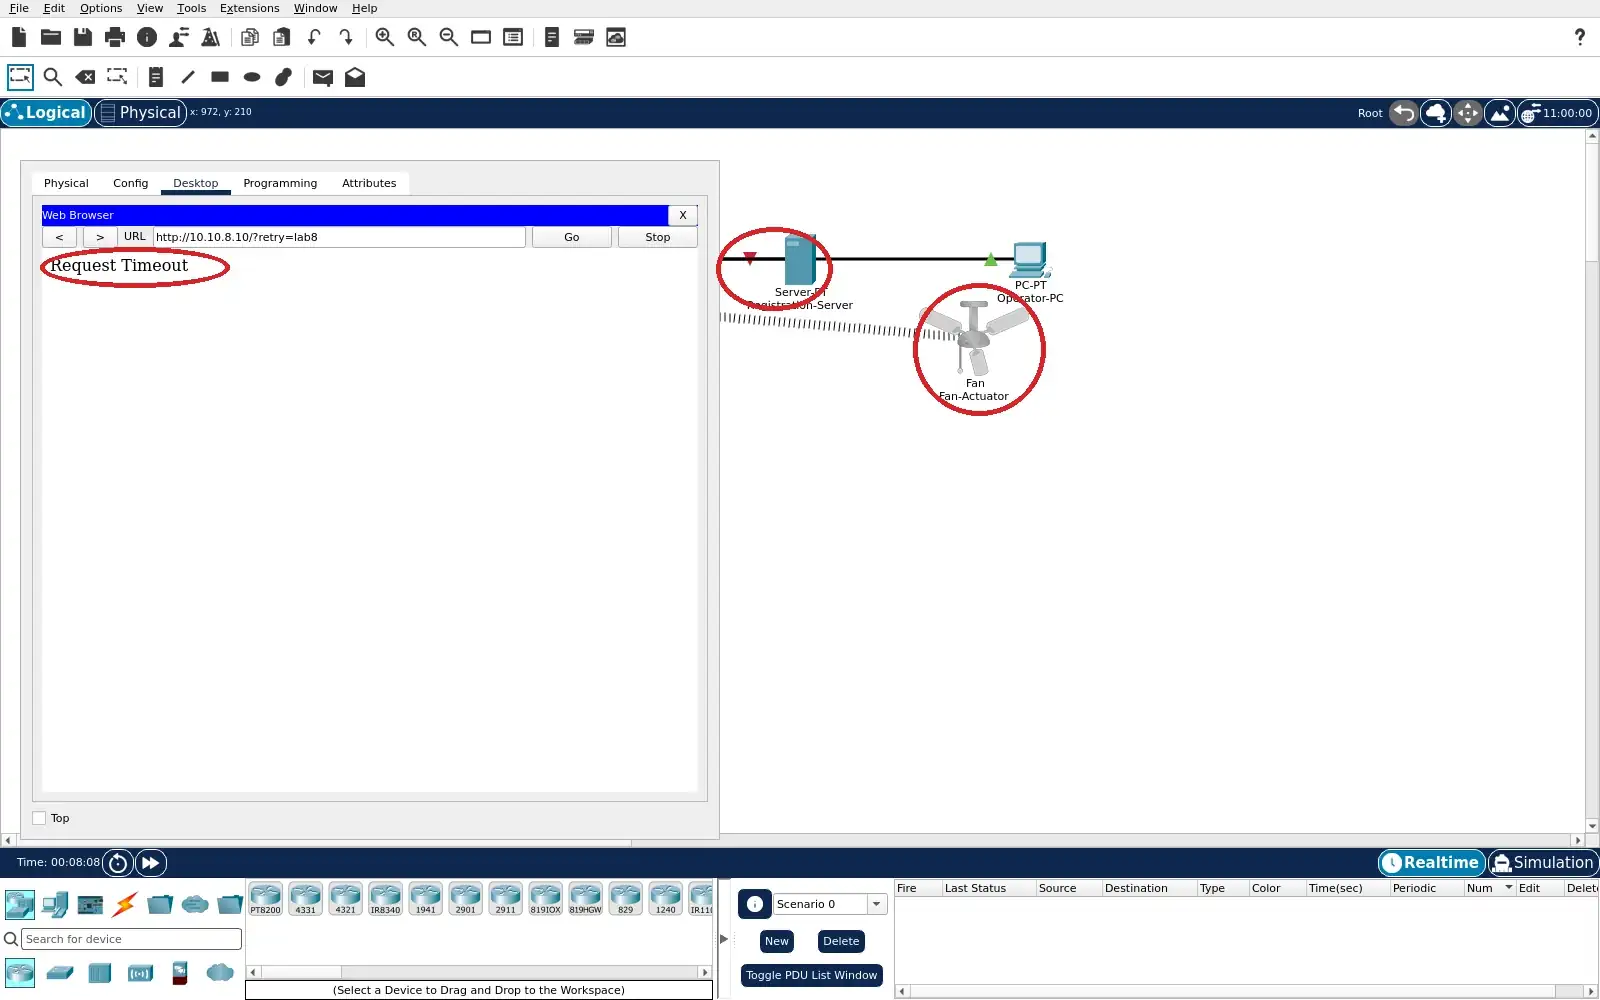
Step 9 · Cisco Packet Tracer; numbered callout added to a real capture. Enlarge screenshot (new tab)
Chapter checks
These questions refer to the chapter’s examples. Use the return links to review their answers.
Why is a protocol bridge more than converting bytes from one protocol to another?
Return to the chapter’s knowledge checkA gateway polls a legacy meter every 10 seconds and publishes results to an event stream. The meter stops responding for one minute. What should the gateway do?
Return to the chapter’s knowledge check