Separate synthetic radar breathing and heartbeat cues
Recover simulated breathing and heartbeat peaks while rejecting a gross-motion window and retaining the medical boundary.
Radio Remi: predict first, inspect every intermediate value, and keep the claim inside the evidence.
Predict the reading, then compare it with the measurement.
Python 3 in your browser (JupyterLite)
Python · no installRecover simulated breathing and heartbeat peaks while rejecting a gross-motion window and retaining the medical boundary.
Open the notebook in your browser and run each Python cell; no install or account is needed.
Three ways to run: use JupyterLite here with no install; run main.py locally from the downloadable lab folder; or open the same notebook in Google Colab.
Steps
Step 1
- Do
- Predict the stronger peak before running the fixture.
- You will see
- The seed, sampling rate, two known frequencies, and synthetic status print.
- Why it matters
- These bands are useful teaching ranges, not universal diagnostic limits.
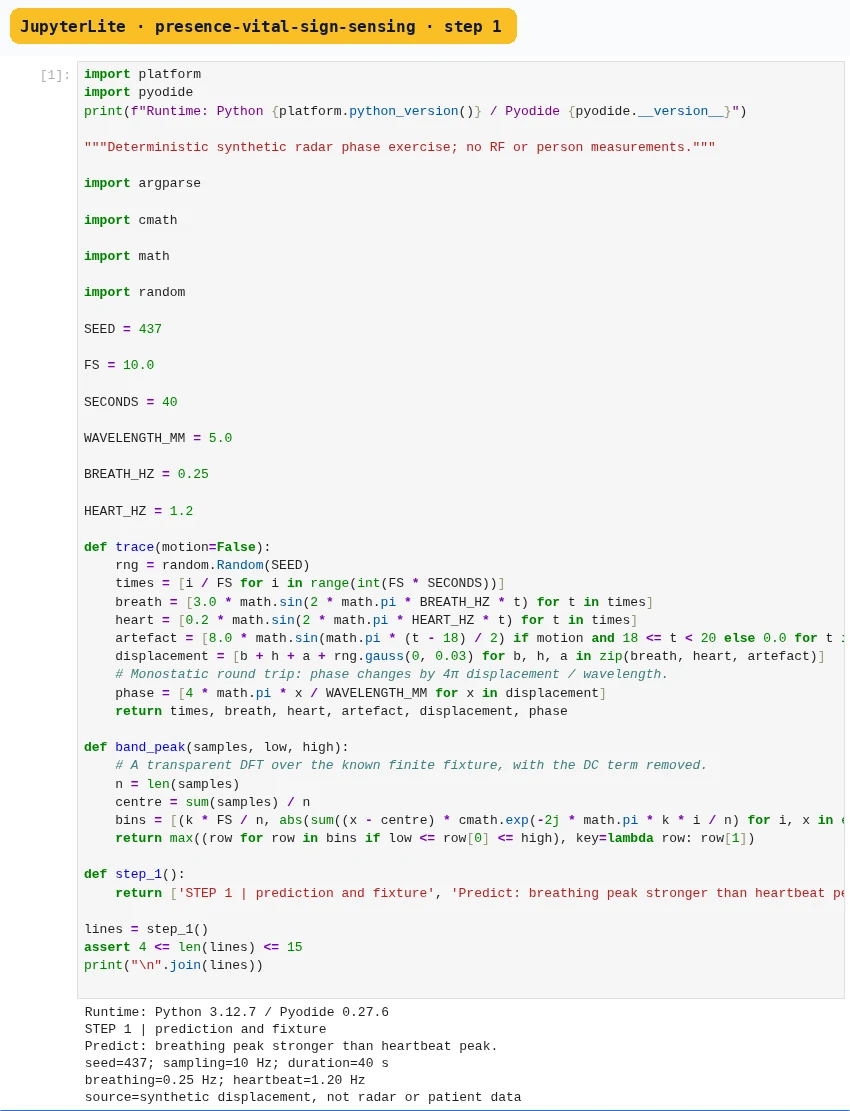
Step 1 · Python 3 in your browser (JupyterLite); numbered callout added to a real capture. Enlarge screenshot (new tab) Step 2
- Do
- Generate a chest displacement and monostatic phase trace.
- You will see
- The model equation, sample count, first displacement, and phase print.
- Why it matters
- Shorter wavelengths create more phase change for the same motion, but wrapping, noise, multipath, and poor target selection still matter.
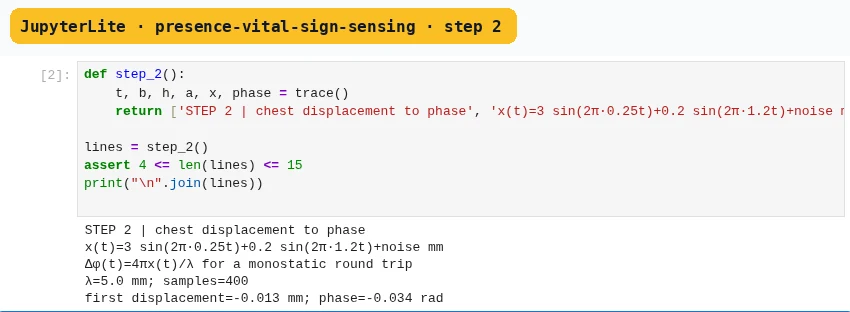
Step 2 · Python 3 in your browser (JupyterLite); numbered callout added to a real capture. Enlarge screenshot (new tab) Step 3
- Do
- Compare the breathing and heartbeat components.
- You will see
- The component amplitudes and combined displacement range print.
- Why it matters
- Large motion spreads energy across frequencies and can shift phase by many cycles.
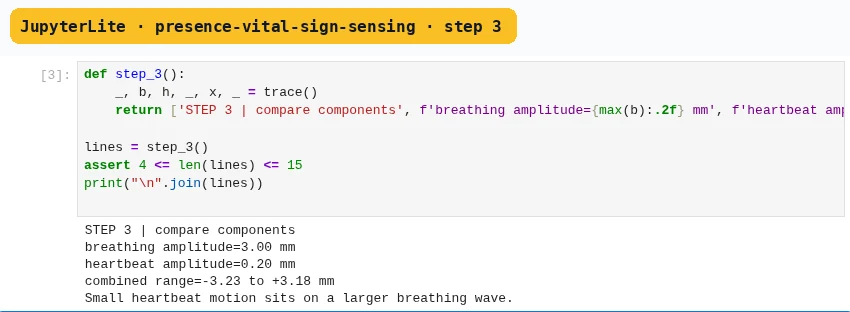
Step 3 · Python 3 in your browser (JupyterLite); numbered callout added to a real capture. Enlarge screenshot (new tab) Step 4
- Do
- Search only the stated breathing and heartbeat bands.
- You will see
- Peak frequencies, cycles per minute, and strength ratio print.
- Why it matters
- A band-pass filter can separate slow breathing energy from faster heartbeat energy in a clean simulated trace.
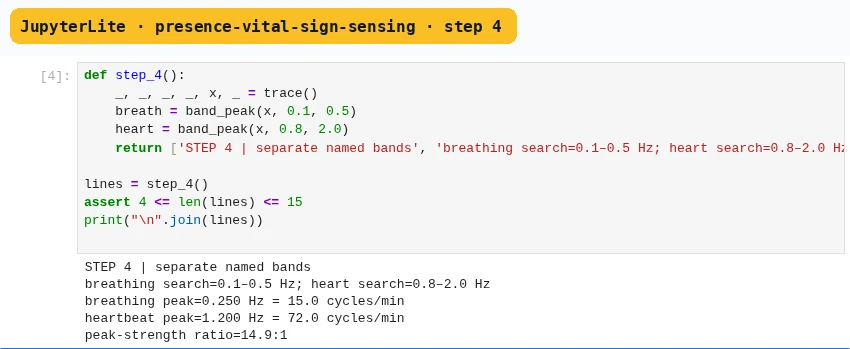
Step 4 · Python 3 in your browser (JupyterLite); numbered callout added to a real capture. Enlarge screenshot (new tab) Step 5
- Do
- Inject a large movement and reject its window.
- You will see
- The contaminated sample count and peak displacement print with an abstention.
- Why it matters
- A robust pipeline first detects motion or low signal quality, then abstains before calculating rates.
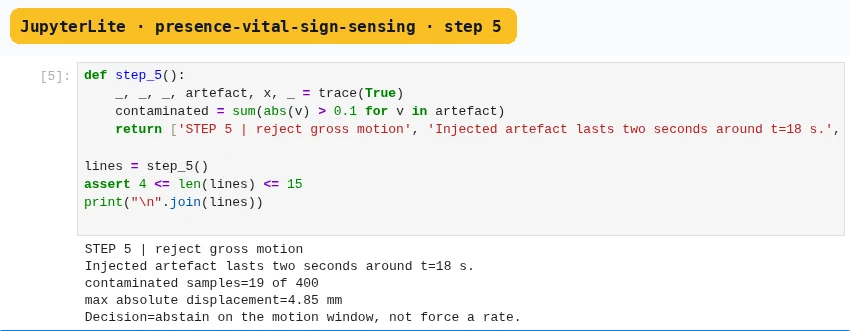
Step 5 · Python 3 in your browser (JupyterLite); numbered callout added to a real capture. Enlarge screenshot (new tab) Step 6
- Do
- Score the clean fixture and report accepted-window coverage.
- You will see
- Rate errors and a 75 percent accepted-window fraction print.
- Why it matters
- It should retain the rejected window and reason instead of deleting inconvenient evidence.
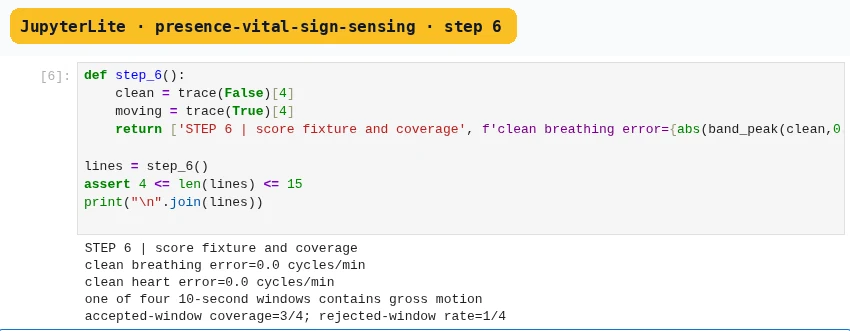
Step 6 · Python 3 in your browser (JupyterLite); numbered callout added to a real capture. Enlarge screenshot (new tab) Step 7
- Do
- Write a bounded result card.
- You will see
- The card states simulated rates, rejection, missing measurements, and no medical claim.
- Why it matters
- The lab in this chapter teaches phase and filtering with synthetic signals only.
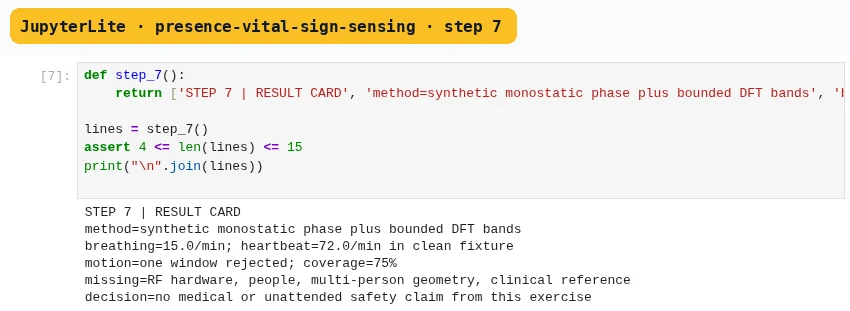
Step 7 · Python 3 in your browser (JupyterLite); numbered callout added to a real capture. Enlarge screenshot (new tab)
Chapter checks
These questions refer to the chapter’s examples. Use the return links to review their answers.
Why should a large-motion window be rejected before estimating breathing or heart rate?
Return to the chapter’s knowledge checkWhat does a 0.25 Hz peak prove here?
Return to the chapter’s knowledge check
Return to Presence and Vital-Sign Sensing with Radar and Wi-Fi · Browse Labs