Measure I2C pull-up rise time
Configure an I2C pull-up for a synthetic 100 pF sensor bus and measure whether its 30–70% rising edge fits Standard-mode and Fast-mode timing.

Predict which resistor will give the steepest scope edge, then compare the measured crossings with the bus limits.
Predict the reading, then compare it with the measurement.
Falstad CircuitJS
Third party ToolConfigure an I2C pull-up for a synthetic 100 pF sensor bus and measure whether its 30–70% rising edge fits Standard-mode and Fast-mode timing.
Open the prepared circuit.
Open this circuit in Falstad (new tab)Steps
Step 1
- Do
- In the Falstad circuit canvas, open the 2.2 kΩ circuit. Identify the 3.3 V source, pull-up, 100 pF bus capacitor, and n-MOSFET sink driven at 100 kHz.
- You will see
- The 3.3 V source feeds the 2.2 kΩ pull-up. The bus capacitor is 100 pF. The gate source switches between 0 and 5 V at 100 kHz. The bottom scope traces the bus voltage.
- Why it matters
- The synthetic design case has seed 1 and no random draws. The MOSFET pulls low; the resistor charges the capacitance after release.
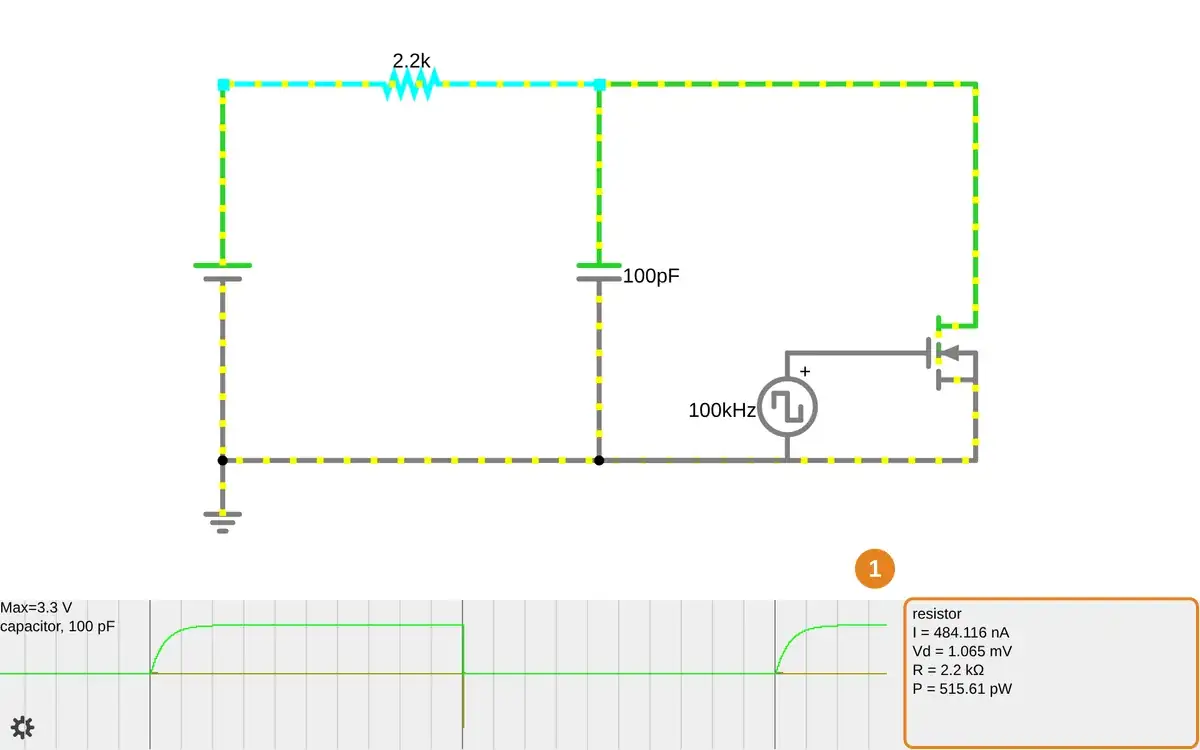
Step 1 · Falstad CircuitJS; numbered callout added to a real capture. Enlarge screenshot (new tab) Step 2
- Do
- In the Falstad circuit canvas, on the scope, locate a rising edge after the sink releases. Record the 0.99 V and 2.31 V crossing times from the running CircuitJS element voltage. For a repeatable readout, use the CircuitJS Console recipe at /practice/i2c-pullup-rise-time/README.md.
- You will see
- For 2.2 kΩ: 30% crossing 5.085 µs; 70% crossing 5.275 µs. The difference is 190 ns at a 5 ns simulator step. The bus approaches 3.3 V after release.
- Why it matters
- The 30–70% interval is the I2C rise-time comparison; quoting both crossings makes the measured difference checkable.
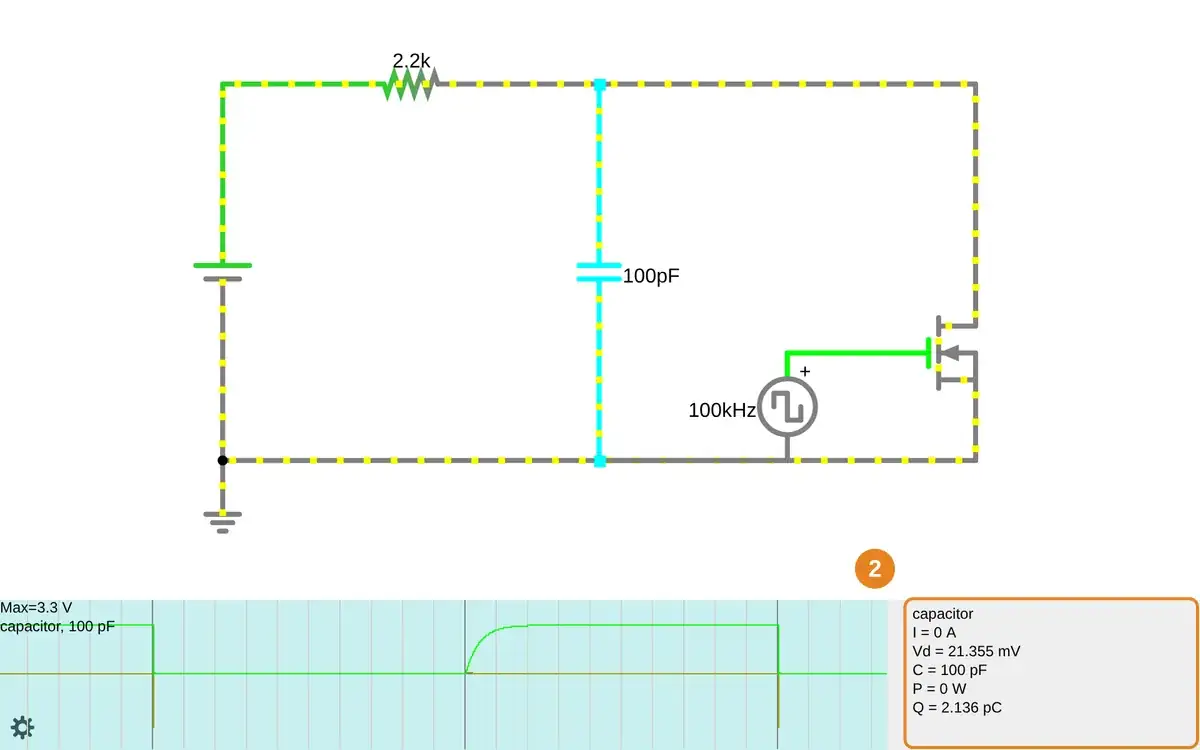
Step 2 · Falstad CircuitJS; numbered callout added to a real capture. Enlarge screenshot (new tab) Step 3
- Do
- In the Falstad circuit canvas, open the 4.7 kΩ circuit with the same 3.3 V, 100 pF, 100 kHz sink and scope setting. Read the next rising edge.
- You will see
- For 4.7 kΩ: 30% crossing 5.175 µs; 70% crossing 5.575 µs. The measured rise is 400 ns. The visible scope edge is slower than the 2.2 kΩ case.
- Why it matters
- Only the pull-up changes, so a longer charge interval can be attributed to the higher resistance in this model.
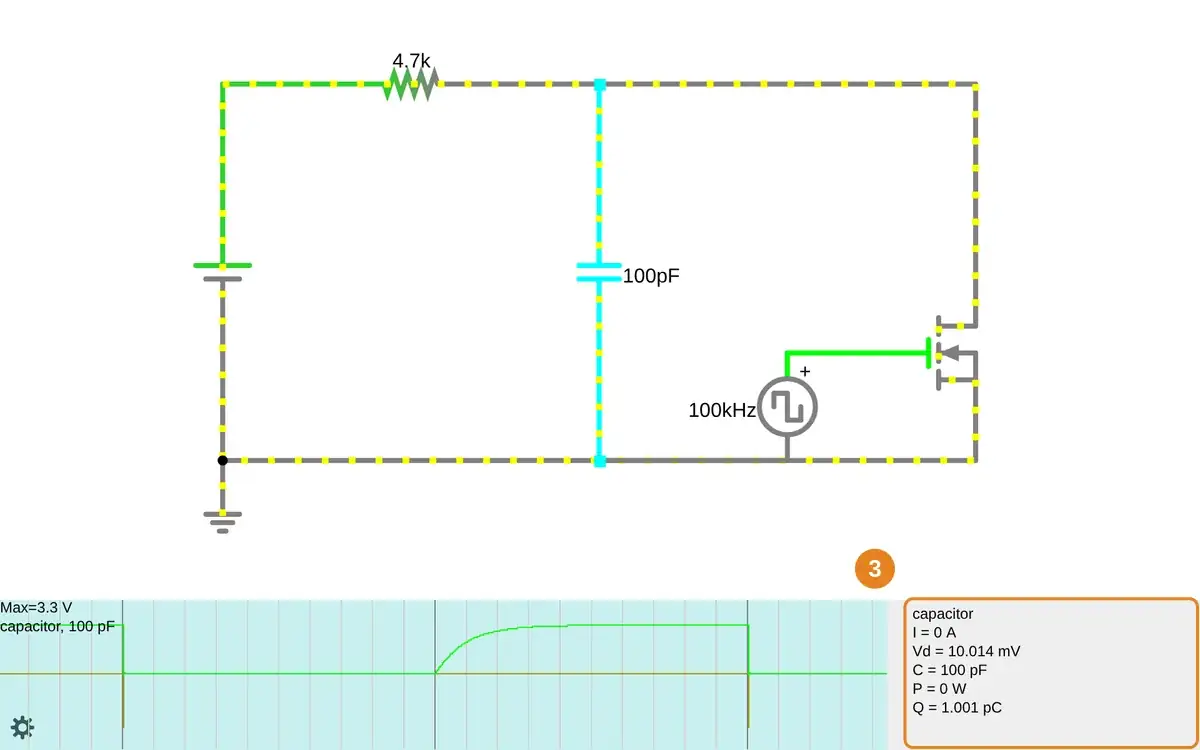
Step 3 · Falstad CircuitJS; numbered callout added to a real capture. Enlarge screenshot (new tab) Step 4
- Do
- In the Falstad circuit canvas, open the 10 kΩ circuit, keeping the bus capacitance and sink waveform fixed. Measure the same two voltage crossings.
- You will see
- For 10 kΩ: 30% crossing 5.365 µs; 70% crossing 6.215 µs. The measured rise is 850 ns. The scope shows the longest rounded edge of the three runs.
- Why it matters
- The larger resistor weakens the pull-up, increasing the time the bus spends between logic thresholds.
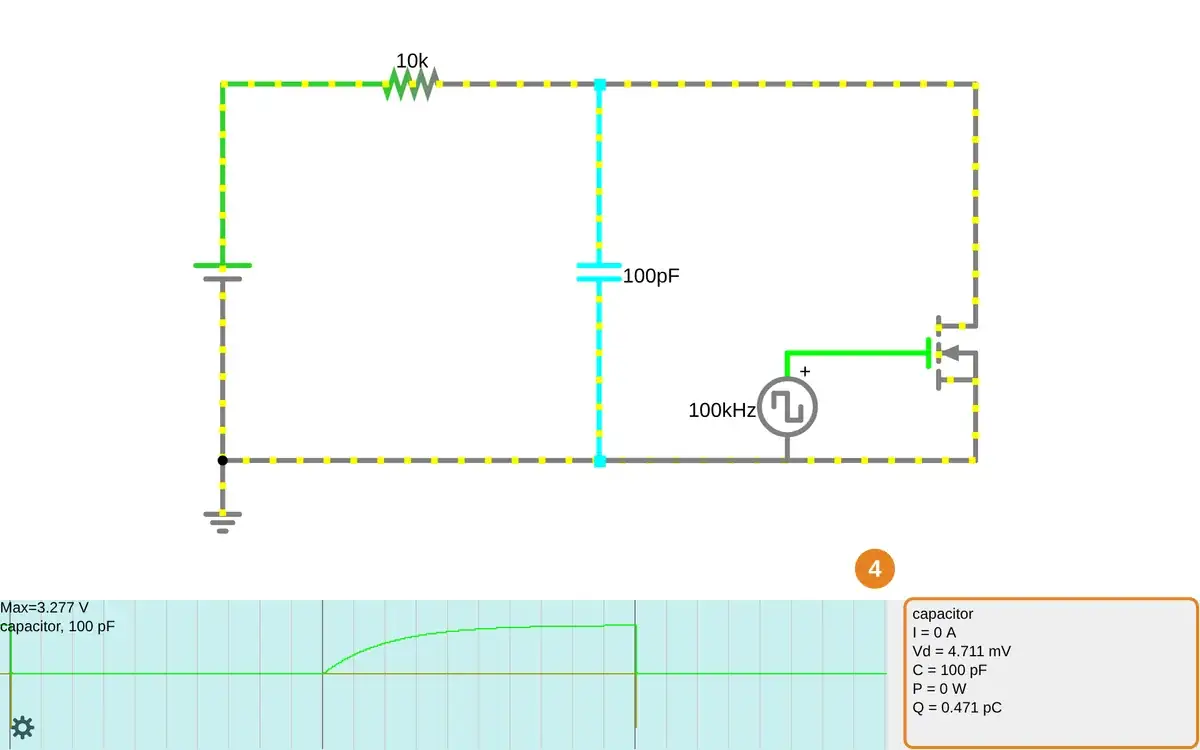
Step 4 · Falstad CircuitJS; numbered callout added to a real capture. Enlarge screenshot (new tab) Step 5
- Do
- In the Falstad circuit canvas, compare the three recorded 30–70% rises with NXP UM10204 Rev. 7.0, timing table: Standard-mode maximum 1000 ns and Fast-mode maximum 300 ns.
- You will see
- CircuitJS measured 190 ns (2.2 kΩ), 400 ns (4.7 kΩ), and 850 ns (10 kΩ). All three are below 1000 ns; only 2.2 kΩ is below 300 ns. NXP table values are 1000 ns and 300 ns.
- Why it matters
- The model isolates pull-up and capacitance. Check real sink-current, device pins, and waveform margins before choosing a board resistor.
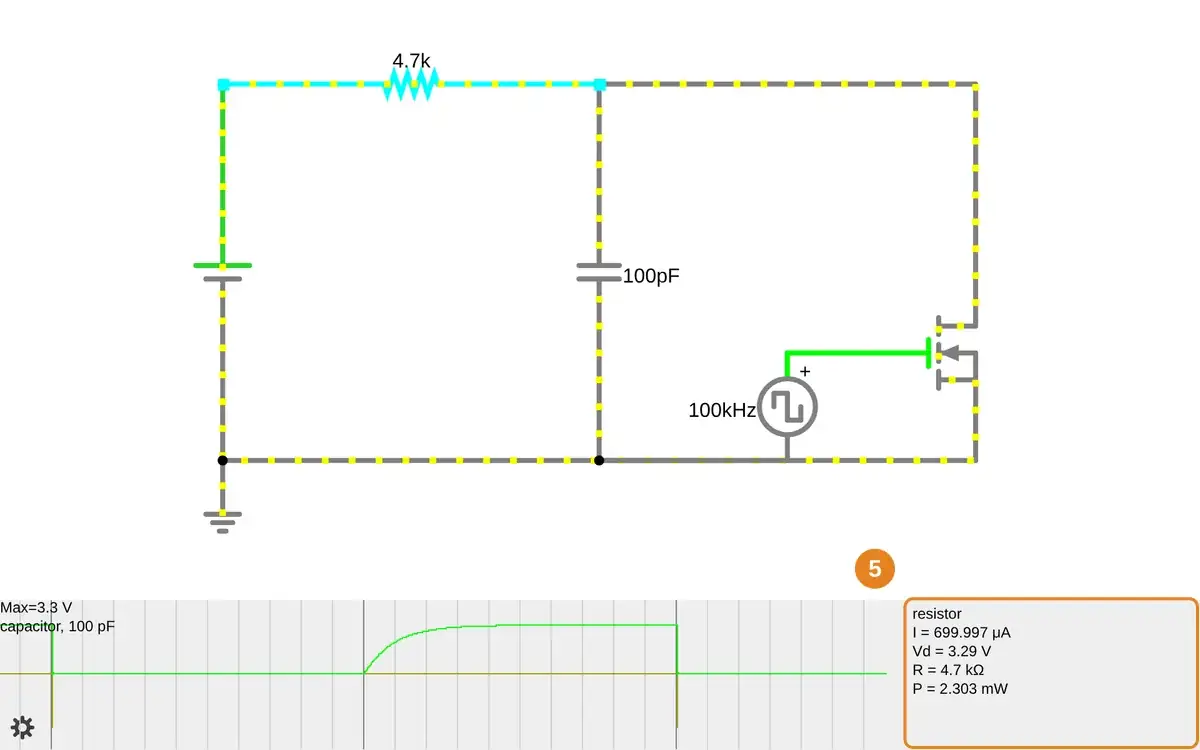
Step 5 · Falstad CircuitJS; numbered callout added to a real capture. Enlarge screenshot (new tab)
Chapter checks
These questions refer to the chapter’s examples. Use the return links to review their answers.
Per Phoebe's Field Notes, why can't a 4.7 kOhm pull-up reliably run an I2C bus at the full 400 pF capacitance ceiling, even at just 100 kHz (Standard mode)?
Return to the chapter’s knowledge checkIn the I2C protocol, what does Wire.endTransmission(false) do differently from Wire.endTransmission(true)?
Return to the chapter’s knowledge check