Compare WSN delivery and simulated radio cost
Compare delivered synthetic samples with network-wide radio transmissions before, during, and after one degraded directed link.

Choose a WSN chapter from design evidence: sensing goal, energy budget, coverage need, communication pattern, mobility, and review risk.
Predict the reading, then compare it with the measurement.
Contiki-NG Cooja
Third party ToolCompare delivered synthetic samples with network-wide radio transmissions before, during, and after one degraded directed link.
Download the complete lab packet and follow README.md to run it in the free simulator.
Download the setup and run guideGet the lab files
Download the complete packet for the simulation and its firmware, or download individual files for inspection. README.md gives the setup and run commands.
Steps
Step 1
- Do
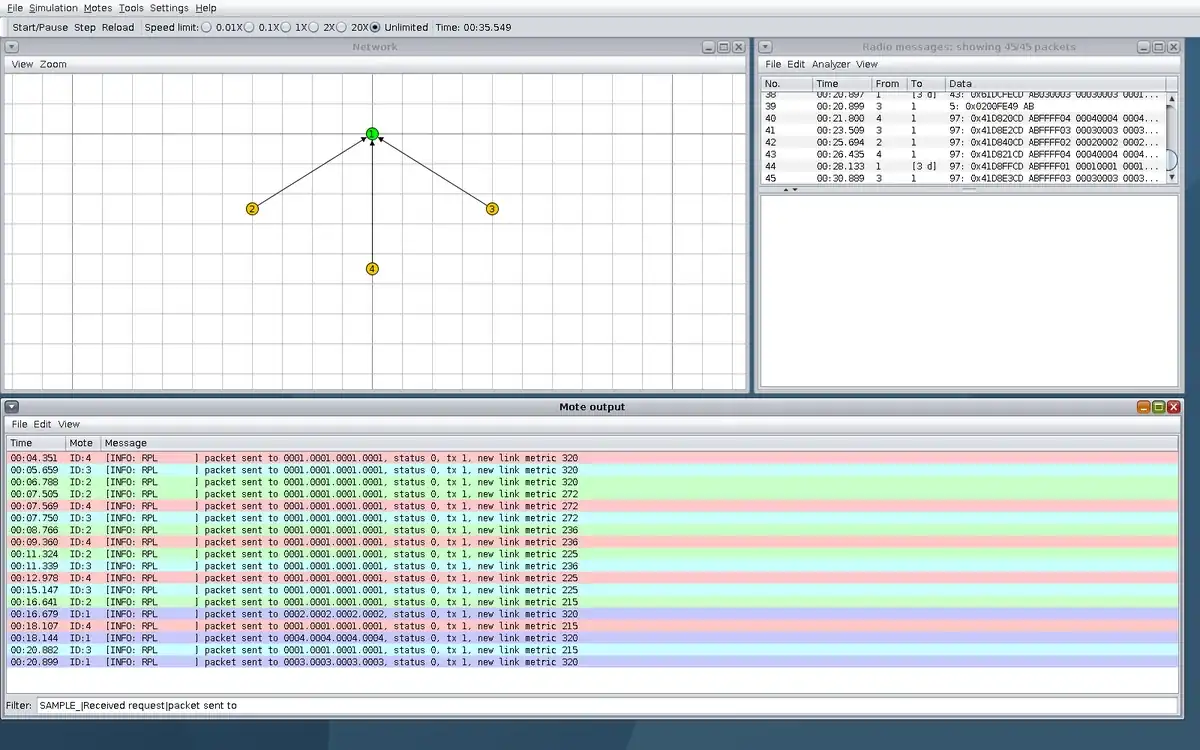
- Open the CSC in Cooja Network and identify sink 1 and senders 2, 3, and 4 before the first sample.
- You will see
- Run: random seed 1; six directed star edges initially have ratio 1.0. Radio messages: 45 cumulative frames at 35 s. Mote output: all four node IDs have booted.
- Why it matters
- Meaning: The fixed simulated topology and node identities are visible. Boundary: Startup radio frames are not application sample receipts.
Step 1 · Contiki-NG Cooja; numbered callout added to a real capture. Enlarge screenshot (new tab) Step 2
- Do
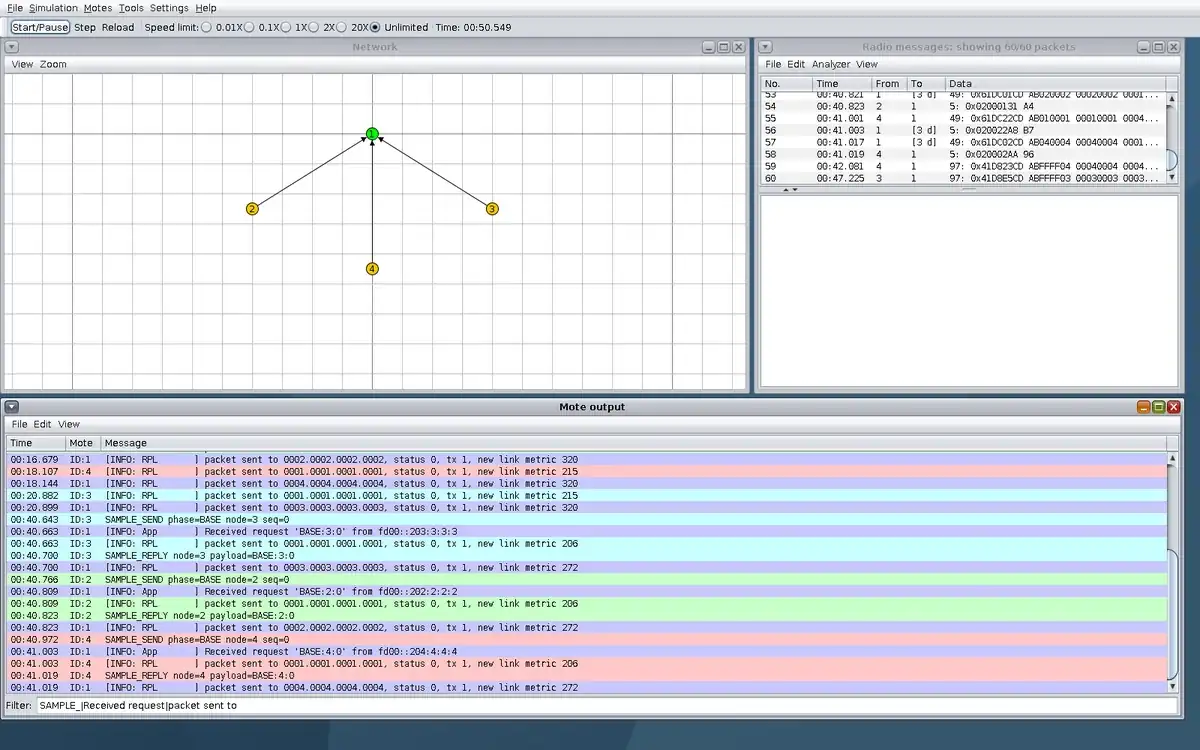
- Click Start/Pause and match one BASE sample from each sender with a sink receipt in Mote output.
- You will see
- Serial: `40643000 ID:3 SAMPLE_SEND phase=BASE node=3 seq=0` Serial: `40766000 ID:2 SAMPLE_SEND phase=BASE node=2 seq=0` Serial: `40972000 ID:4 SAMPLE_SEND phase=BASE node=4 seq=0` Run summary: `BASE` sent 3, delivered 3. Radio messages: 60 cumulative frames at 50 s.
- Why it matters
- Meaning: The sink received the one-sample-per-node baseline. Boundary: This short baseline does not measure delivery reliability.
Step 2 · Contiki-NG Cooja; numbered callout added to a real capture. Enlarge screenshot (new tab) Step 3
- Do
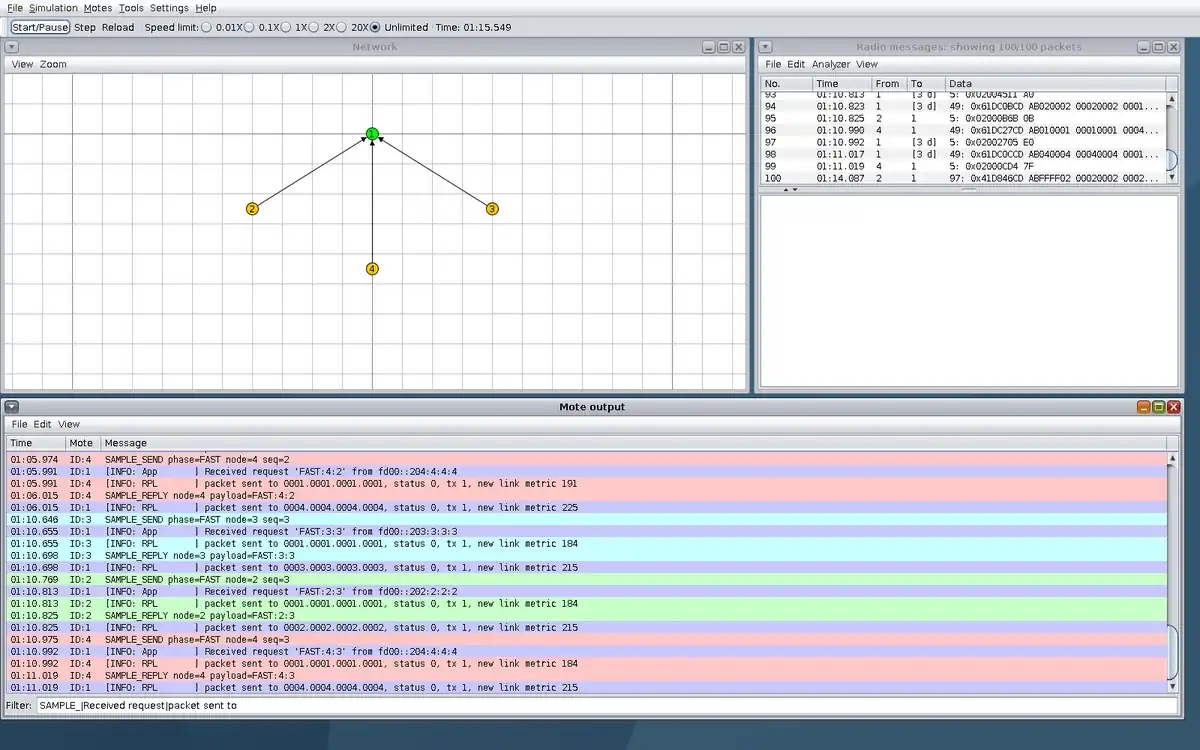
- Click Start/Pause and compare the denser FAST phase with the baseline in Mote output and Radio messages.
- You will see
- Serial: `60973000 ID:4 SAMPLE_SEND phase=FAST node=4 seq=1` Serial: `70975000 ID:4 SAMPLE_SEND phase=FAST node=4 seq=3` Run summary: `FAST` sent 18, delivered 18; 75 radio transmissions in 60–90 s. Radio messages: 100 cumulative frames at 75 s.
- Why it matters
- Meaning: Six five-second reports per sender raised observed delivery and radio traffic. Boundary: Phase counts include network-wide control and reply frames.
Step 3 · Contiki-NG Cooja; numbered callout added to a real capture. Enlarge screenshot (new tab) Step 4
- Do
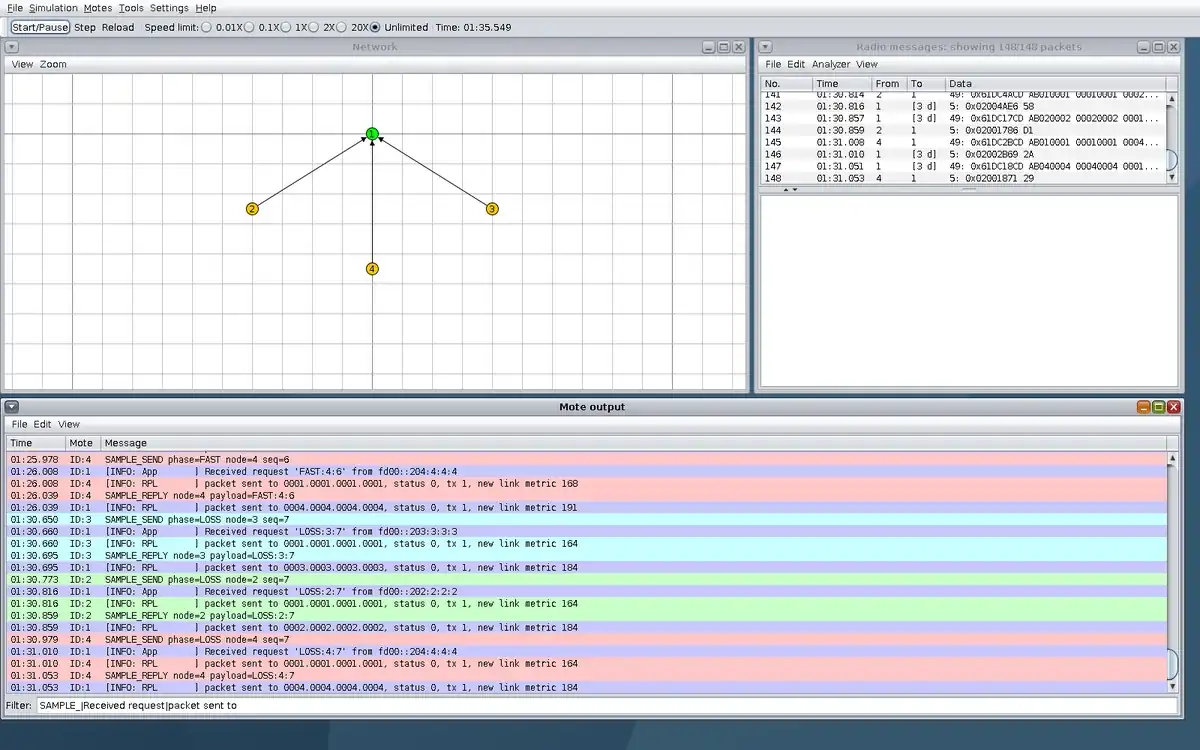
- Click Start/Pause and inspect Mote output for the one directed edge degraded to 0.5 reception ratio and the first LOSS samples.
- You will see
- Script: `EDGE source=4 dest=1 ratio=0.5 at_us=90549000` Serial: `90979000 ID:4 SAMPLE_SEND phase=LOSS node=4 seq=7` Later serial: mote 4 send status shows `tx 2` at 96.040600 s. Radio messages: 148 cumulative frames at 95 s.
- Why it matters
- Meaning: The controlled 4-to-1 loss edge caused MAC retransmissions. Boundary: The early 95 s view alone cannot establish the full phase count.
Step 4 · Contiki-NG Cooja; numbered callout added to a real capture. Enlarge screenshot (new tab) Step 5
- Do
- Click Start/Pause and compare Mote output after the edge returns to ratio 1.0 with equal 30-second phase totals.
- You will see
- Script: `EDGE source=4 dest=1 ratio=1 at_us=120549000` Run summary: `LOSS` delivered 18/18 with 93 radio transmissions; `RESTORE` delivered 18/18 with 74. Mote 4 had `tx 2` in LOSS and returned to `tx 1` for later RESTORE sends. Radio messages: 242 cumulative frames at 125 s.
- Why it matters
- Meaning: In this seed, degradation raised radio cost without losing application samples. Boundary: Radio transmissions are a proxy, not measured battery energy.
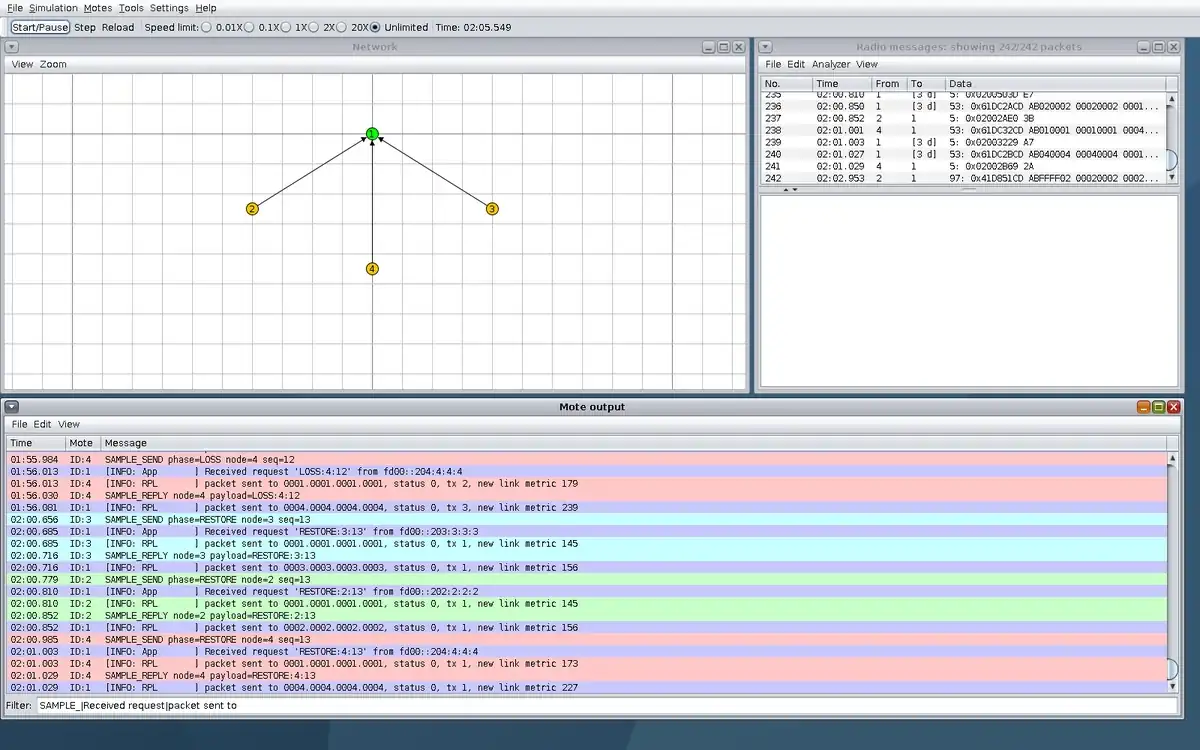
Step 5 · Contiki-NG Cooja; numbered callout added to a real capture. Enlarge screenshot (new tab) Step 6
- Do
- Click Start/Pause and reconcile Network, Radio messages, sink output, and the complete headless ledger.
- You will see
- Headless: `LEDGER sent={"BASE":3,"FAST":18,"LOSS":18,"RESTORE":18} delivered={"BASE":3,"FAST":18,"LOSS":18,"RESTORE":18} source4={"BASE":1,"FAST":6,"LOSS":6,"RESTORE":6} radio_tx={"BASE":16,"FAST":75,"LOSS":93,"RESTORE":74}` Headless: `TEST OK` Radio messages: 303 cumulative frames at 150 s.
- Why it matters
- Meaning: Delivered per radio transmission was 0.240, 0.194, and 0.243 for FAST, LOSS, and RESTORE. Boundary: These simulated counts cannot predict field battery life.
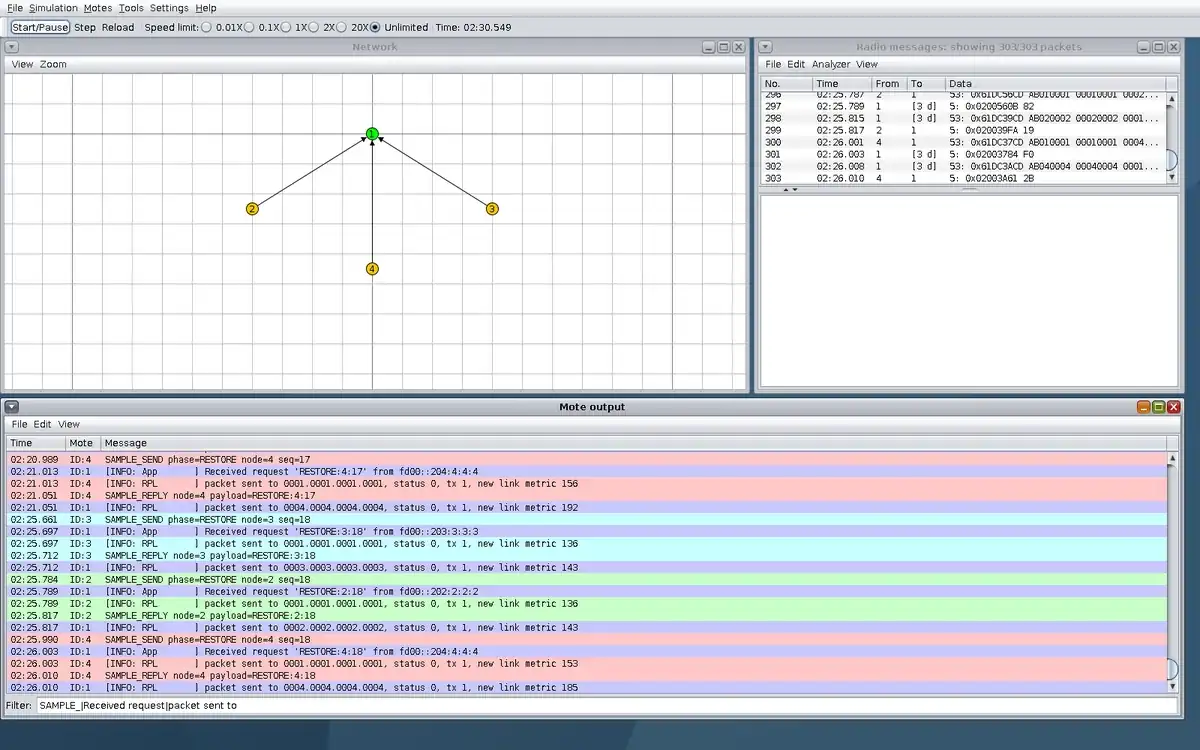
Step 6 · Contiki-NG Cooja; numbered callout added to a real capture. Enlarge screenshot (new tab)
Chapter checks
These questions refer to the chapter’s examples. Use the return links to review their answers.
Why is event-driven delivery energy-efficient but still risky if the sleep policy is too aggressive?
Return to the chapter’s knowledge checkWhy does the data-delivery model strongly influence which routing style a WSN application should use?
Return to the chapter’s knowledge check