Freshness Hidden by Browser Cache
Keep a returned sample time distinct from current server time and measure when a cached telemetry value becomes stale.

The Data Storage guide asks learners to retain the earlier event time separately from later arrival and review evidence. On iotclass.org a service worker in this lab folder plays the server; nothing leaves your browser.
Predict the reading, then compare it with the measurement.
Browser (Chromium DevTools)
Phone browserKeep a returned sample time distinct from current server time and measure when a cached telemetry value becomes stale.
Open the browser lab, then inspect the real Network, Console, or Accessibility panel in DevTools.
Open the phone lab (new tab)Steps
Step 1
- Do
- In the Network panel with Disable cache off, press Fetch cacheable reading. The request is handled by this lab’s service worker.
- You will see
- Input: First cacheable GET and uncached time check. Observed page: Sample 2026-10-09T19:11:33.448Z; current time 2026-10-09T19:11:33.453Z; age 0 s; HTTP 200. Sample age 0 s; HTTP status 200. Observed DevTools: Telemetry HTTP 200 comes from the service worker. Interpretation: The first timestamp is fresh.
- Why it matters
- Evidence: Step 1 screenshot shows the real Chromium page and DevTools panel. Mechanism: The endpoint returns Cache-Control private, max-age=30 and X-Server-Time. Boundary: The time check is an additional no-store request. Next check: Repeat the same URL before expiry.
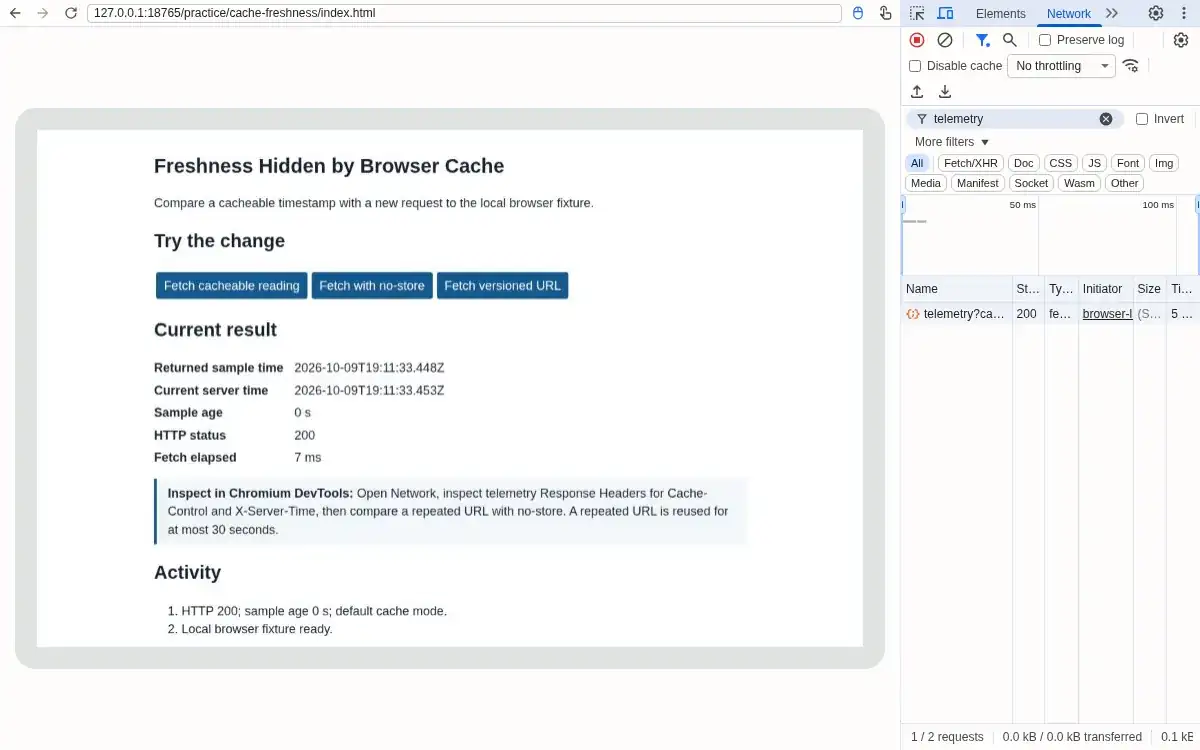
Step 1 · Browser (Chromium DevTools); numbered callout added to a real capture. Enlarge screenshot (new tab) Step 2
- Do
- In the controls panel, press Fetch cacheable reading again within 30 seconds. Inspect the unchanged sample time and the telemetry row in Network; its Size may say (ServiceWorker), not (disk cache).
- You will see
- Input: Repeated identical URL within 30 seconds. Observed page: Sample 2026-10-09T19:11:33.448Z; current time 2026-10-09T19:11:34.992Z; age 2 s; HTTP 200. Returned sample time is unchanged while current time advances and sample age grows. Observed DevTools: The telemetry row is served by the service worker; its Size may say (ServiceWorker), even though the worker reused its cached response. Interpretation: HTTP 200 does not imply a fresh sample.
- Why it matters
- Evidence: Step 2 screenshot shows the real Chromium page and DevTools panel. Mechanism: The service worker reuses its cacheable response before max-age expires. Boundary: Repeat the same URL within 30 seconds for this observation. Next check: Compare sample and server times.
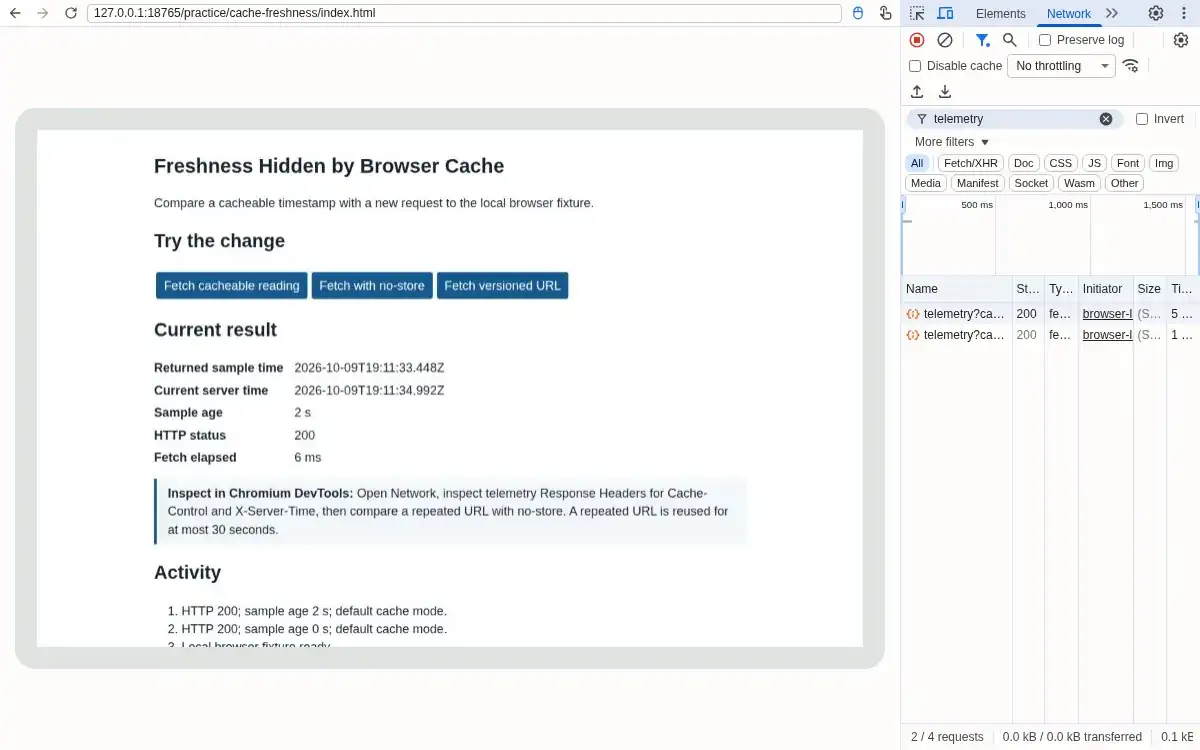
Step 2 · Browser (Chromium DevTools); numbered callout added to a real capture. Enlarge screenshot (new tab) Step 3
- Do
- In the Current result panel, compare returned sample time with current time.
- You will see
- Input: Compared sample and current timestamps. Observed page: Sample 2026-10-09T19:11:33.448Z; current time 2026-10-09T19:11:34.992Z; age 2 s; HTTP 200. The sample is older than the separate current time. Observed DevTools: The worker still returns the original sample. Interpretation: The reading has aged.
- Why it matters
- Evidence: Step 3 screenshot shows the real Chromium page and DevTools panel. Mechanism: The separate no-store time endpoint avoids using the client clock for age. Boundary: Two seconds is this run only, not a freshness target. Next check: Force a fresh telemetry request.
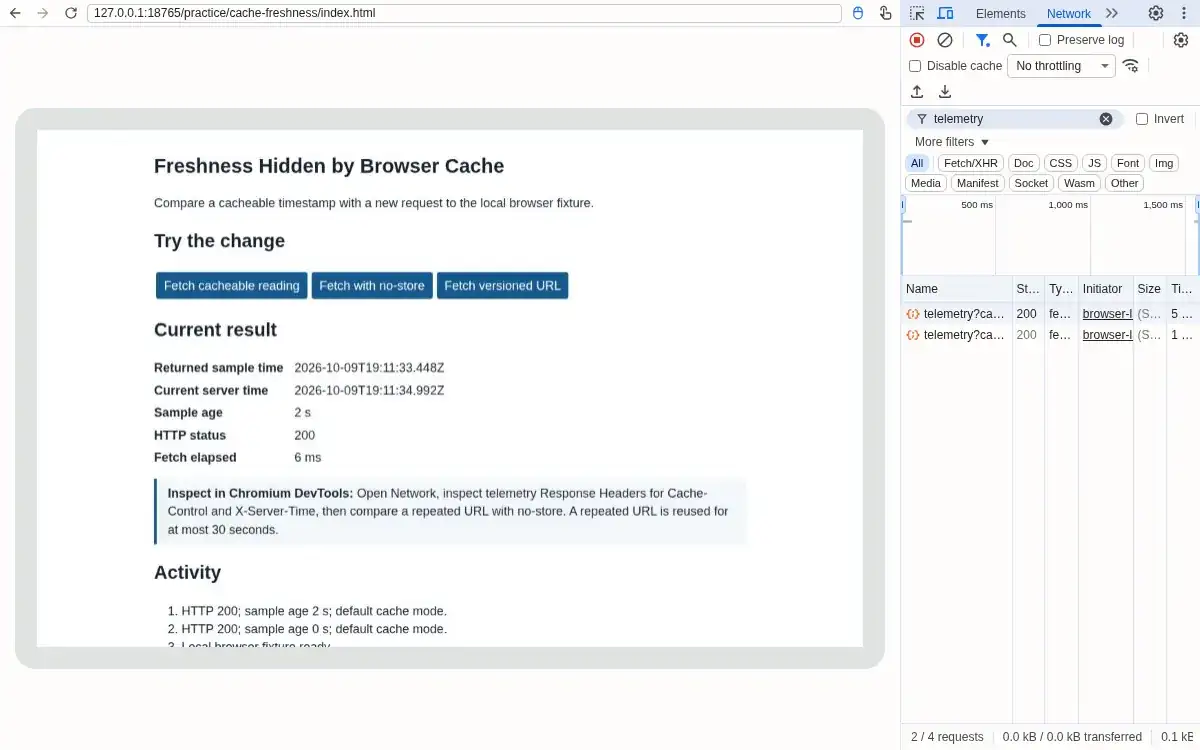
Step 3 · Browser (Chromium DevTools); numbered callout added to a real capture. Enlarge screenshot (new tab) Step 4
- Do
- In the controls panel, press Fetch with no-store and inspect the new telemetry row in Network.
- You will see
- Input: Fetch cache mode no-store. Observed page: Sample 2026-10-09T19:11:35.624Z; current time 2026-10-09T19:11:35.626Z; age 0 s; HTTP 200. Sample time changes and age returns to 0 s. Observed DevTools: A new service-worker HTTP 200 row appears. Interpretation: no-store bypasses the worker cache.
- Why it matters
- Evidence: Step 4 screenshot shows the real Chromium page and DevTools panel. Mechanism: The request cache mode prevents reuse of the prior response. Boundary: It does not prove all intermediaries honor cache directives. Next check: Try a versioned URL for a second isolation check.
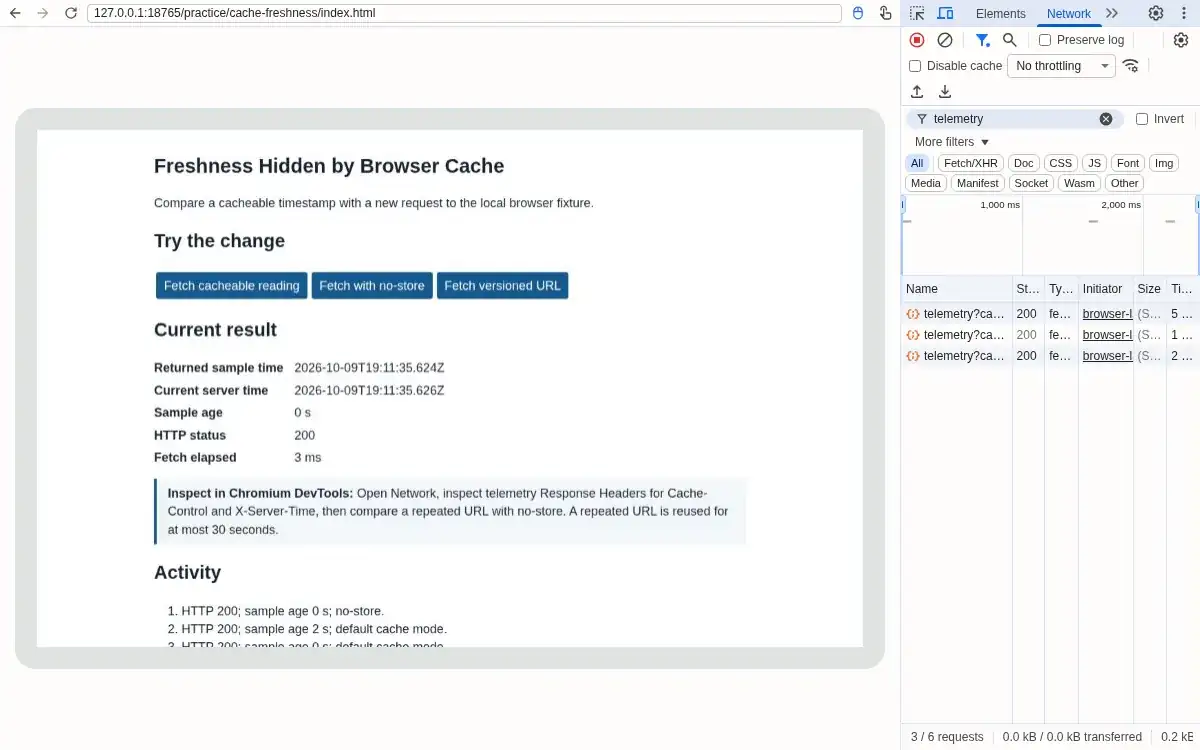
Step 4 · Browser (Chromium DevTools); numbered callout added to a real capture. Enlarge screenshot (new tab) Step 5
- Do
- In the controls panel, press Fetch versioned URL. Its new URL forces a fresh sample even while the original is within its 30-second lifetime.
- You will see
- Input: Versioned telemetry URL. Observed page: Sample 2026-10-09T19:11:35.947Z; current time 2026-10-09T19:11:35.953Z; age 0 s; HTTP 200. Sample time changes and age returns to 0 s. Observed DevTools: A new service-worker HTTP 200 row has a different v query parameter. Interpretation: A distinct URL has its own cache entry.
- Why it matters
- Evidence: Step 5 screenshot shows the real Chromium page and DevTools panel. Mechanism: A versioned URL has a separate worker cache entry. Boundary: DevTools Disable cache does not bypass the Cache API. Next check: Inspect the response headers.
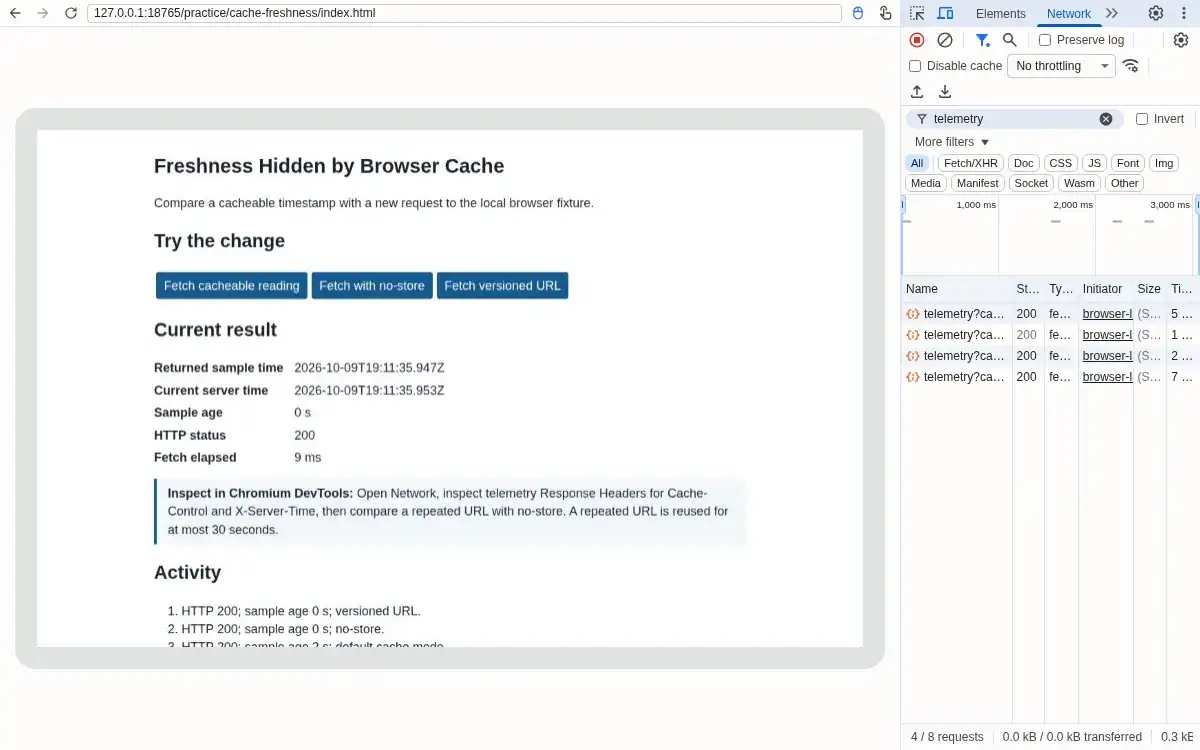
Step 5 · Browser (Chromium DevTools); numbered callout added to a real capture. Enlarge screenshot (new tab) Step 6
- Do
- In the Network panel, select the newest telemetry row in Network and inspect Response headers.
- You will see
- Input: Opened the service-worker response Headers tab. Observed page: Sample 2026-10-09T19:11:35.947Z; current time 2026-10-09T19:11:35.953Z; age 0 s; HTTP 200. The latest sample remains fresh. Observed DevTools: Cache-Control is private, max-age=30; X-Server-Time matches the returned sample time. Interpretation: The policy and timestamp are visible even though Size says (ServiceWorker).
- Why it matters
- Evidence: Step 6 screenshot shows the real Chromium page and DevTools panel. Mechanism: The header is supplied by the scoped service worker. Boundary: One controlled browser run is not a production cache audit. Next check: Record the freshness policy with the dashboard design.
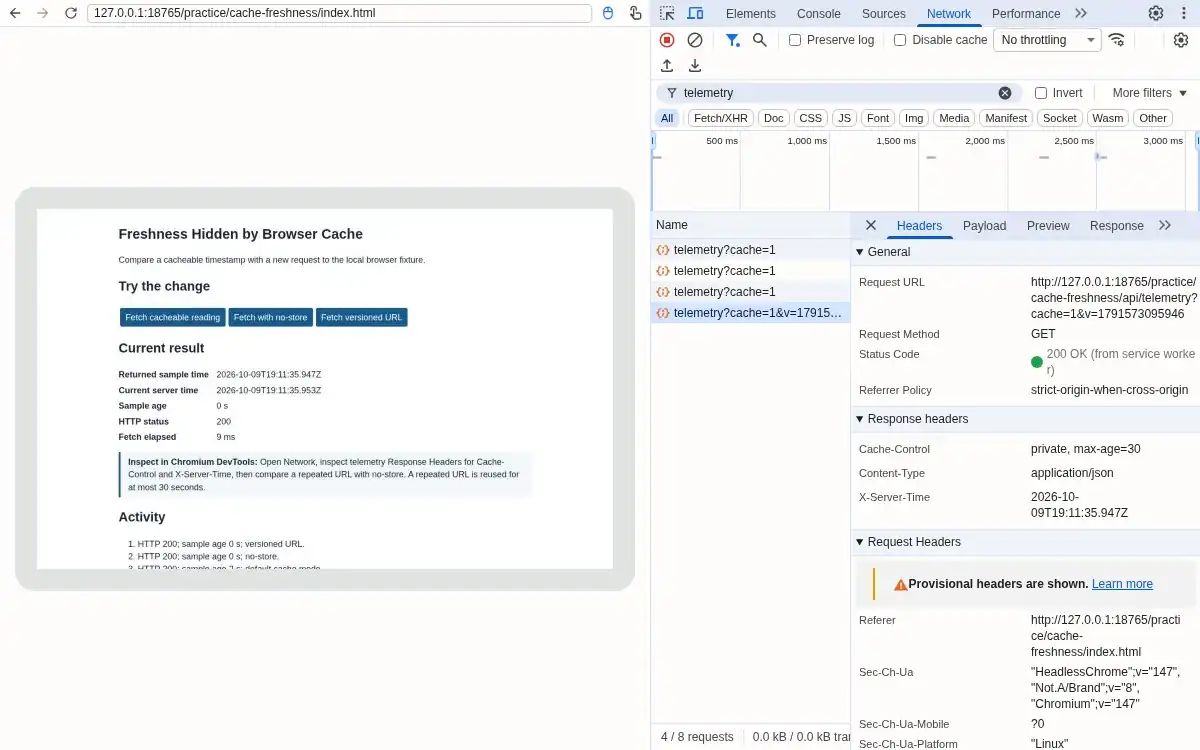
Step 6 · Browser (Chromium DevTools); numbered callout added to a real capture. Enlarge screenshot (new tab)
Chapter checks
These questions refer to the chapter’s examples. Use the return links to review their answers.
A latest-value cache makes a dashboard fast, but the durable telemetry store sometimes lags and the cache does not show freshness. What is the strongest review finding?
Return to the chapter’s knowledge checkA dashboard shows a normal sensor value, but the data record does not include freshness or quality state. What is the main visualization risk?
Return to the chapter’s knowledge check