Prototyping · Study deck
Application Frameworks and Dashboards
A cold-room team builds a bright control screen in one afternoon.
Voltage Vera is your guide for this deck.
After studying this chapter
Learning objectives
You will be able to:
- Define the application evidence an IoT prototype should capture before a pilot.
- Review dashboard, alert, workflow, automation, and user-action evidence without depending on named tools.
- Separate prototype framework convenience from durable application, edge, cloud, and operations responsibilities.
- Identify when low-code flows are enough for review and when the work must move to a team-owned application path.
Major section
In 60 Seconds · Start With the Story
- During the night shift, however, the room warms while the display still shows an old value.
- The shift lead needs to know what is happening now, who owns the response, and whether the warning has reached the right person.
- A polished happy path cannot answer those questions.
Major section
Frameworks Prove Human Work
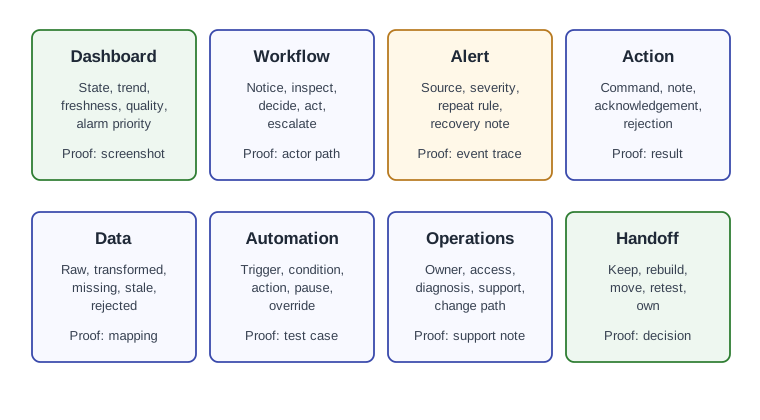
A chart that updates is not enough if stale data, repeated alerts, access roles, rejected commands, and recovery state are hidden.
- The review should start from the actor, not the tool catalog.
- In a cold-room prototype, a shift operator needs a different screen than a maintenance engineer or an analytics reviewer.
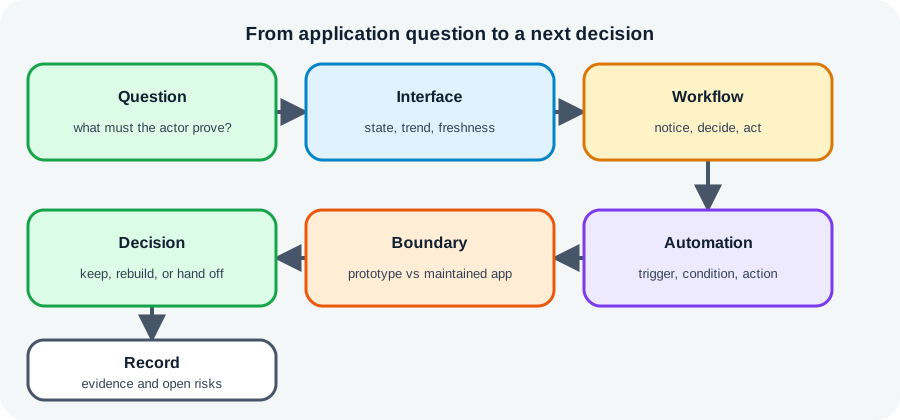
- In the A framework prototype is useful when the application question, interface sketch, workflow evidence, automation trial, boundary review, and next decision stay connected diagram, An IoT application framework should prove whether a person can notice a condition, understand its freshness and quality, decide what to do, act safely, and leave a record.
- The operator needs current room state, trend, freshness, alarm priority, acknowledgement state, and a safe next action.
Major section
Frameworks Prove Human Work (continued)
The maintenance engineer needs connector health, sensor identity, gateway status, rejected readings, and recent changes.
- The analytics reviewer needs raw value lineage, transformation rules, missing-data handling, and the query window behind the visible number.
- For launch decisions, write down what the framework proves and what it does not.
- It may prove the operator loop, field labels, alert wording, or recovery path.
- That separation keeps a quick application prototype from becoming unowned production logic by accident.
Major section
Pick Tool by Evidence Role
Node-RED is useful for flow logic, protocol bridging, and quick operator loops.
- Home Assistant is useful for local control and automation state.
- ThingsBoard, Grafana, InfluxDB, Telegraf, and Grafana Alerting are useful for telemetry dashboards, time-series review, and alert paths.
- Streamlit, Dash, Retool, Supabase, or a small React application can prove workflow and API contracts.
Major section
Pick Tool by Evidence Role (continued)
A Home Assistant automation should name entity ids, trigger, condition, action, override, and manual control state.
- AWS IoT SiteWise, AWS IoT Events, Azure IoT Central, Azure Data Explorer dashboards, and Power BI can expose managed cloud and operations paths.
- For a cold-room dashboard, use normal temperature, stale reading, alarm threshold, repeated alert, acknowledgement, rejected command, and recovered state.
- A ThingsBoard rule chain should preserve device profile, telemetry key, alarm condition, notification path, and owner.
Major section
Pick Tool by Evidence Role (continued)
If the reviewer has to inspect MQTT logs to understand the screen, the framework has not yet proved the human-facing workflow.
- A Node-RED flow should have a versioned flow export, named credentials boundary, test event, and rejected-event path.
- A Grafana dashboard should record data source, query, time range, transform, alert rule, contact point, and stale threshold.
- A low-code app should show where the API contract, user role, and action log will live after the prototype.
- The trial should include stale data, duplicate events, denied actions, missing values, malformed payloads, connector outage, repeated alarms, and recovery.
Major section
Low-Code Becomes a Contract
The hidden technical risk is that configuration becomes source code without the safeguards source code usually gets.
- The risk is not using low-code; the risk is leaving logic unversioned, untested, unaudited, or owned by nobody once it affects action.
- Traceability should survive a dispute.
- Migration is a design decision, not cleanup.
Major section
Low-Code Becomes a Contract (continued)
The framework evidence is strong when the team can rerun normal, stale, duplicate, rejected, denied, and recovered cases and still explain what the actor saw and did.
- A flow node, Grafana transform, dashboard variable, Airtable formula, Retool query, Supabase policy, Power BI measure, or AWS IoT Events detector can decide what a user sees or what action fires.
- If the trace breaks at a manual spreadsheet export, private dashboard edit, or unlabeled connector, the prototype may still be useful for discussion, but it is not yet evidence for a pilot decision.
- That trigger prevents temporary convenience from silently becoming the application architecture.
Major section
Evidence Roles in the Application Path · Frameworks Need Records
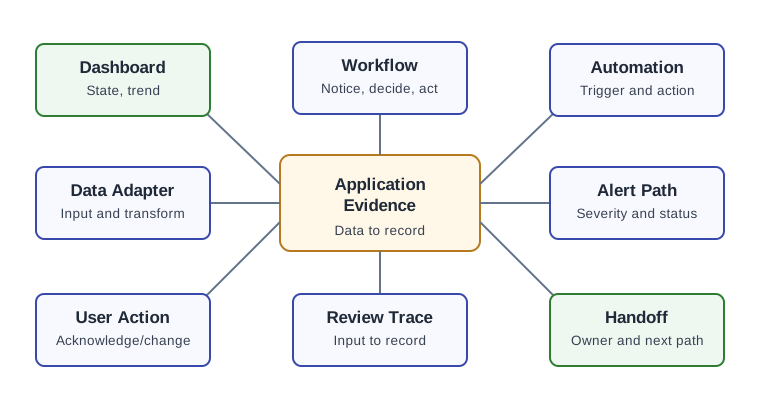
A dashboard shows state and trend, while a workflow records what a person notices, decides, and does.
- Alerts carry severity and status, and user actions need acknowledgement or change records.
- The review trace connects the incoming value to the displayed state and the later decision.
- Others are scaffolding for learning.
Major section
Data, Action, and Handoff Boundaries
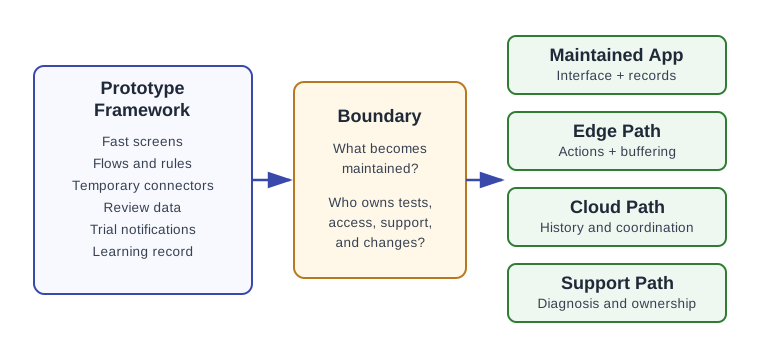
That speed is useful only while the boundary remains visible.
- A review should show which responsibilities belong to the framework and which responsibilities move elsewhere.
- A Node-RED flow export, named credential boundary, test event, and rejected-event path make that experiment reviewable.
- Interface, data, action, automation, access, and support checks decide what moves forward.
Major section
Flows Become App Contracts · Cold-Room Operator Workflow
If an automation changes a device, routes an alert, updates a record, or tells a user what to do, treat it as a contract.
- A team has already reviewed device readings, edge buffering, and upstream ingestion for a cold-room prototype.
- The next uncertainty is whether the operator workflow helps staff notice a temperature issue, acknowledge it, inspect stale data, and record the follow-up without asking engineers to interpret raw logs.
- The dashboard is not accepted as the final user application because access roles, long-term action records, and support diagnostics need a maintained application path.
Major section
Review Record
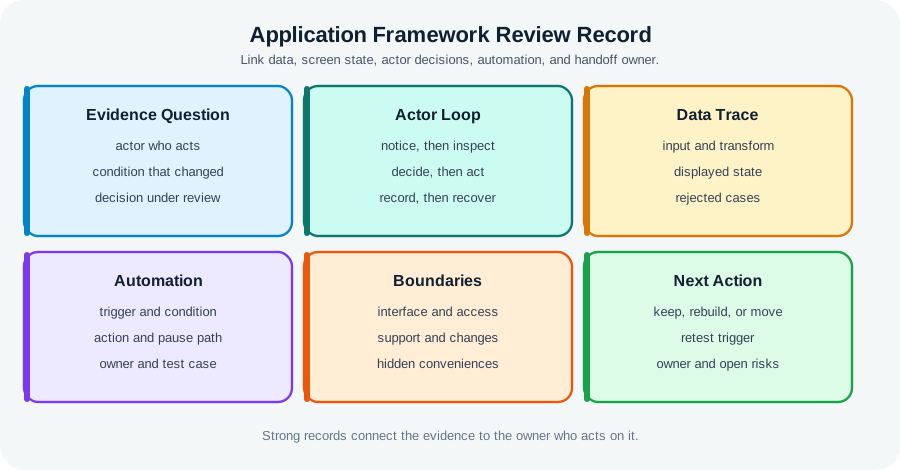
An application framework review record should make the user-facing decision repeatable.
- It should capture what the framework proved, what it only mocked, and what must be rebuilt or checked again before a pilot.
- The record asks which actor needs the view, what data or action they must trust, and which tool supplied the prototype evidence.
- the Review record template for application framework evaluation diagram tests a cold-room app choice against operator evidence.
- Node-RED can bridge a protocol and build a quick operator loop; Grafana can display a time series; a React, Streamlit, or Dash screen can explore workflow needs.
Major section
Review Record (continued)
A notice, acknowledgment, or command still needs access rules, an action log, and a support owner before handoff.
- The chosen framework is useful when it exposes the workflow question and leaves a path to a maintained contract.
- Weak: The dashboard has temperature charts and alert cards.
- Weak: The framework can create flows and notifications.
Deck summary
Key takeaways
The chart moves and the alarm button works.
- A chart that updates is not enough if stale data, repeated alerts, access roles, rejected commands, and recovery state are hidden.
- The maintenance engineer needs connector health, sensor identity, gateway status, rejected readings, and recent changes.
- Node-RED is useful for flow logic, protocol bridging, and quick operator loops.
- A Home Assistant automation should name entity ids, trigger, condition, action, override, and manual control state.
Retrieval practice
Recall check 1 of 4

Voltage Vera says: answer from memory, then check your reasoning.
Q1Per this chapter's cold-room prototype example, what does the maintenance engineer's screen need to show, as distinct from the shift operator's or analytics reviewer's screen?
Show answer
Answer: C see answers page
Retrieval practice
Recall check 2 of 4
Voltage Vera says: answer from memory, then check your reasoning.
Q2Per this chapter's per-trial evidence guidance, what should an 'action trial' specifically record?
Show answer
Answer: A see answers page
Retrieval practice
Recall check 3 of 4
Voltage Vera says: answer from memory, then check your reasoning.
Q3Per this chapter's 'Low-Code Becomes a Contract' section, what should trigger migrating a piece of the prototype away from a low-code framework into team-owned code?
Show answer
Answer: D see answers page
Retrieval practice
Recall check 4 of 4
Voltage Vera says: answer from memory, then check your reasoning.
Q4A prototype dashboard shows cold-room temperature readings. The next risk is whether an operator can notice stale data, acknowledge an alarm, and leave a reviewable action record. What should the first application framework evidence loop test?
Show answer
Answer: C Application framework evidence should prove the user-facing loop: notice, inspect, decide, act, record, and recover, with clear boundaries for what stays in the framework and what moves to a maintained application path.
Print reference
Answers 1 of 3
Answer key.
- C · The chapter names three distinct actor screens for the same cold-room prototype: the shift operator needs room state, trend, freshness, and alarm priority; the maintenance engineer needs connector health, sensor identity, gateway status, and rejected readings; the analytics reviewer needs raw value lineage, transformation rules, and query windows.
Print reference
Answers 2 of 3
Answer key.
- A · The chapter defines a distinct evidence checklist per trial type: dashboard trials record source, query window, and freshness; automation trials record trigger, condition, and rate limit; action trials record acknowledgement id, actor identity, and rollback path; support trials record connector health and failed requests.
Print reference
Answers 3 of 3
Answer key.
- D · The chapter states migration is a design decision, not cleanup, and names specific triggers that should prompt moving a framework piece to team-owned code: more users, higher risk commands, regulated records, role-based access, offline needs, alert volume, audit retention, or fleet scale.
- C · Application framework evidence should prove the user-facing loop: notice, inspect, decide, act, record, and recover, with clear boundaries for what stays in the framework and what moves to a maintained application path.