Core Networking · Study deck
Network Performance Lab: Calculations and Experiments
A protocol header is the control information placed before a message's payload, the sensor data it carries.
Packet Pete is your guide for this deck.
After studying this chapter
Learning objectives
You will be able to:
- Explain: The first arrow leads to throughput, the bits actually delivered, and the label on the way tells you what was taken: loss and retries.
- Explain: The button is the only input; pressing it injects a burst of traffic, which is how you drive utilisation up on demand.
- Explain: Bandwidth is how much data a link can carry in a given time; latency is the wait for a message to arrive.
- Explain: Depending on the bottleneck, reduce queue load, improve scheduling, shorten the path, move processing nearer the sensor, or increase constrained-link capacity.
Major section
Start With the Decision
A protocol header is the control information placed before a message's payload, the sensor data it carries.
- On a small message, the header can take most of the bytes.
- Bandwidth is how much data a link can carry in a given time; latency is the wait for a message to arrive.
- A calculation and simulator run show where the time and bytes go.
Major section
Try It: Protocol Overhead Calculator
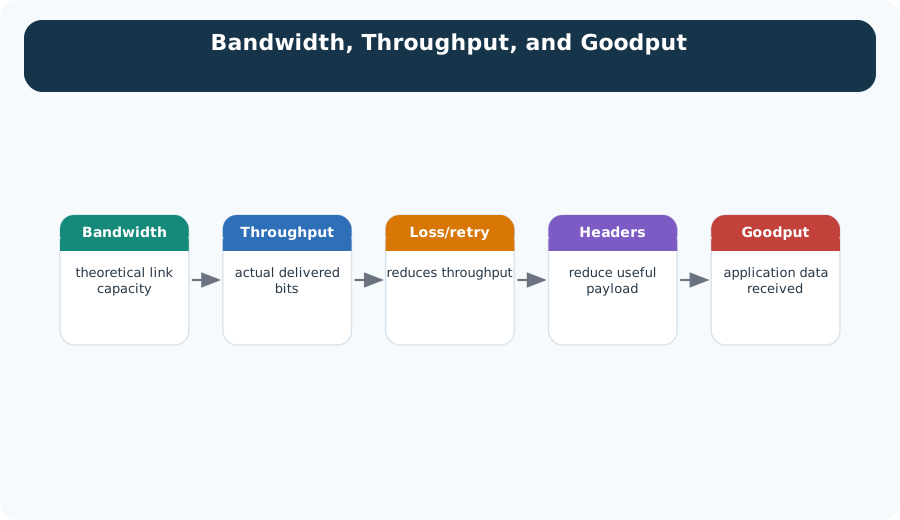
The first arrow leads to throughput, the bits actually delivered, and the label on the way tells you what was taken: loss and retries.
- The second arrow leads to goodput, the application data that finally arrives, and there the cost is headers.
Major section
Circuit Diagram
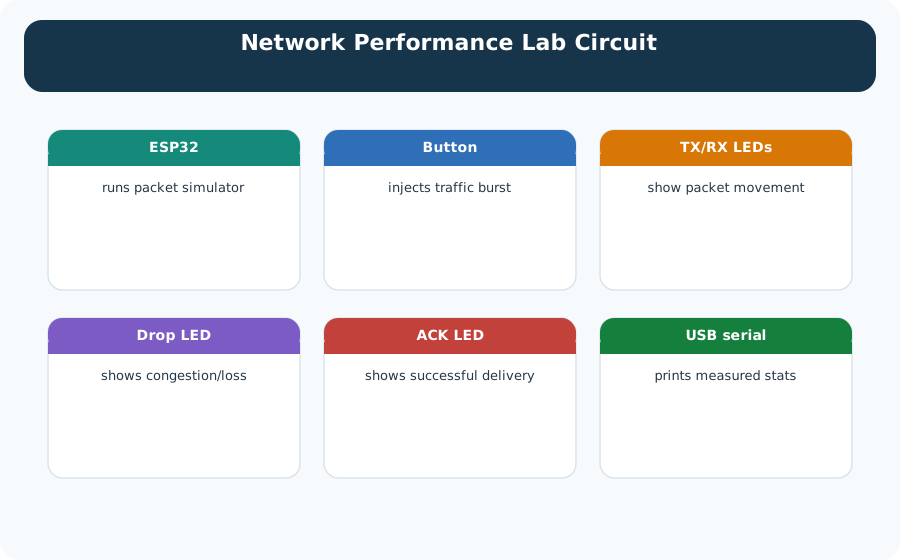
The button is the only input; pressing it injects a burst of traffic, which is how you drive utilisation up on demand.
- The three LED groups then report what the burst did.
- The serial link back to the computer carries the numbers.
Major section
Bandwidth Alone Does Not Cut Latency
The Mistake: "We upgraded from 100 Mbps to 1 Gbps, so our IoT sensor latency should decrease 10x.".
- The outcome depends on packet size, load, and the full path.
- Total latency: ≈1–100 ms from the listed components, so the 7.2 µs saved in serialization is negligible.
- Depending on the bottleneck, reduce queue load, improve scheduling, shorten the path, move processing nearer the sensor, or increase constrained-link capacity.
Deck summary
Key takeaways
A protocol header is the control information placed before a message's payload, the sensor data it carries.
- The first arrow leads to throughput, the bits actually delivered, and the label on the way tells you what was taken: loss and retries.
- The button is the only input; pressing it injects a burst of traffic, which is how you drive utilisation up on demand.
- The Mistake: "We upgraded from 100 Mbps to 1 Gbps, so our IoT sensor latency should decrease 10x.".
Retrieval practice
Recall check 1 of 3

Packet Pete says: answer from memory, then check your reasoning.
Q1A packet has 80 payload bytes and 20 header bytes. The link sends at 1 Mb/s. How long does serialization take, ignoring other delays?
Show answer
Answer: A Include header and payload, convert bytes to bits, then divide by the link rate.
Q2Place each performance measurement where it lives so you can separate offered load, the tested path, and the quality evidence it produces.
Show answer
Answer: A Control the load, name the path, and observe distinct metrics so you can compare network performance without mixing cause and measurement.
Retrieval practice
Recall check 2 of 3

Packet Pete says: answer from memory, then check your reasoning.
Q3A factory IoT network has a Wi-Fi link with 54 Mbps bandwidth. During peak hours, the actual data rate measured by sensors is only 12 Mbps. An engineer claims the network is broken. What is the correct explanation?
Show answer
Answer: B
Retrieval practice
Recall check 3 of 3

Packet Pete says: answer from memory, then check your reasoning.
Q4An industrial IoT system monitors a robotic arm using sensors that send position data every 10 ms. The network has average latency of 15 ms but jitter varies between 5 ms and 45 ms. Which metric is most critical for this application and why?
Show answer
Answer: D The 5–45 ms delay range spans 40 ms, so the 15 ms mean hides late updates.
Print reference
Answers
Answer key.
- A · Include header and payload, convert bytes to bits, then divide by the link rate.
- A · Control the load, name the path, and observe distinct metrics so you can compare network performance without mixing cause and measurement.
- B
- D · The 5–45 ms delay range spans 40 ms, so the 15 ms mean hides late updates.