Testing & Validation · Study deck

CI/CD Tooling and Monitoring

To connect a pipeline result with what the fleet actually did, trace @fig-cicd-iot-monitoring-and-tools-evidence-loop before deciding whether an alert belongs to the build, the rollout, or device operation.

Test Tessa is your guide for this deck.

continuous-integrationmonitoringtool-evidence
iotclass.org

After studying this chapter

Learning objectives

You will be able to:

  • see what actually happened in the pipeline and in the field, not just a green dashboard
  • choose monitoring pillars, tools, and useful alert thresholds
  • explain why IoT field telemetry is hard to trust at face value
  • Explain: The release gate establishes which candidate entered which cohort; device signals then show its real behavior, and alert review turns those observations into a bounded decision.
iotclass.org

Major section

Overview: Seeing What Happened, in the Pipeline and in the Field
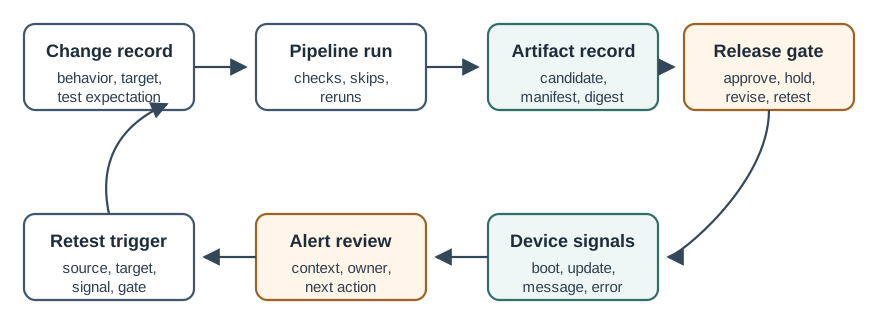
The release gate establishes which candidate entered which cohort; device signals then show its real behavior, and alert review turns those observations into a bounded decision.

  • Pipeline observability shows the build, test, artifact, and gate signals for a candidate.
  • This ordered chain is what prevents a green pipeline from being mistaken for healthy field operation.
The monitoring loop links a change and its pipeline artifact to the release gate, observed device signals, alert review, and the trigger for another test.
iotclass.org

Major section

Practitioner: The Pillars, the Tools, and Useful Alerts
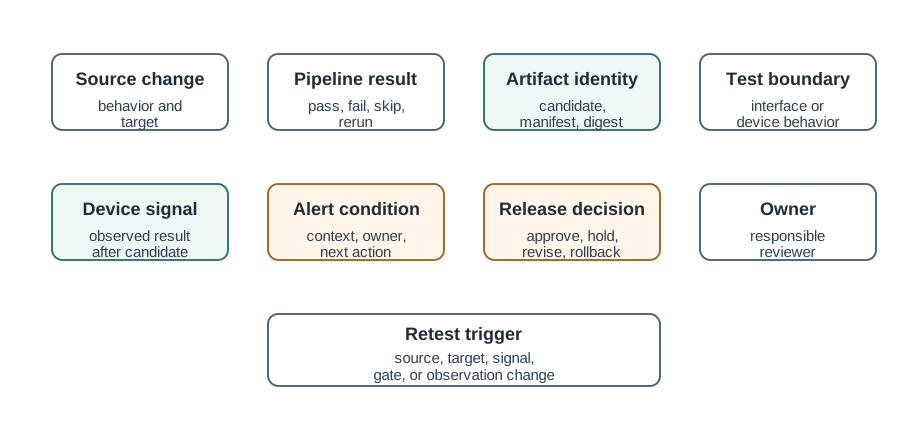
This record connects changing tool names to stable evidence responsibilities rather than dashboard preference.

  • Logs are discrete timestamped events that explain what happened at a moment.
  • Metrics tell you something is wrong, logs and traces help you find why.
A monitoring record ties the source change, pipeline result, artifact identity, test boundary, device signal, alert condition, decision, owner, and retest trigger to one candidate.
iotclass.org

Major section

Under the Hood: Why IoT Telemetry Is Hard to Trust

IoT monitoring is not just web monitoring on small computers.

  • Each one can make a confident dashboard wrong.
  • Telemetry has to be designed: aggregate on the device, sample, and buffer during disconnection to send later.
  • The discipline is to decide in advance which indicators define health and to collect those well, rather than collecting everything poorly.
iotclass.org

Major section

Join a Green Build to a Failing Fleet

In this field-monitoring tool, count 1,000 updated gateways and 1,000 controls over one hour.

  • The monitoring cohort is showing seven times the control rate.
  • CI/CD monitoring uses deployment time as a before-and-after boundary.
The monitoring loop links a change and its pipeline artifact to the release gate, observed device signals, alert review, and the trigger for another test.
iotclass.org

Deck summary

Key takeaways

The release gate establishes which candidate entered which cohort; device signals then show its real behavior, and alert review turns those observations into a bounded decision.

  • This record connects changing tool names to stable evidence responsibilities rather than dashboard preference.
  • IoT monitoring is not just web monitoring on small computers.
  • In this field-monitoring tool, count 1,000 updated gateways and 1,000 controls over one hour.
iotclass.org

Retrieval practice

Recall check 1 of 3

Test Tessa says: answer from memory, then check your reasoning.

Q1Why is a fully green CI/CD dashboard not enough to conclude that an IoT release is healthy?

AA green dashboard always guarantees device health, so nothing more is needed
BPipeline green must be paired with fleet-side evidence for the same candidate
CDashboards are decorative and carry no real evidence
DDevice behavior is irrelevant once the artifact is signed
Show answer

Answer: B Pipeline success is necessary but not sufficient; release health also depends on device-side observation attributed to the exact candidate.

iotclass.org

Retrieval practice

Recall check 2 of 3

Test Tessa says: answer from memory, then check your reasoning.

Q2A firmware candidate changes how a device reports a connection error. The pipeline is green and the message-format unit test passes, but no observation record shows the new error report appearing from a device or test boundary. What is the strongest gate action?

AApprove it because the dashboard is green
BIgnore the missing observation since monitoring only matters after release
CDelete the alert rule so the dashboard stops showing the gap
DHold until device-side observation shows the new error report is visible
Show answer

Answer: D The changed behavior is a device-side signal; the gate needs fleet evidence that it appears, not just build and unit-test success.

iotclass.org

Retrieval practice

Recall check 3 of 3

Test Tessa says: answer from memory, then check your reasoning.

Q3After a staged firmware rollout, the monitoring dashboard shows error rates holding steady and even dropping slightly, so a team prepares to expand the wave. What should make them cautious before reading this as success?

AA falling error rate can mean failed devices have gone silent and stopped reporting
BNothing; a steady or falling error rate always proves the rollout is healthy
CThey should expand immediately because fewer errors means the new build fixed everything
DError counts are the only signal that matters, so check-in counts are irrelevant
Show answer

Answer: A Absence of errors can be survivorship bias from devices that went dark; monitoring missing check-ins and version-attributed signals is what reveals silent failures.

iotclass.org

Print reference

Answers

Answer key.

  1. B · Pipeline success is necessary but not sufficient; release health also depends on device-side observation attributed to the exact candidate.
  2. D · The changed behavior is a device-side signal; the gate needs fleet evidence that it appears, not just build and unit-test success.
  3. A · Absence of errors can be survivorship bias from devices that went dark; monitoring missing check-ins and version-attributed signals is what reveals silent failures.
iotclass.org