Measure PWM duty and LED timing
Compare true DAC output with PWM duty-cycle output by measuring PWM HIGH time, period, and duty at a real simulated LED node.
Use the module's DAC and PWM output route to compare measured switching duty with the kind of output a physical load actually needs.
Predict the reading, then compare it with the measurement.
Wokwi ESP32
Third party ToolCompare true DAC output with PWM duty-cycle output by measuring PWM HIGH time, period, and duty at a real simulated LED node.
Open the ESP32 editor, paste diagram.json, then paste sketch.ino.
Open Wokwi to paste in the files (new tab)Get the files
Use both prepared files. This is a paste-in setup; saving a project requires a Wokwi account.
sketch.ino
- Use the launch button above to open the ESP32 editor in Wokwi.
- Select the editor’s diagram.json tab and replace all its text with the supplied diagram.json.
- Select the sketch.ino tab, replace all its text with the supplied sketch.ino, then click Start Simulation.
Steps
Step 1
- Do
- In the Wokwi editor, paste the supplied diagram and sketch and inspect the LED, loopback input, and logic analyzer before starting.
- You will see
- Input: loaded the supplied ESP32 diagram and sketch in the public editor. Observed: GPIO2 drives the green LED through a 220 Ω resistor. Observed: the same GPIO2 node connects to GPIO4 and analyzer channel D0. Observed: the stopped Simulation panel showed the LED off and the analyzer blank.
- Why it matters
- The GPIO4 loopback measures the digital PWM node, not a calculated ideal value. The analyzer independently records transitions at that same node. The resistor limits LED current in the simulator circuit. The stopped circuit provides a baseline before any duty command.
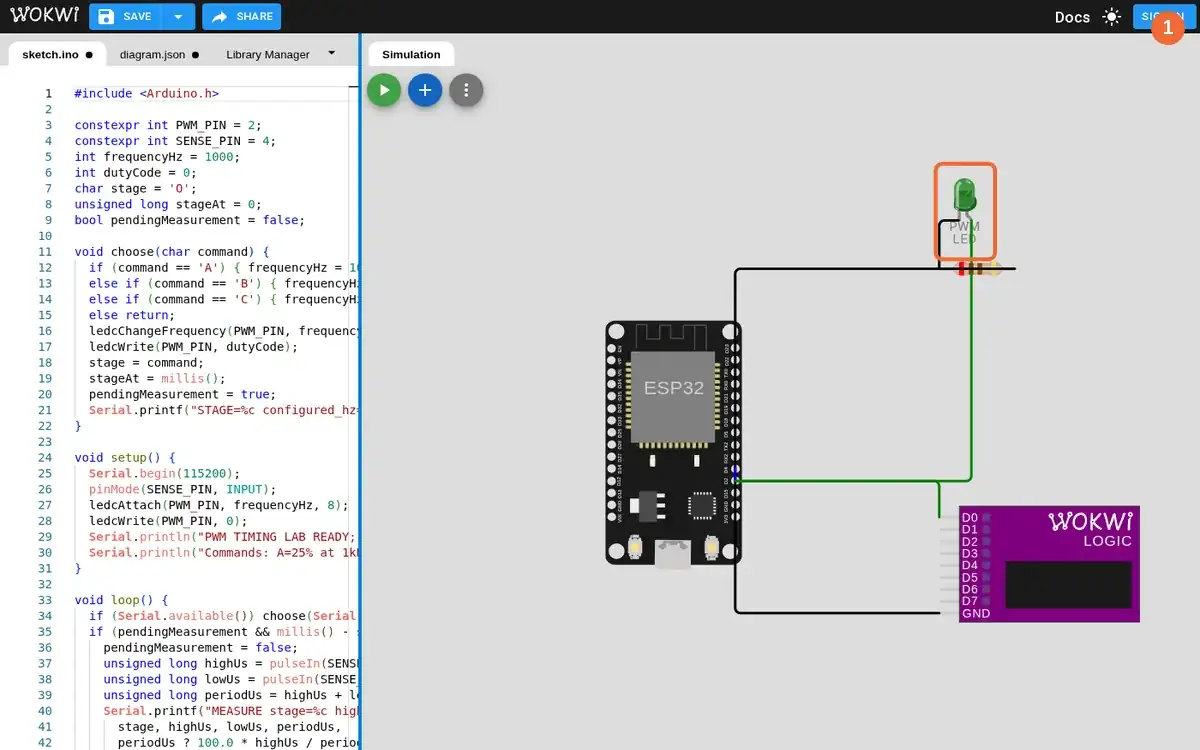
Step 1 · Wokwi ESP32; numbered callout added to a real capture. Enlarge screenshot (new tab) Step 2
- Do
- In Serial Monitor, start simulation, send A for 25% at 1 kHz, and read the GPIO4 loopback measurement.
- You will see
- Input: sent `A`; firmware configured 1,000 Hz with 8-bit duty code 64. Observed: `MEASURE stage=A high_us=254 low_us=748 period_us=1002 duty_pct=25.3`. Observed: the LED lit during PWM pulses and analyzer D0 accumulated samples. Observed VCD at 2 s: one HIGH interval was 250.00 µs in a 1,000.00 µs period.
- Why it matters
- The GPIO4 reading measures a short HIGH interval relative to LOW. The Wokwi analyzer independently records the same switching node. The VCD and loopback differ by a few microseconds due to read timing. Neither measurement is an analog LED voltage or light-output measurement.
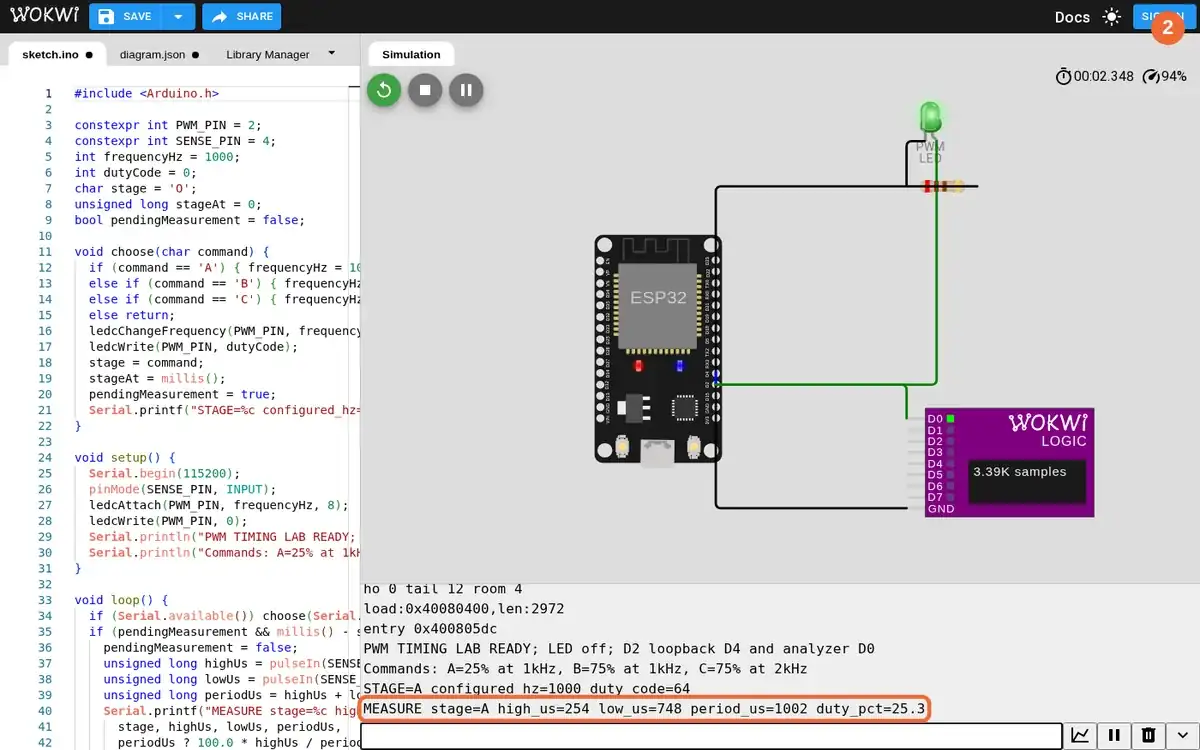
Step 2 · Wokwi ESP32; numbered callout added to a real capture. Enlarge screenshot (new tab) Step 3
- Do
- In Serial Monitor, send B for 75% duty at the same 1 kHz and compare the measured HIGH interval.
- You will see
- Input: sent `B`; firmware kept 1,000 Hz and changed 8-bit duty code to 191. Observed: `MEASURE stage=B high_us=749 low_us=260 period_us=1009 duty_pct=74.2`. Observed: analyzer D0 sample count rose while the LED continued switching. Observed VCD at 4 s: HIGH was 746.09 µs and period was 1,000.00 µs.
- Why it matters
- The measured HIGH interval grew from roughly 250 to 750 µs. The period remained near 1 ms in both stages. Changing duty at fixed frequency changes time on, rather than pulse count per second. Wokwi's LED appearance is illustrative; no luminance was measured.
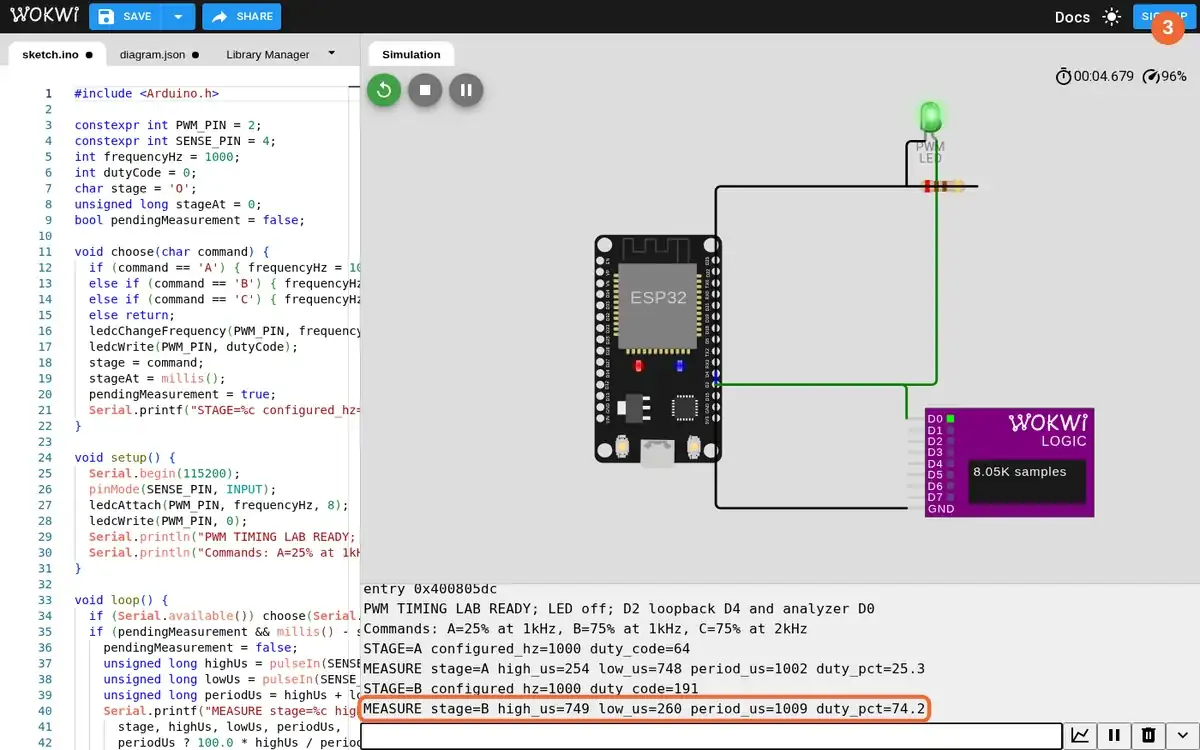
Step 3 · Wokwi ESP32; numbered callout added to a real capture. Enlarge screenshot (new tab) Step 4
- Do
- In Serial Monitor, send A again and compare the two same-frequency measurements in the visible log.
- You will see
- Input: restored `A` without changing the nominal 1,000 Hz frequency. Observed: the second A line was `high_us=254 low_us=748 period_us=1002 duty_pct=25.3`. Observed: the preceding B line was `high_us=749 low_us=260 period_us=1009 duty_pct=74.2`. Observed: both measured periods stayed near 1,000 µs while HIGH duration changed.
- Why it matters
- The A-B-A sequence repeats the low-duty result in this run. The measured period remained approximately constant. The loopback readings and VCD give separate timing evidence. This is a digital switching comparison, not a true DAC output test.
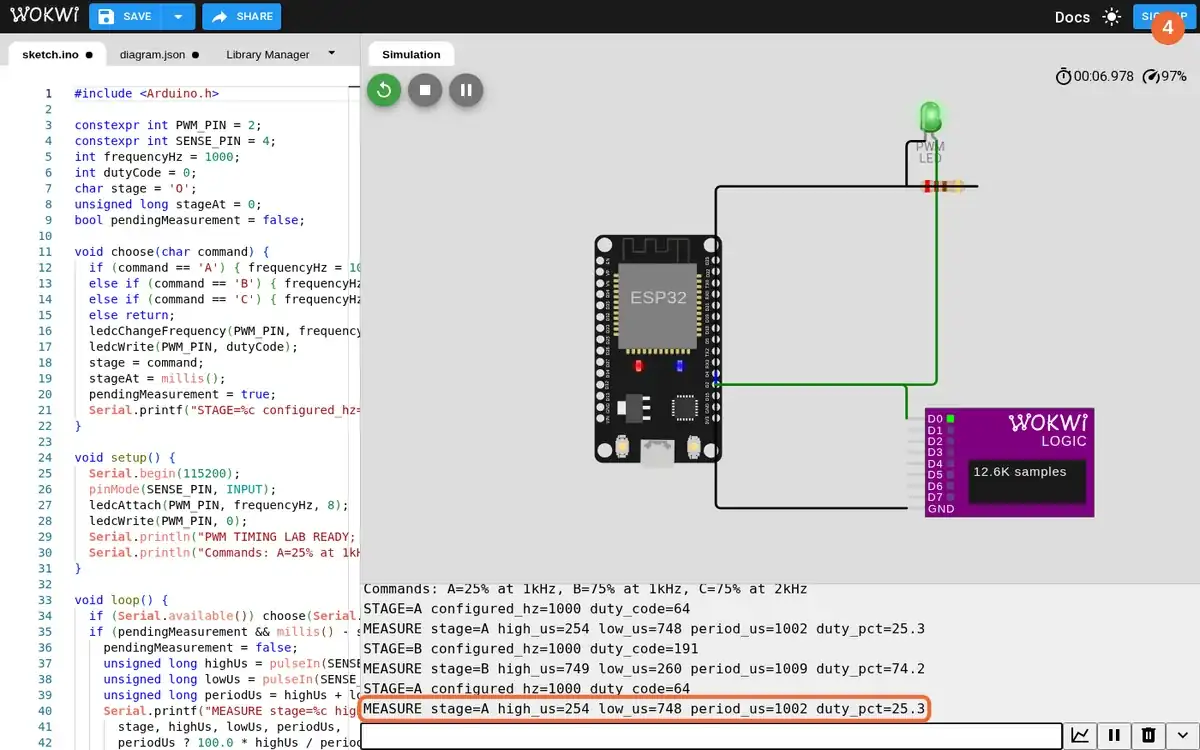
Step 4 · Wokwi ESP32; numbered callout added to a real capture. Enlarge screenshot (new tab) Step 5
- Do
- In Serial Monitor, send C to keep about 75% duty but double frequency to 2 kHz; inspect the new period.
- You will see
- Input: sent `C`; firmware configured 2,000 Hz and retained duty code 191. Observed: `MEASURE stage=C high_us=371 low_us=123 period_us=494 duty_pct=75.1`. Observed: the Wokwi logic analyzer continued accumulating D0 transitions. Observed VCD at 9 s: HIGH was 373.05 µs and period was 500.00 µs.
- Why it matters
- The period halved from about 1 ms to about 0.5 ms. The measured duty remained near three quarters. The high-time also halved as expected for fixed duty at double frequency. The result describes simulator digital timing, not physical LED efficiency.
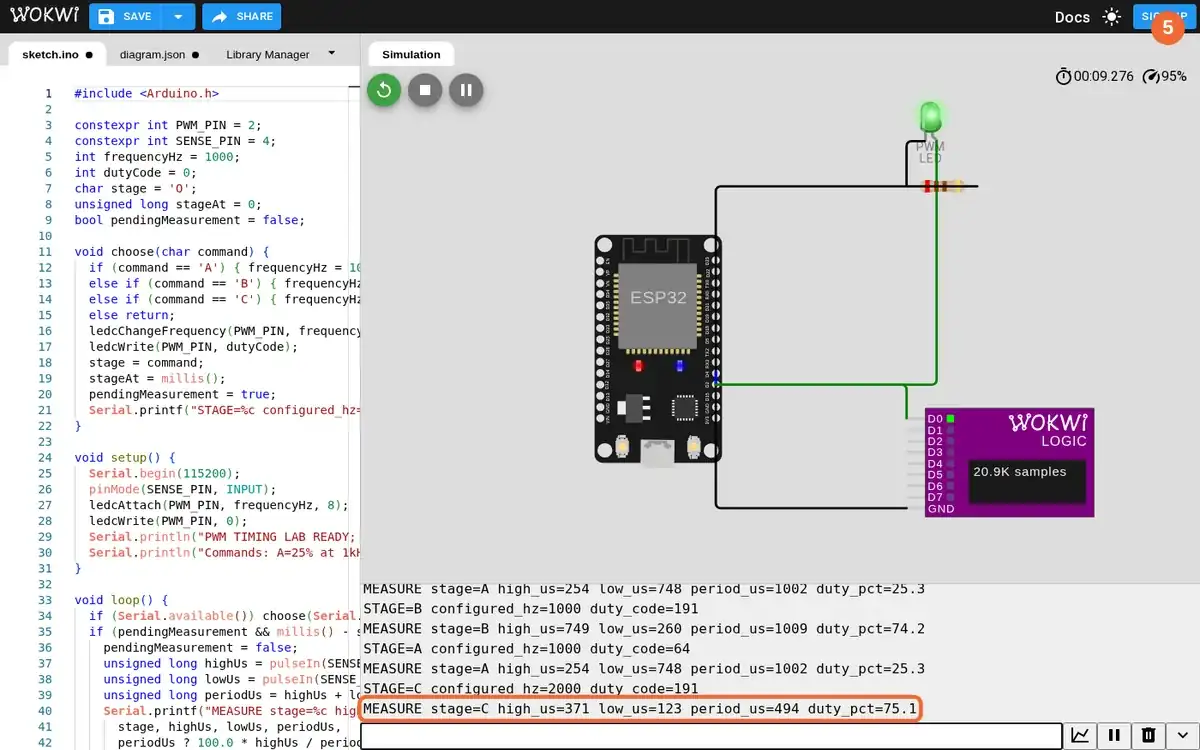
Step 5 · Wokwi ESP32; numbered callout added to a real capture. Enlarge screenshot (new tab) Step 6
- Do
- In the Wokwi Simulation panel, inspect the LED, analyzer sample count, and final Serial Monitor line, then stop to export the VCD.
- You will see
- Input: left stage C active, then stopped the real Wokwi simulation. Observed final line: `MEASURE stage=C high_us=371 low_us=123 period_us=494 duty_pct=75.1`. Observed: the analyzer display showed 29.4K samples in the running capture. Observed: Wokwi downloaded `pwm-duty-led.vcd`, opened in the real browser Surfer viewer for 25%, 75%, and 2 kHz waveform inspection.
- Why it matters
- The final screenshot ties the circuit, analyzer, and serial reading to one running editor. The exported VCD preserves the digital transitions for independent inspection. A waveform viewer shows shorter and longer HIGH intervals directly. This does not establish actual analog voltage ripple, LED luminance, or physical ESP32 timing tolerance.
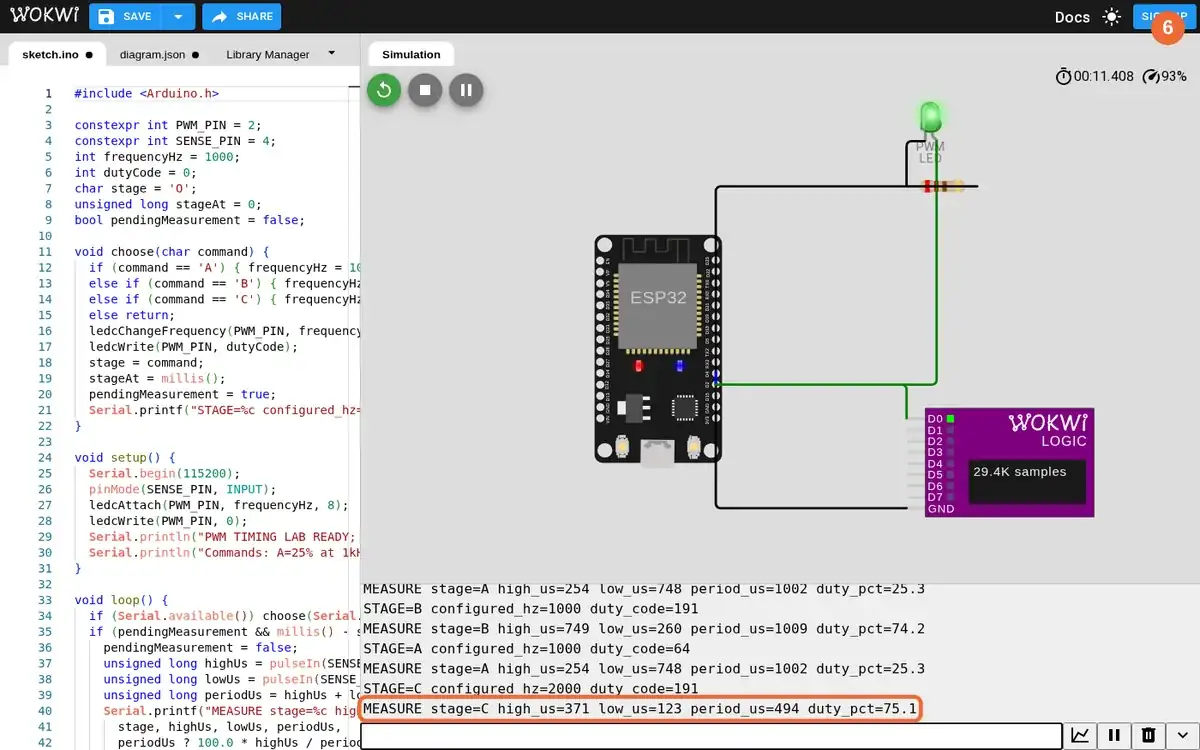
Step 6 · Wokwi ESP32; numbered callout added to a real capture. Enlarge screenshot (new tab)
Chapter checks
These questions refer to the chapter’s examples. Use the return links to review their answers.
A plant lamp receives a PWM command. What should the designer examine to predict its physical output?
Return to the chapter’s knowledge checkA design smooths PWM pulses into an analog-like control signal. What choice does the chapter ask the learner to evaluate?
Return to the chapter’s knowledge check