Control a fan locally with an MCU
Wire a temperature component to an MCU, run a local fan and LED rule, and identify what the simulated output does and does not prove.

Packet Pete
Predict the reading, then compare it with the measurement.
Cisco Packet Tracer
Desktop labWire a temperature component to an MCU, run a local fan and LED rule, and identify what the simulated output does and does not prove.
Install the tool; build from the steps. No file yet.
Download the Packet Tracer fileSteps
Step 1
- Do
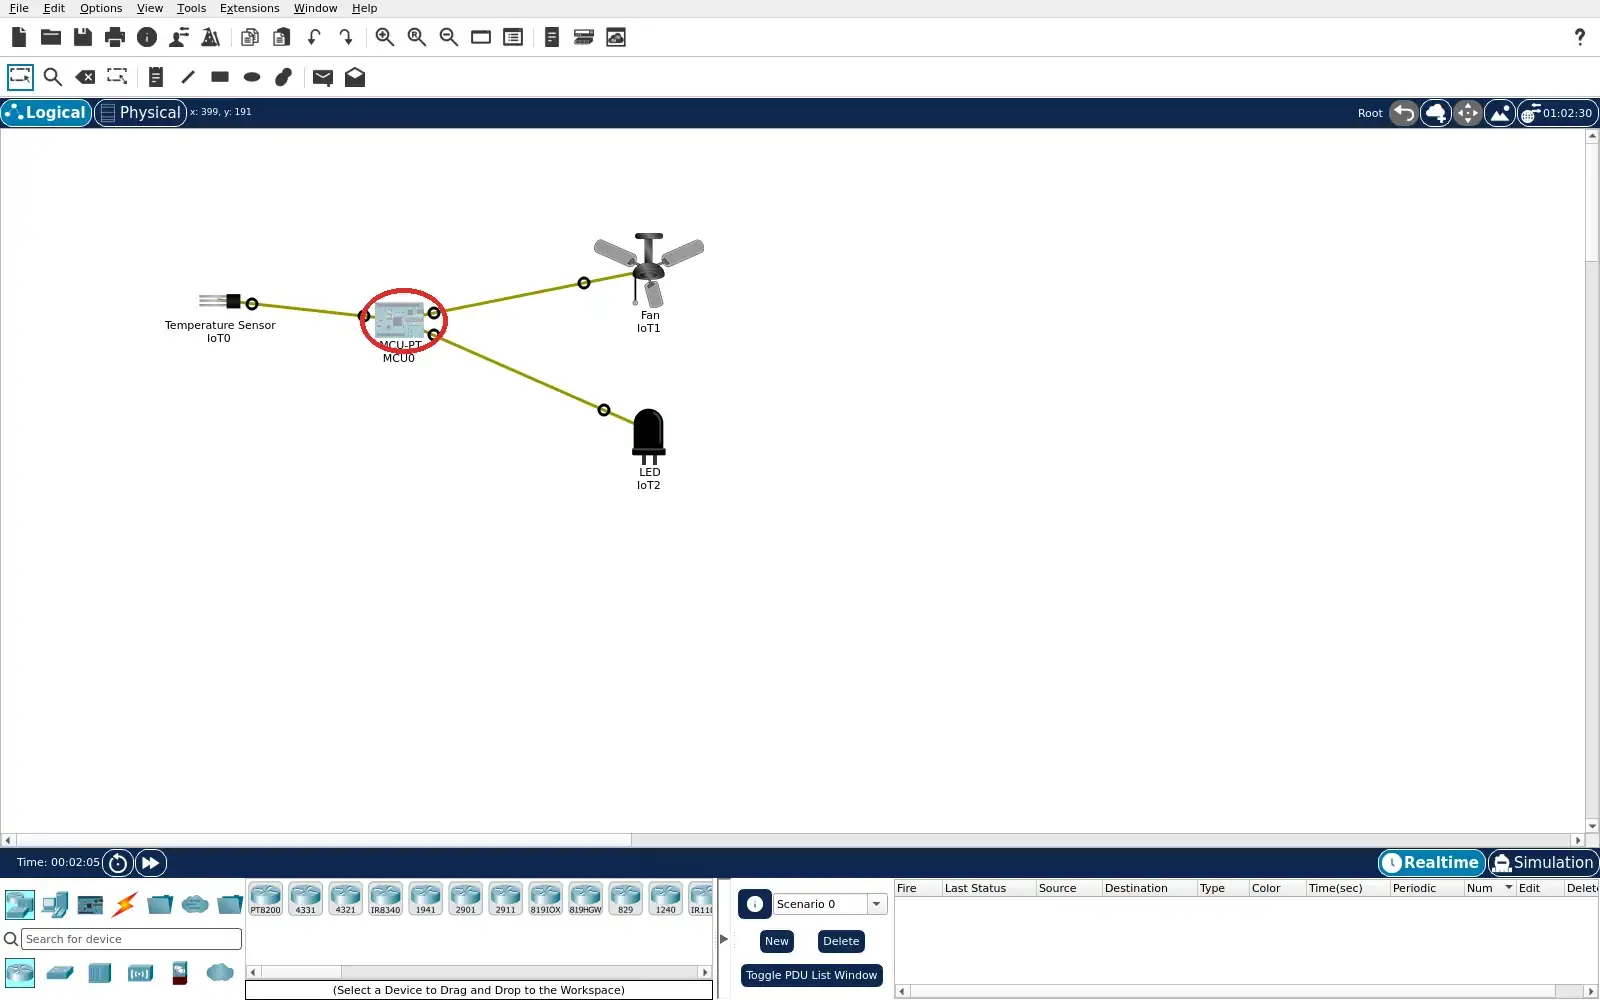
- Open lab.pkt in Packet Tracer Logical workspace. Locate the Temperature Sensor, MCU-PT, fan and LED. Follow each of the three component cables. Confirm the fan and LED are initially dark or still.
- You will see
- Temperature Sensor IoT0 is left of MCU0. Fan IoT1 and LED IoT2 are to its right. Three olive IoT component cables meet the MCU. The fan has no motion marks and the LED is dark.
- Why it matters
- The sensor is a local input to the controller. The fan and LED are separate local outputs. The cable paths make the control direction visible. A cool start state gives a comparison for warming.
Step 1 · Cisco Packet Tracer; numbered callout added to a real capture. Enlarge screenshot (new tab) Step 2
- Do
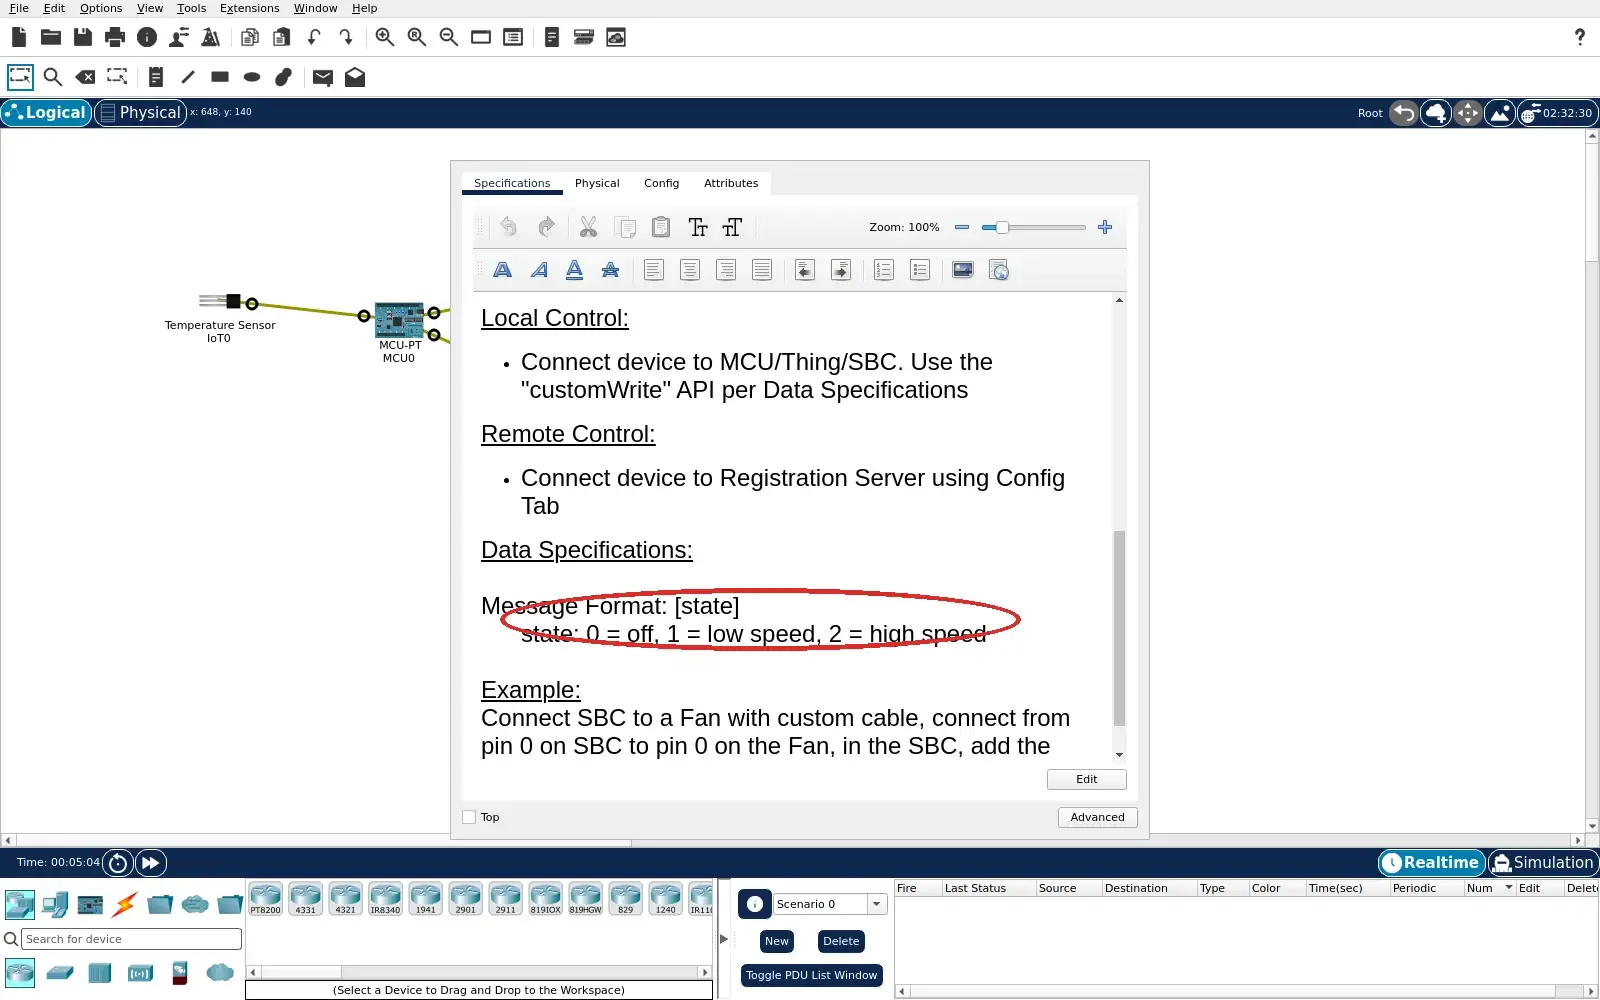
- Open fan IoT1 Specifications tab. Find Local Control and Data Specifications. Read its listed customWrite values. Return to the Logical topology.
- You will see
- The device is the Packet Tracer Fan component. Its specification lists customWrite control. Value 0 means Off and value 2 means High. The screen describes a simulated output control.
- Why it matters
- The program must use the fan’s supported API. High and Off have documented values. This is a model of an actuator command. It does not establish electrical driver ratings.
Step 2 · Cisco Packet Tracer; numbered callout added to a real capture. Enlarge screenshot (new tab) Step 3
- Do
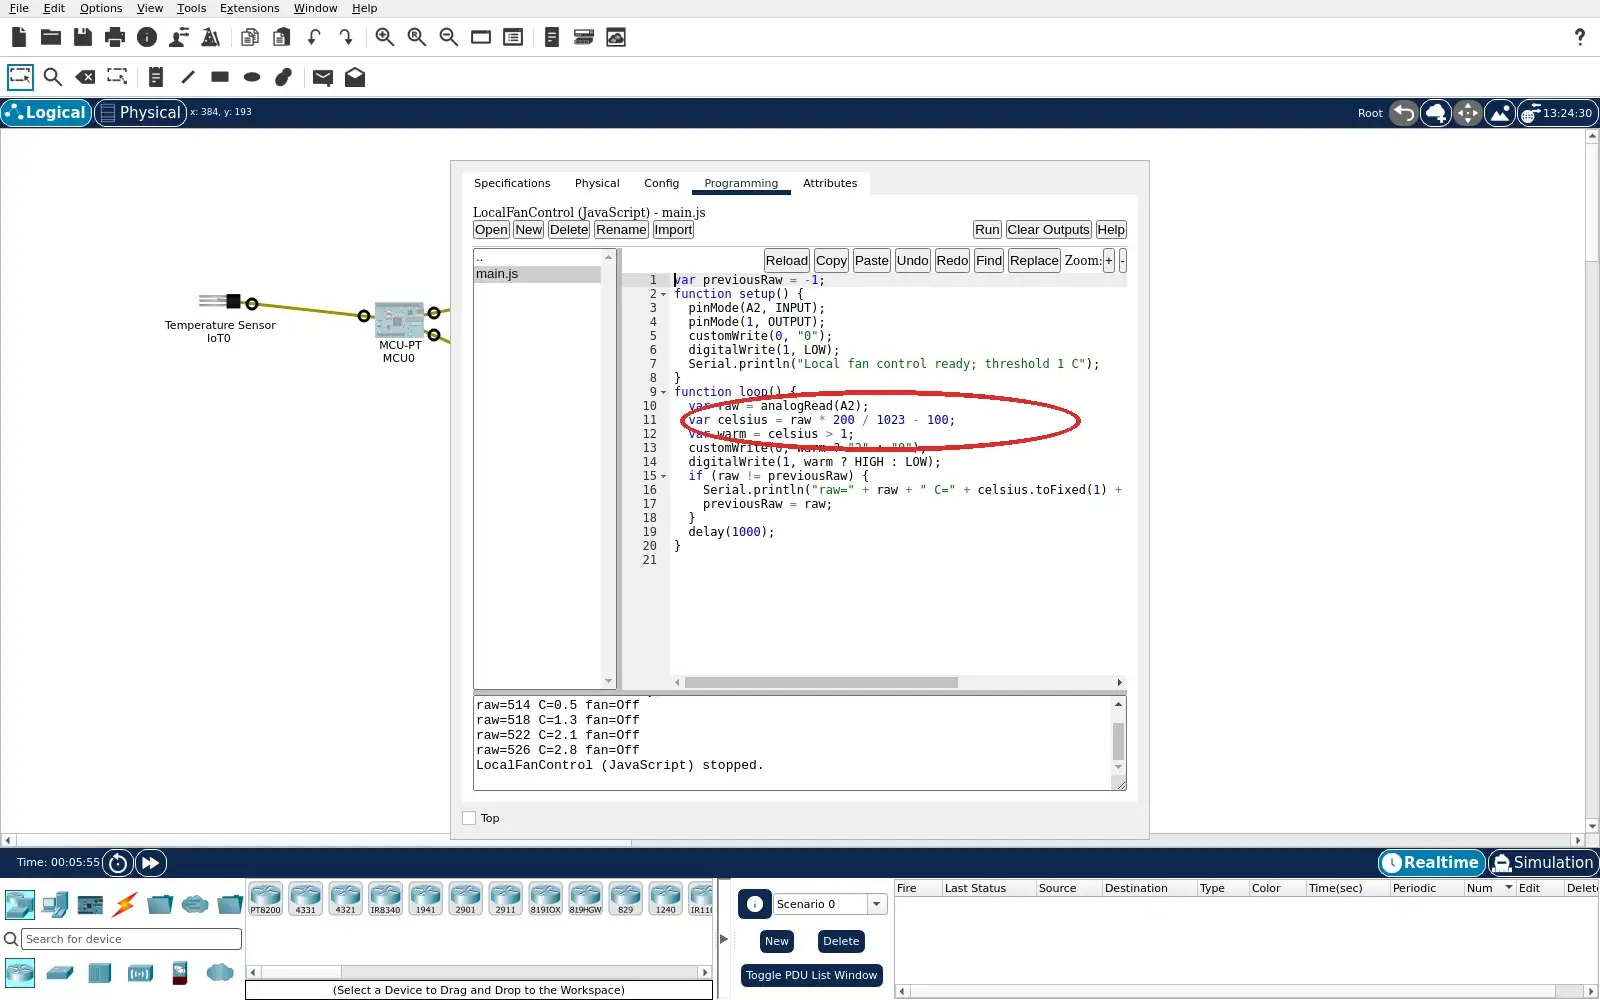
- Open MCU0 Programming tab and main.js. Find analogRead(A2) for the sensor input. Find the 1 °C decision threshold. Read customWrite(0) and digitalWrite(1).
- You will see
- The code declares A2 as an input. Setup writes fan Off and LED LOW. The loop compares converted input with 1 °C. The two output calls follow the comparison.
- Why it matters
- The MCU makes a local decision from a wired input. Setup chooses an explicit Off start state. The threshold is deliberately low for this simulated sensor response. The fan command is an abstraction of physical driver hardware.
Step 3 · Cisco Packet Tracer; numbered callout added to a real capture. Enlarge screenshot (new tab) Step 4
- Do
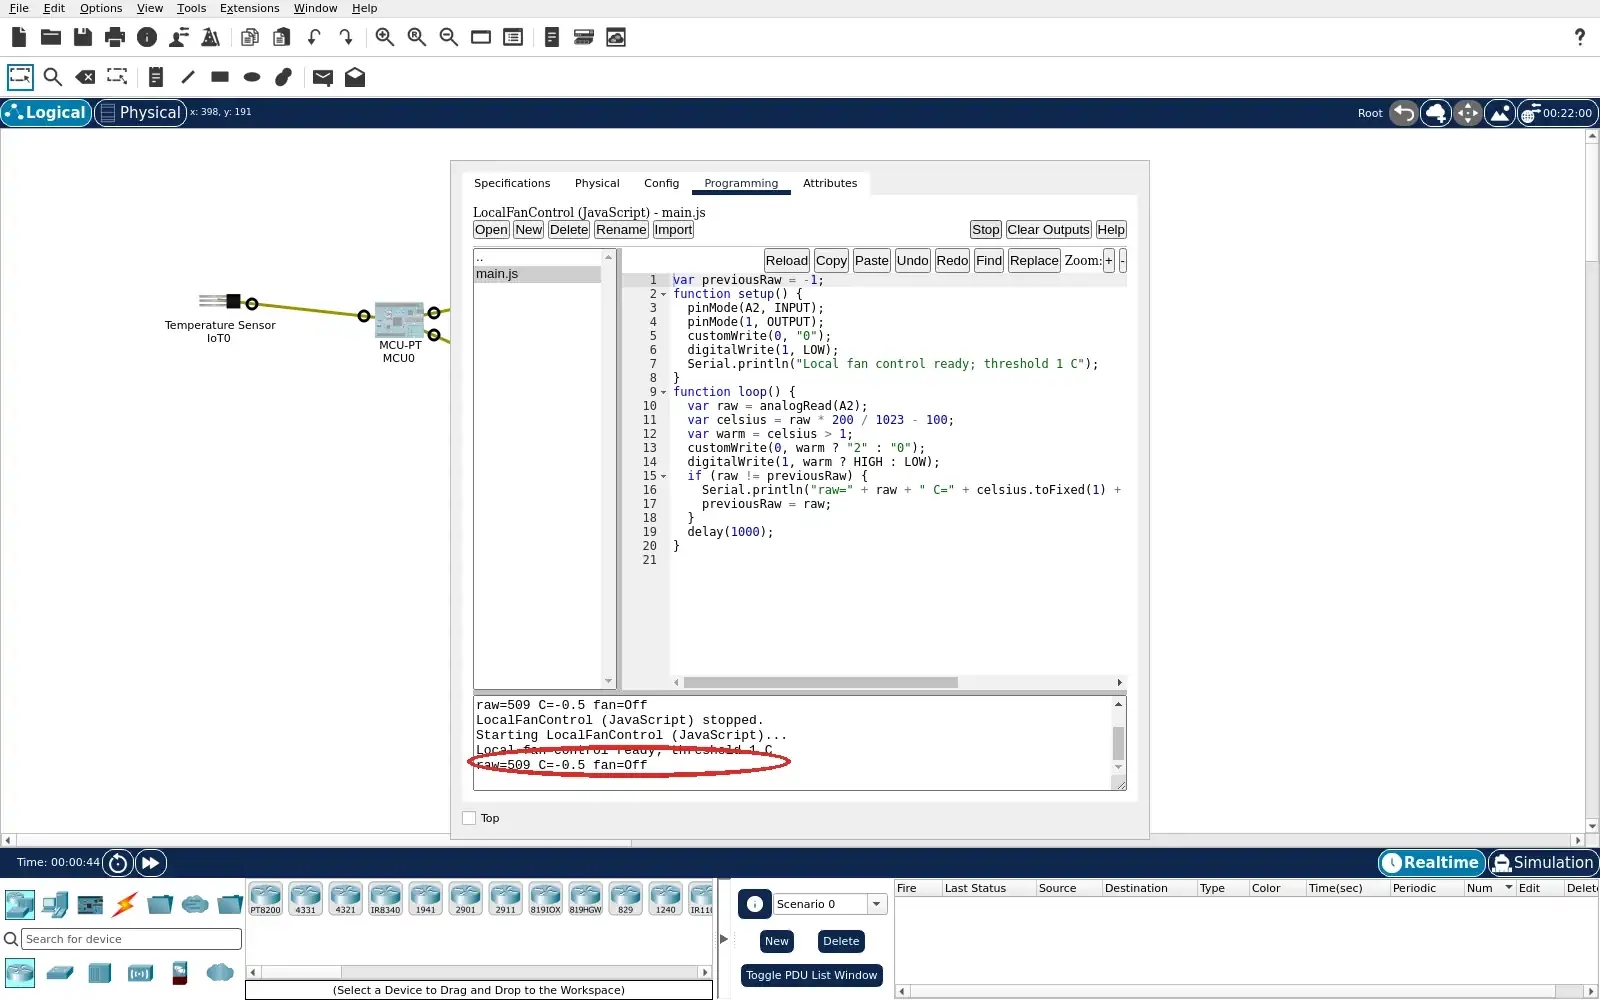
- In MCU0 Programming tab, press Run. Read the Serial Outputs pane. Check the reported sensor value against 1 °C. Confirm the fan command is Off.
- You will see
- The reopened project starts near simulated midnight. Serial output reports raw=509 and C=-0.5. The same line reports fan=Off. The Run button changes to Stop while code runs.
- Why it matters
- This tests the cool branch of the exact saved code. The sensor value is below the chosen threshold. An Off output follows the comparison. It establishes the baseline before environment change.
Step 4 · Cisco Packet Tracer; numbered callout added to a real capture. Enlarge screenshot (new tab) Step 5
- Do
- Open the Environments dialog with Shift+E. Choose Main Wiring Closet for the components. Use Current Time Edit to set 12:30:00. Let the local temperature settle briefly.
- You will see
- The Location field reads Main Wiring Closet. Current Time reads 12:31:30 in this run. Ambient Temperature reads 19.42 °C. The saved local schedule later returns to 0 °C.
- Why it matters
- The input changes inside Packet Tracer. The environmental reading is distinct from the sensor’s slower signal. The MCU responds to analogRead(A2), not the clock label. Wait for the sensor’s reported value to cross the threshold.
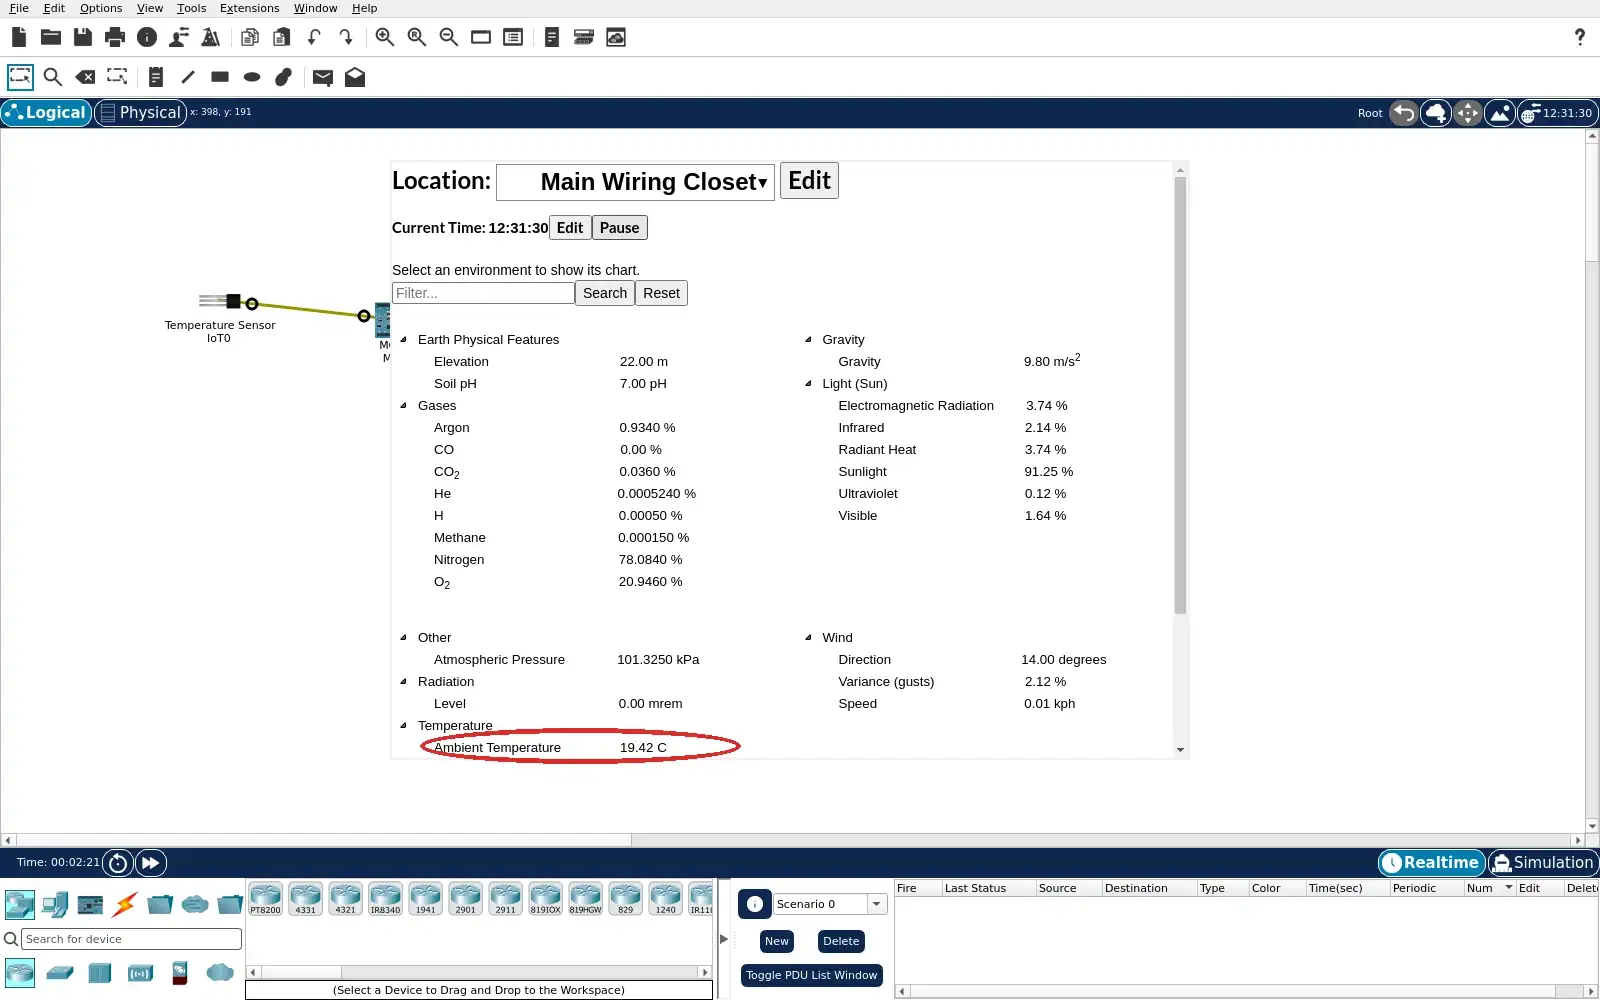
Step 5 · Cisco Packet Tracer; numbered callout added to a real capture. Enlarge screenshot (new tab) Step 6
- Do
- Return to MCU0 Programming tab while time runs. Read the latest raw and converted sensor value. Compare it with the 1 °C threshold in code. Observe the reported fan command.
- You will see
- The Programming view shows the final 1 °C rule. Serial Outputs reports raw=534. The converted value is 4.4 °C. The same line reports fan=High.
- Why it matters
- The measured sensor input crossed the local threshold. The MCU selected the High branch. This proves the rule executed in the real simulation. The physical output view provides a separate check.
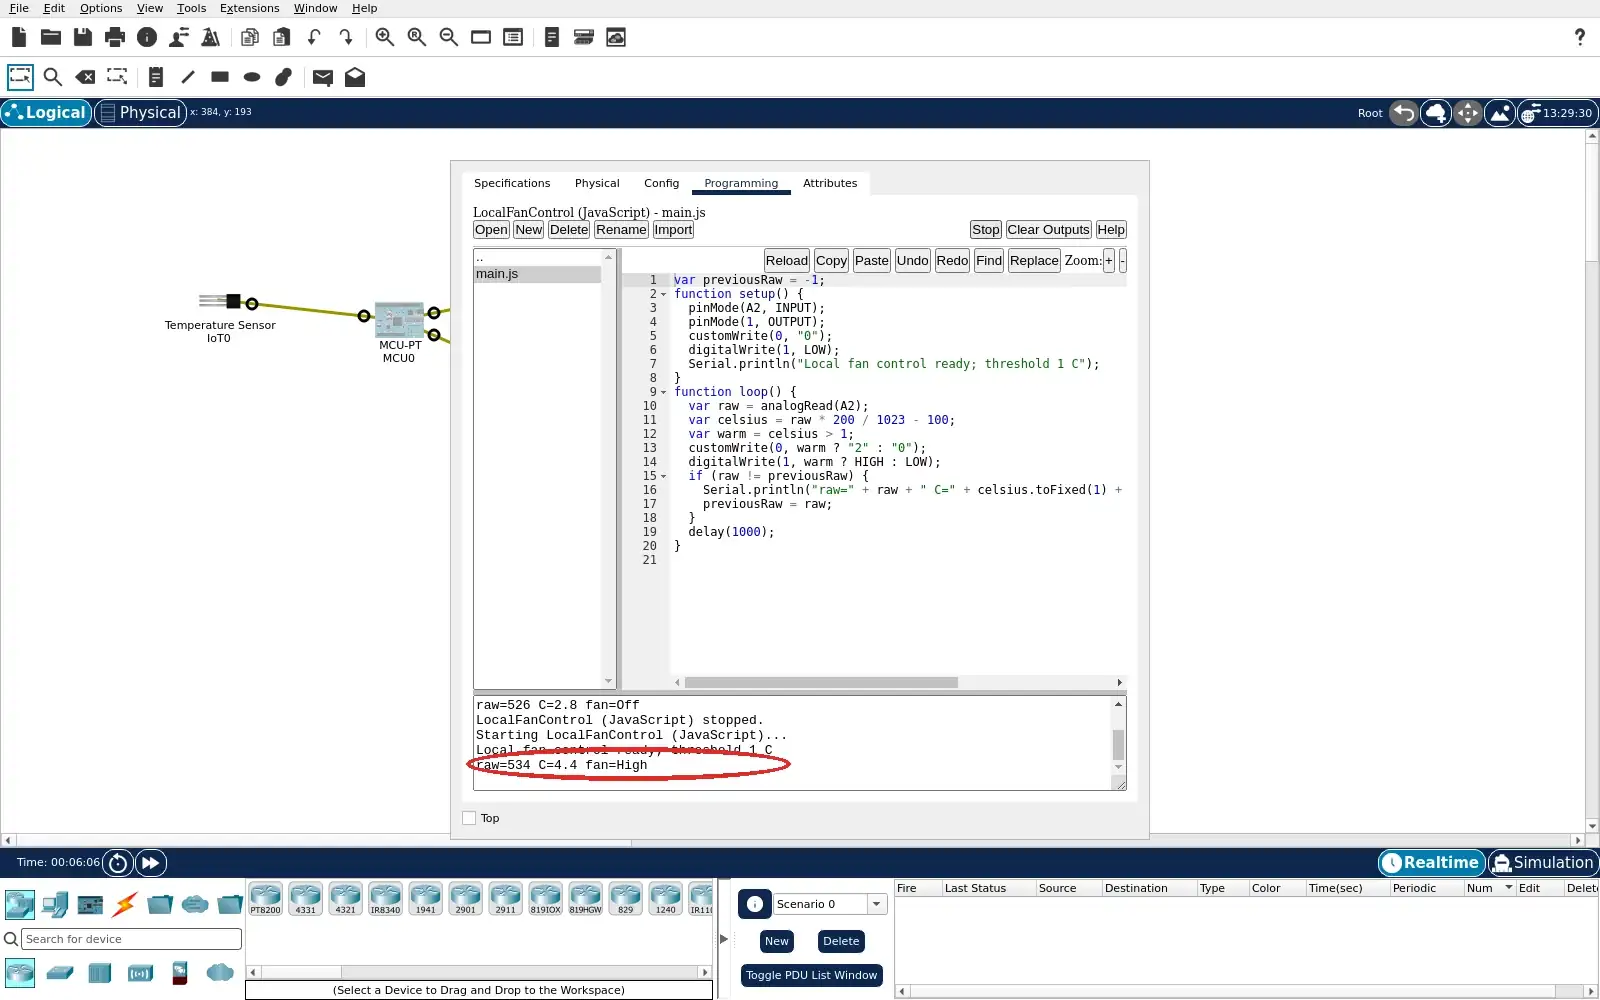
Step 6 · Cisco Packet Tracer; numbered callout added to a real capture. Enlarge screenshot (new tab) Step 7
- Do
- Close the MCU dialog to inspect Logical view. Look at the fan icon above the MCU. Look at the LED below it. Compare both with the cool baseline.
- You will see
- The fan icon has visible motion marks. The LED is bright green. Both remain connected to MCU0 by cables. The screenshot was captured during the warm branch.
- Why it matters
- The outputs match the reported High command. The LED gives a second local state indicator. The fan graphic models motion in Packet Tracer. No coil voltage or flyback behavior is measured.
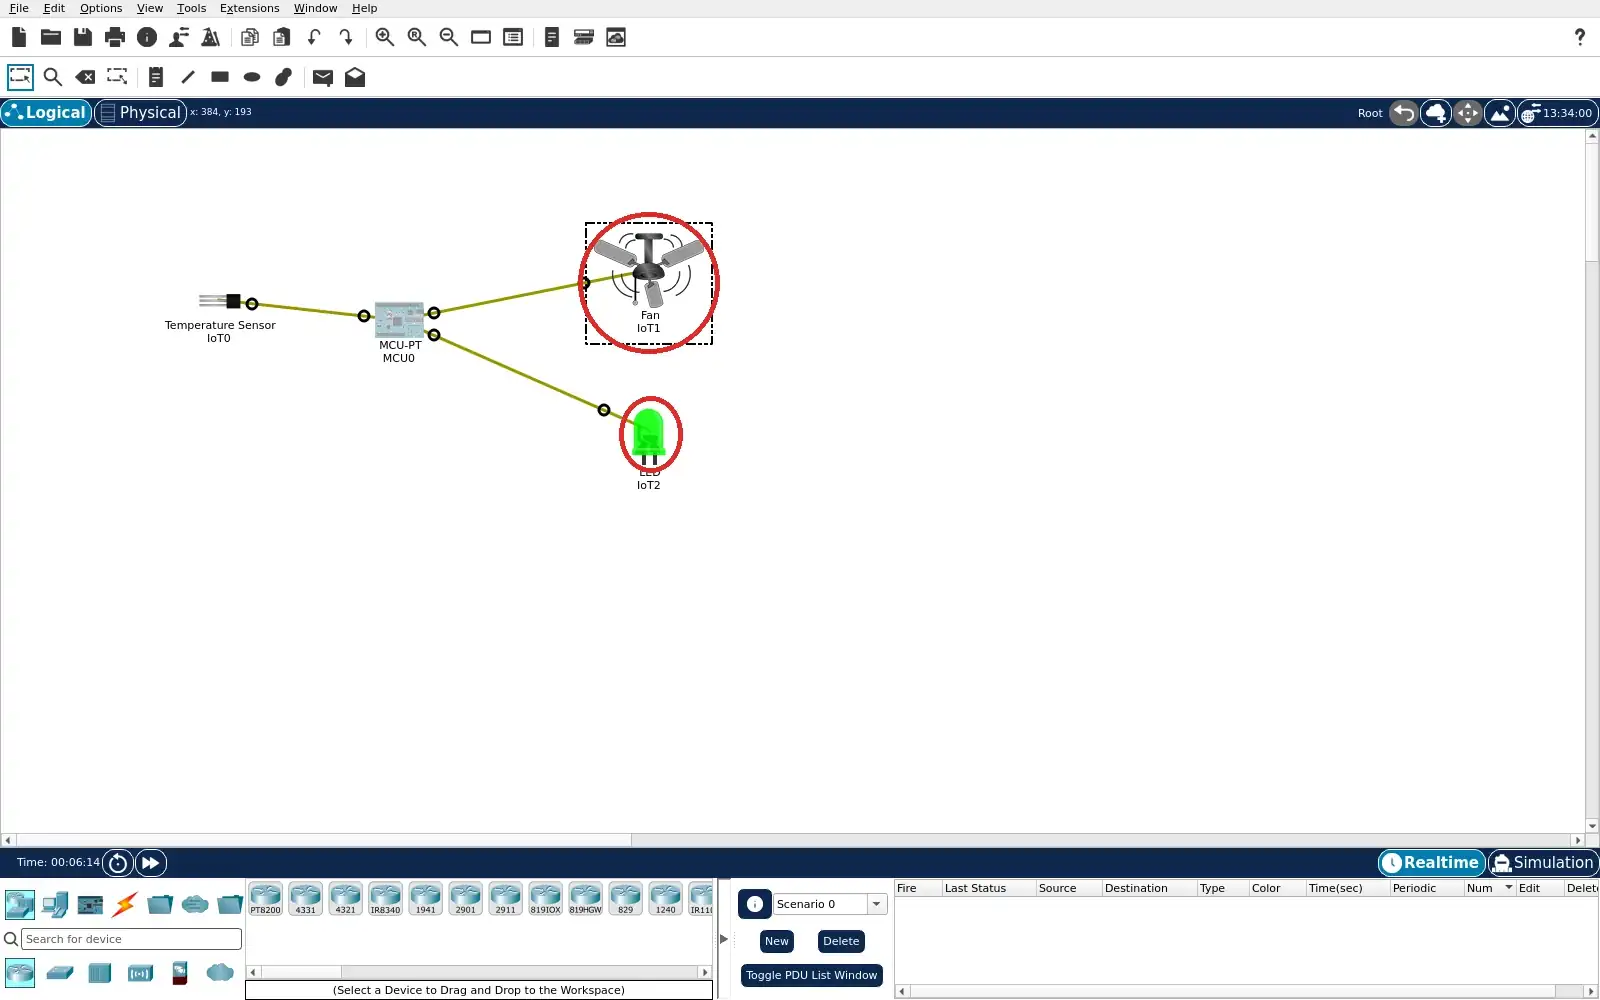
Step 7 · Cisco Packet Tracer; numbered callout added to a real capture. Enlarge screenshot (new tab) Step 8
- Do
- Close the current project and reopen lab.pkt. Return to its saved midnight start state in the Logical workspace. Inspect fan and LED in Logical view. Run MCU0 again to repeat the cool check.
- You will see
- The reopened canvas shows the same three cables. The fan icon has no motion marks. The LED is dark again. The saved project has a reproducible cool start state.
- Why it matters
- Reopening resets the simulated environment and output state. The cool branch is available for another run. This is a project reset, not a field safety interlock. A physical driver needs separate hardware checks.
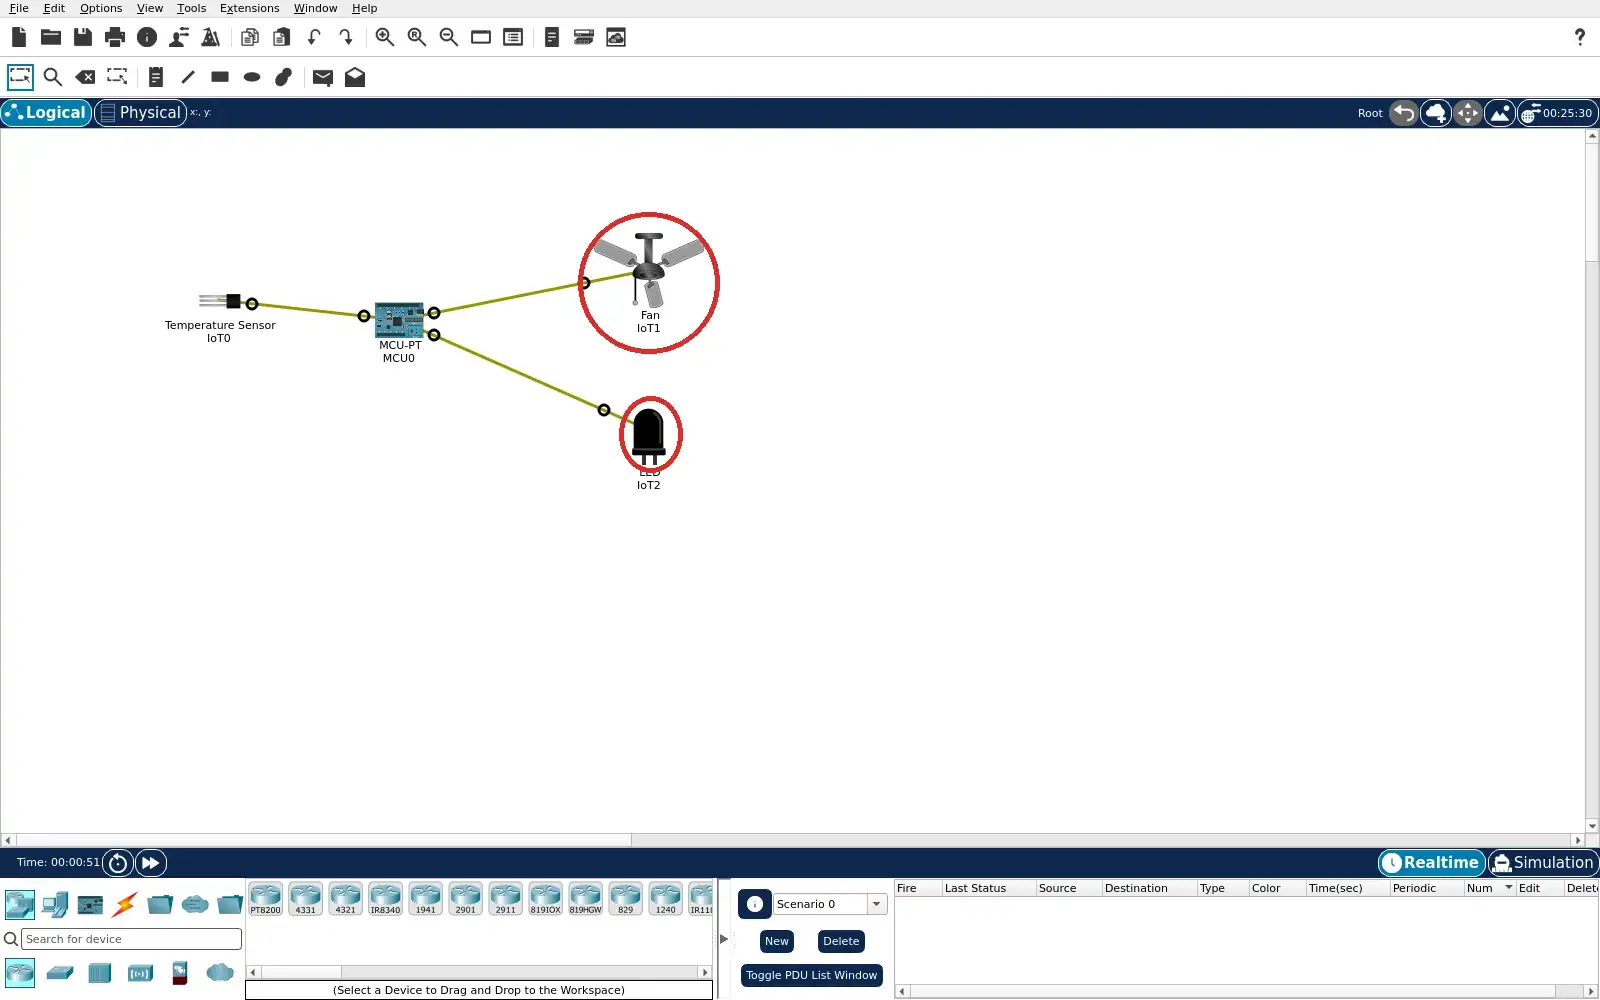
Step 8 · Cisco Packet Tracer; numbered callout added to a real capture. Enlarge screenshot (new tab)
Chapter checks
These questions refer to the chapter’s examples. Use the return links to review their answers.
An ESP32 must switch a 5 V relay coil rated at 80 mA. What is the safest interface design?
Return to the chapter’s knowledge checkA switch cycles often in a quiet room. When is an SSR a sound first candidate?
Return to the chapter’s knowledge check
Return to Relays and Solenoids: Drivers and Protection · Browse Labs