Local Control When the Cloud Path Is Unavailable
Run a wired MCU temperature rule, observe its registered fan through a routed remote server, then break the uplink and compare local control with remote reporting.
Packet Pete
Predict the reading, then compare it with the measurement.
Cisco Packet Tracer
Desktop labRun a wired MCU temperature rule, observe its registered fan through a routed remote server, then break the uplink and compare local control with remote reporting.
Install the tool; build from the steps. No file yet.
Download the Packet Tracer fileSteps
Step 1
- Do
- Open lab.pkt in Packet Tracer Logical workspace. Trace IoT0 to MCU0 and MCU0 to IoT1 and IoT2. Trace IoT1's dotted radio path to Site-Gateway. Follow the gateway, router and switch to the remote server and PC.
- You will see
- The Temperature Sensor is wired to MCU0. The Fan and LED have separate wired MCU paths. IoT1 also has a dotted association to Site-Gateway. The site and remote network connect through Uplink-Router.
- Why it matters
- The wired path locates the control decision at the MCU. The wireless and routed path carries fan reporting. Remote-Server models a service beyond the site. The two paths can fail differently and must be tested separately.
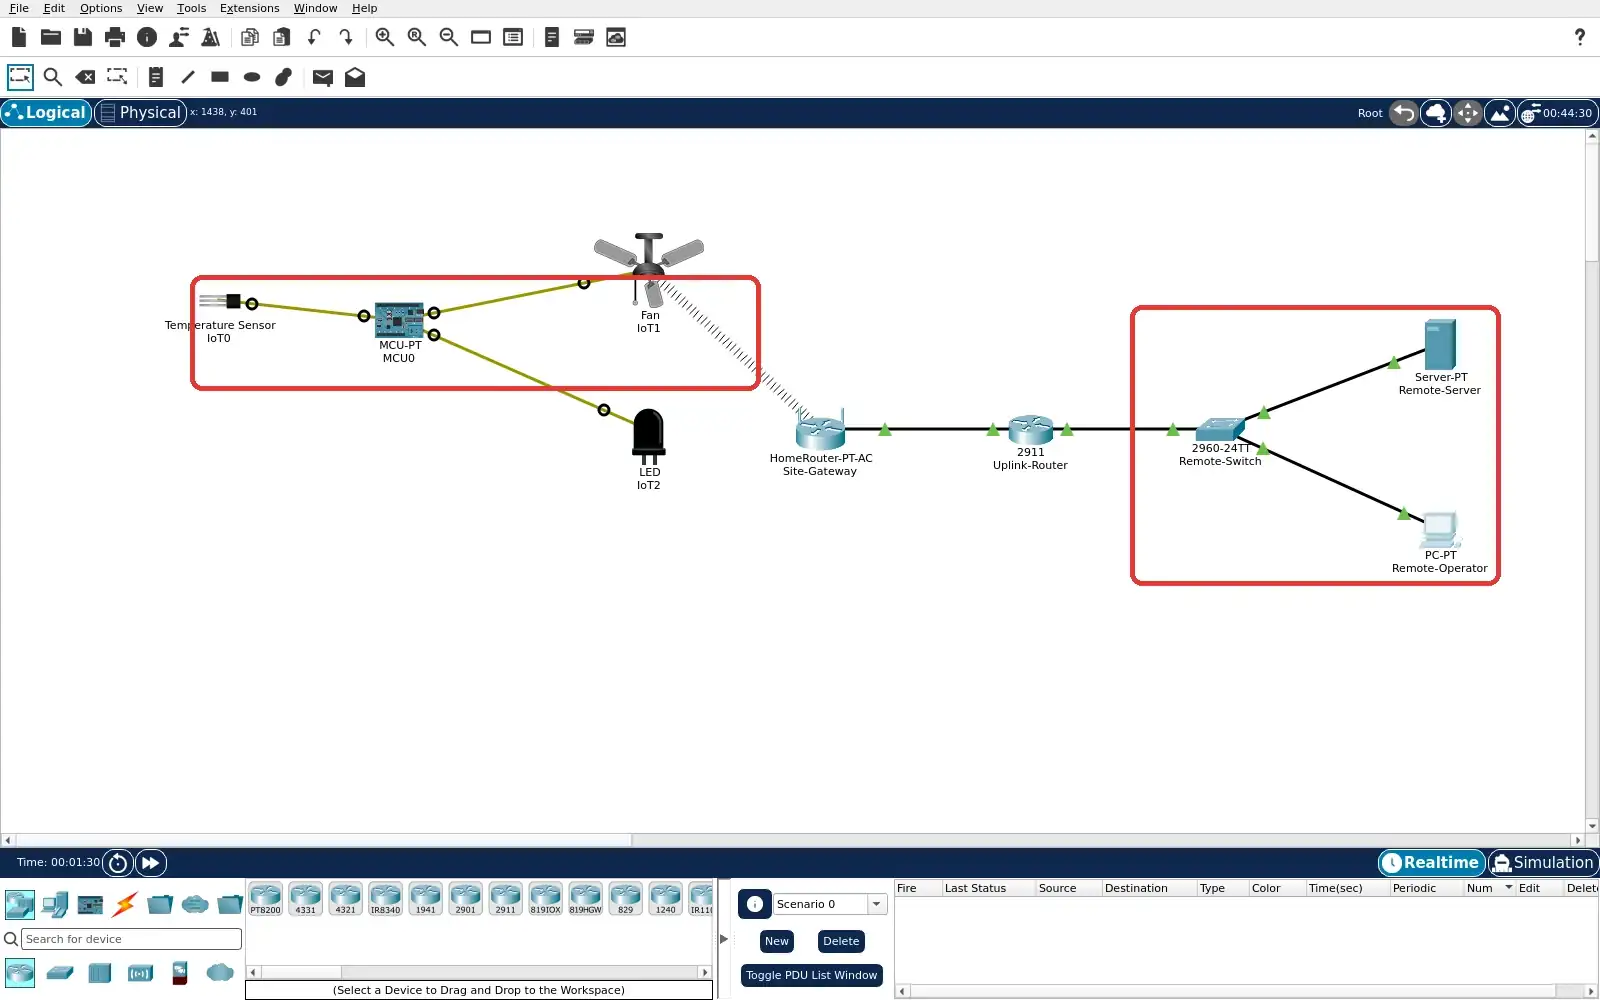
Step 1 · Cisco Packet Tracer; numbered callout added to a real capture. Enlarge screenshot (new tab) Step 2
- Do
- Open MCU0 Programming tab and main.js. Find analogRead(A2) and the 1 °C comparison. Read the fan and LED output commands. Press Run if needed and inspect Serial Outputs at the cool baseline.
- You will see
- The actual program reads analog input A2. It compares converted Celsius with 1 °C. It writes fan High and LED HIGH above the threshold. The cool serial line reads raw=509 C=-0.5 fan=Off.
- Why it matters
- The code proves where the control decision executes. The MCU uses a wired sensor independent of routing. The cool branch gives an observed Off baseline. The output values are PT component commands, not relay ratings.
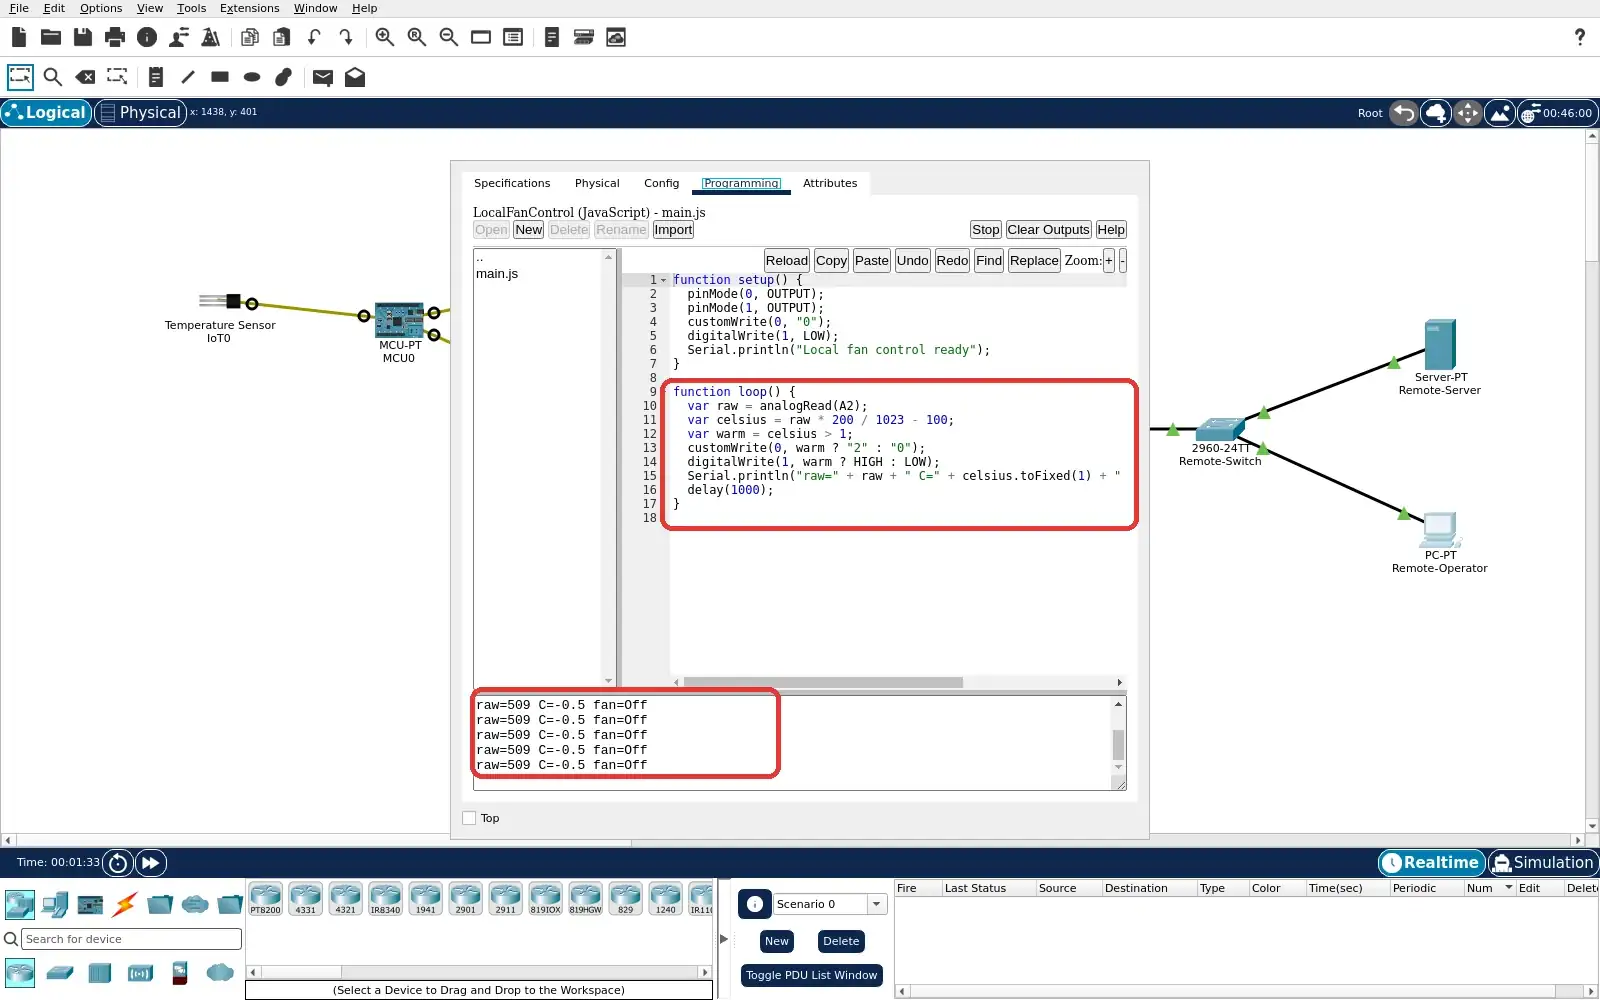
Step 2 · Cisco Packet Tracer; numbered callout added to a real capture. Enlarge screenshot (new tab) Step 3
- Do
- Open the Environments dialog from the top toolbar. Choose Main Wiring Closet in the Location list. Set Current Time to 12:30:00 with Edit. Watch Ambient Temperature while the wired sensor responds.
- You will see
- Location reads Main Wiring Closet. Current Time reads 12:39:30 in the capture. Ambient Temperature reads 16.09 °C. The temperature schedule is simulated inside PT.
- Why it matters
- The input change is made in the real simulator. Ambient temperature and sensor voltage are distinct. The component's reading lags the room value. The next step checks the MCU result, not just the environment.
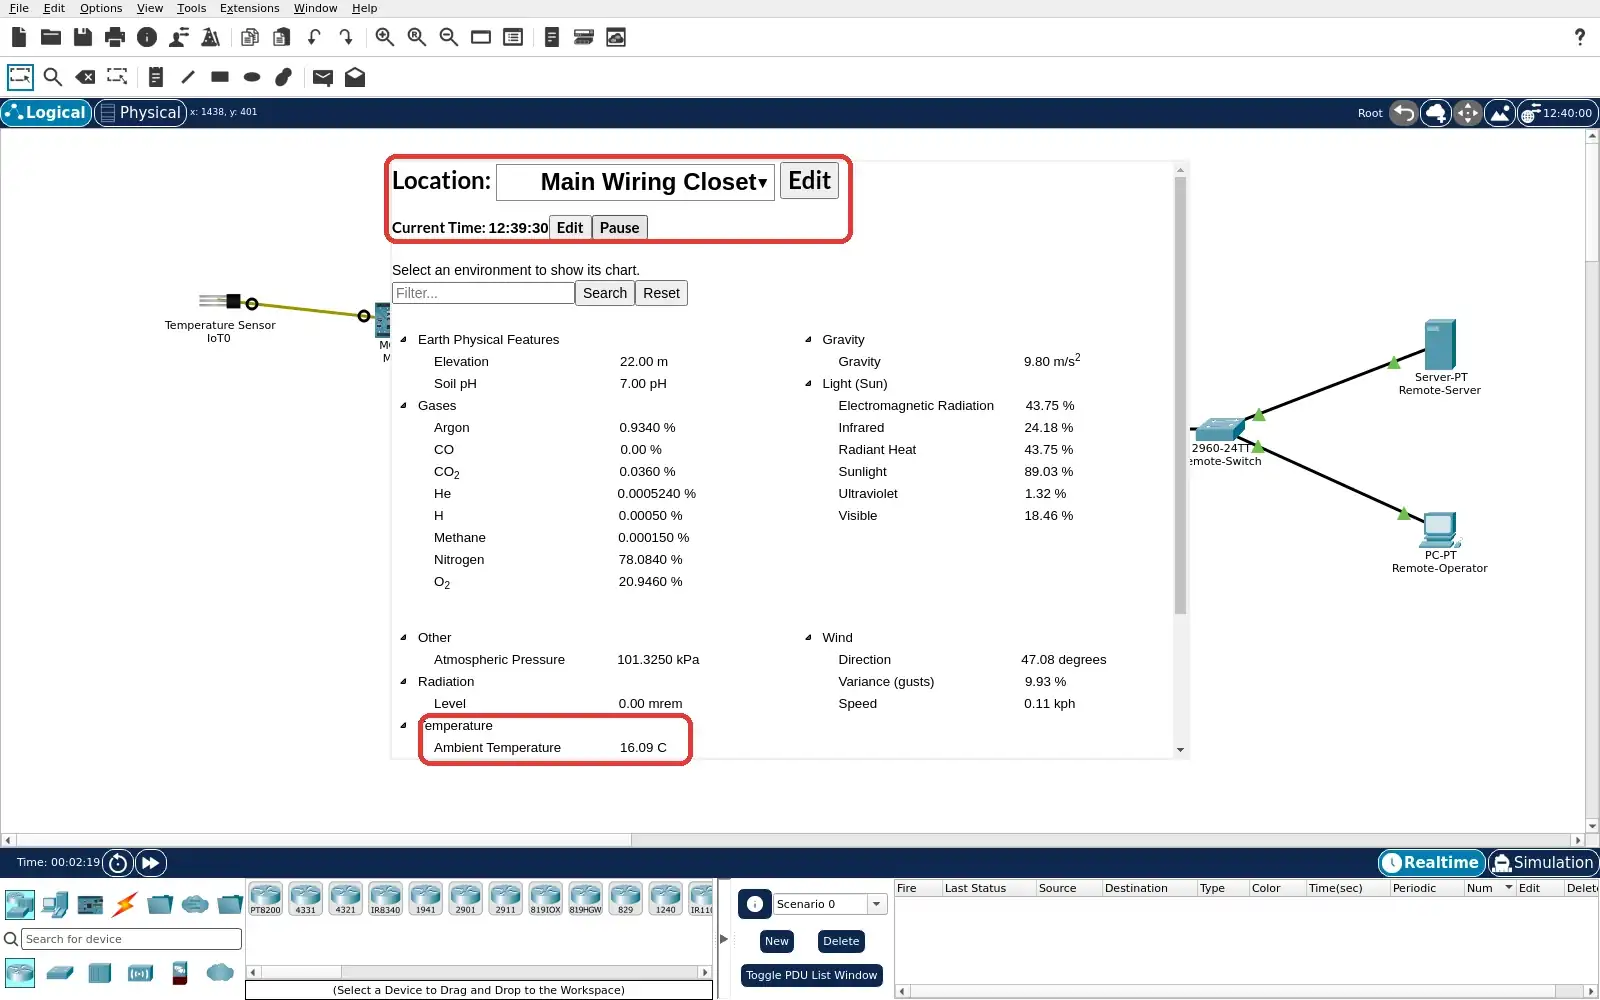
Step 3 · Cisco Packet Tracer; numbered callout added to a real capture. Enlarge screenshot (new tab) Step 4
- Do
- Return to MCU0 Programming tab after warming. Read the newest Serial Outputs line. Compare converted Celsius with the 1 °C threshold. Check the fan and LED on the Logical canvas.
- You will see
- Serial output reports raw=518 C=1.3 fan=High. The value exceeds the saved 1 °C comparison. The program still reads analogRead(A2). The High output repeats in Serial Outputs.
- Why it matters
- The local output follows the saved MCU program. The observation includes input, decision and actuator. It does not need the remote server to run. The response is qualitative and not a latency measurement.
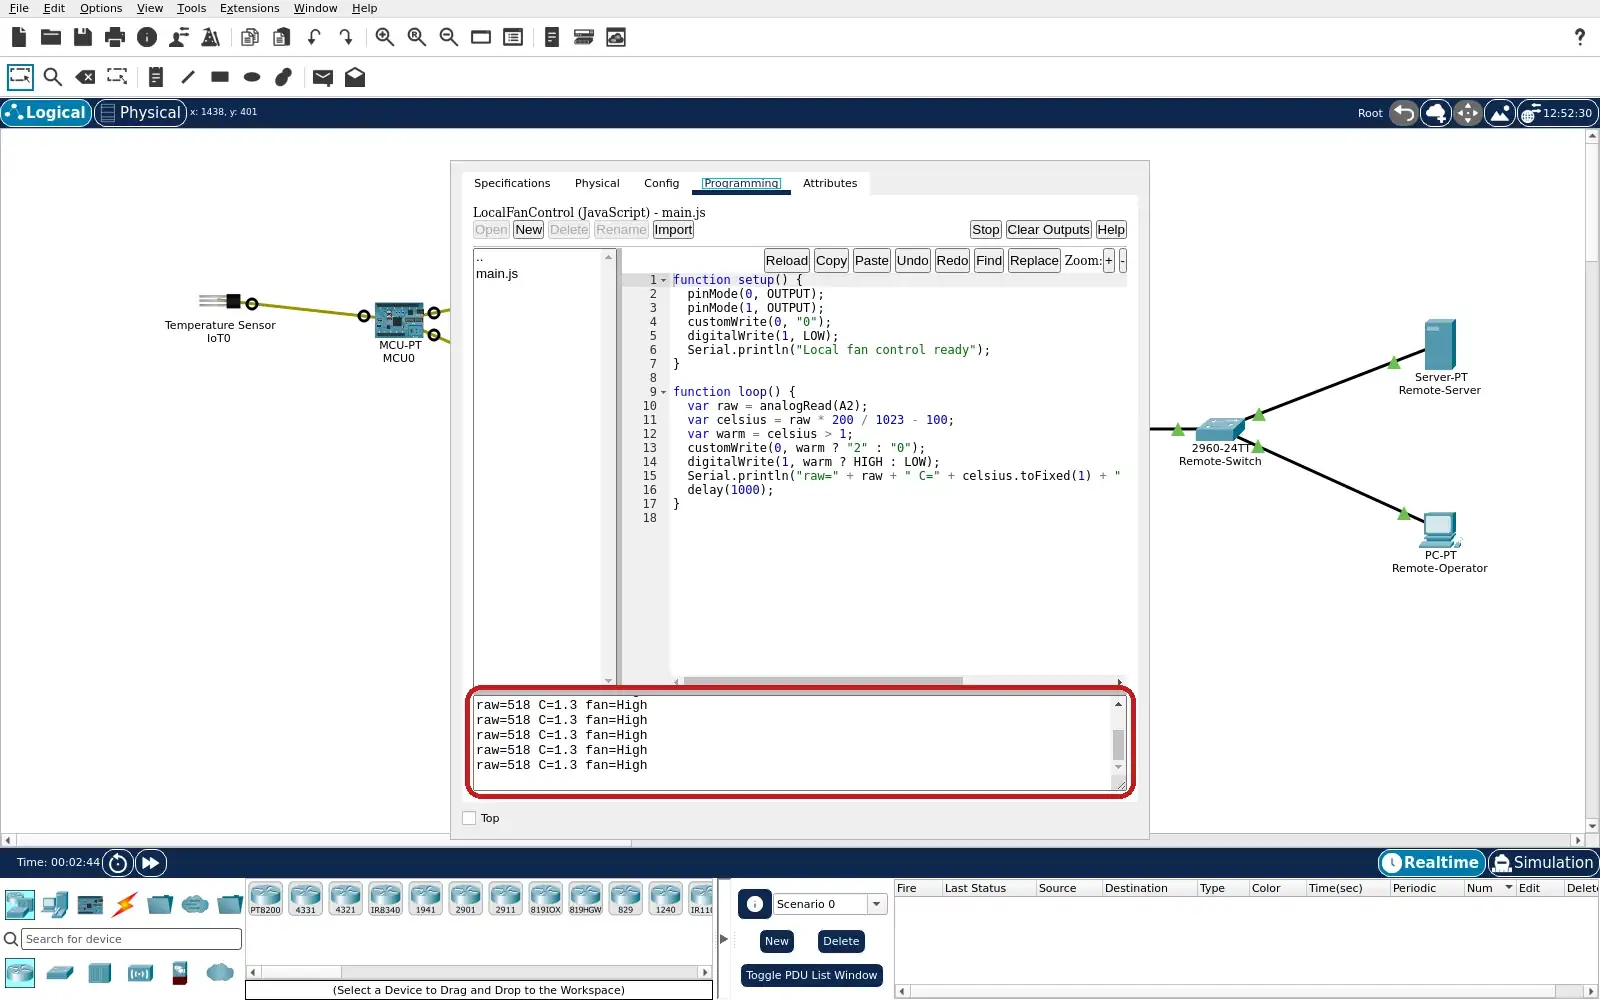
Step 4 · Cisco Packet Tracer; numbered callout added to a real capture. Enlarge screenshot (new tab) Step 5
- Do
- On Remote-Operator, open Desktop Web Browser. Visit http://10.10.10.10 and sign in as edgeop. Expand the IoT1 Ceiling Fan row in the Devices list. Read its online marker and selected Status button.
- You will see
- The Server-PT page lists IoT1 as a Ceiling Fan. Its row has a green online dot. The High Status button is selected in blue. The URL is the remote server's 10.10.10.10 address.
- Why it matters
- This is a healthy remote reporting baseline. The fan is dual attached: MCU component wire and Wi-Fi. The remote page observes the output state. The server does not execute the MCU threshold code.
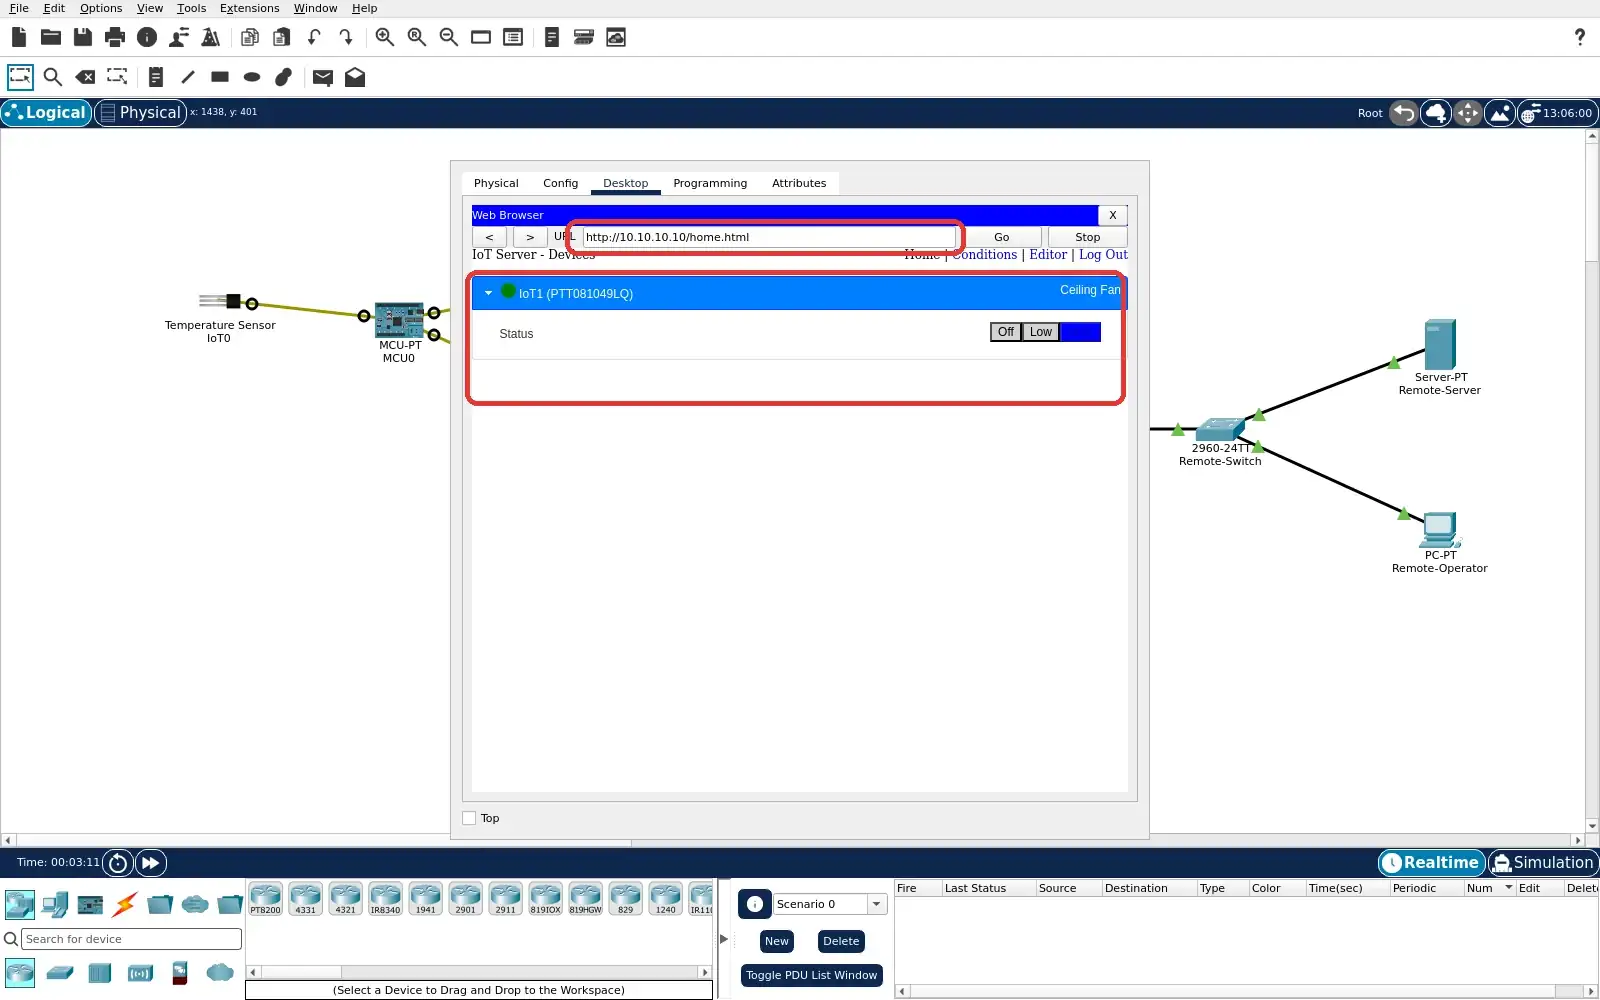
Step 5 · Cisco Packet Tracer; numbered callout added to a real capture. Enlarge screenshot (new tab) Step 6
- Do
- Open Uplink-Router CLI tab. Enter configure terminal, interface GigabitEthernet0/0, shutdown. Run show ip interface brief. Check the gateway-to-router cable markers on the canvas.
- You will see
- GigabitEthernet0/0 is 172.16.0.1. Its Status reads administratively down. Its Protocol reads down. The gateway-to-router markers are red.
- Why it matters
- This fault removes the routed upstream path. It leaves MCU component wires intact. The remote server remains reachable from its own PC. The precise interface state identifies the failure boundary.
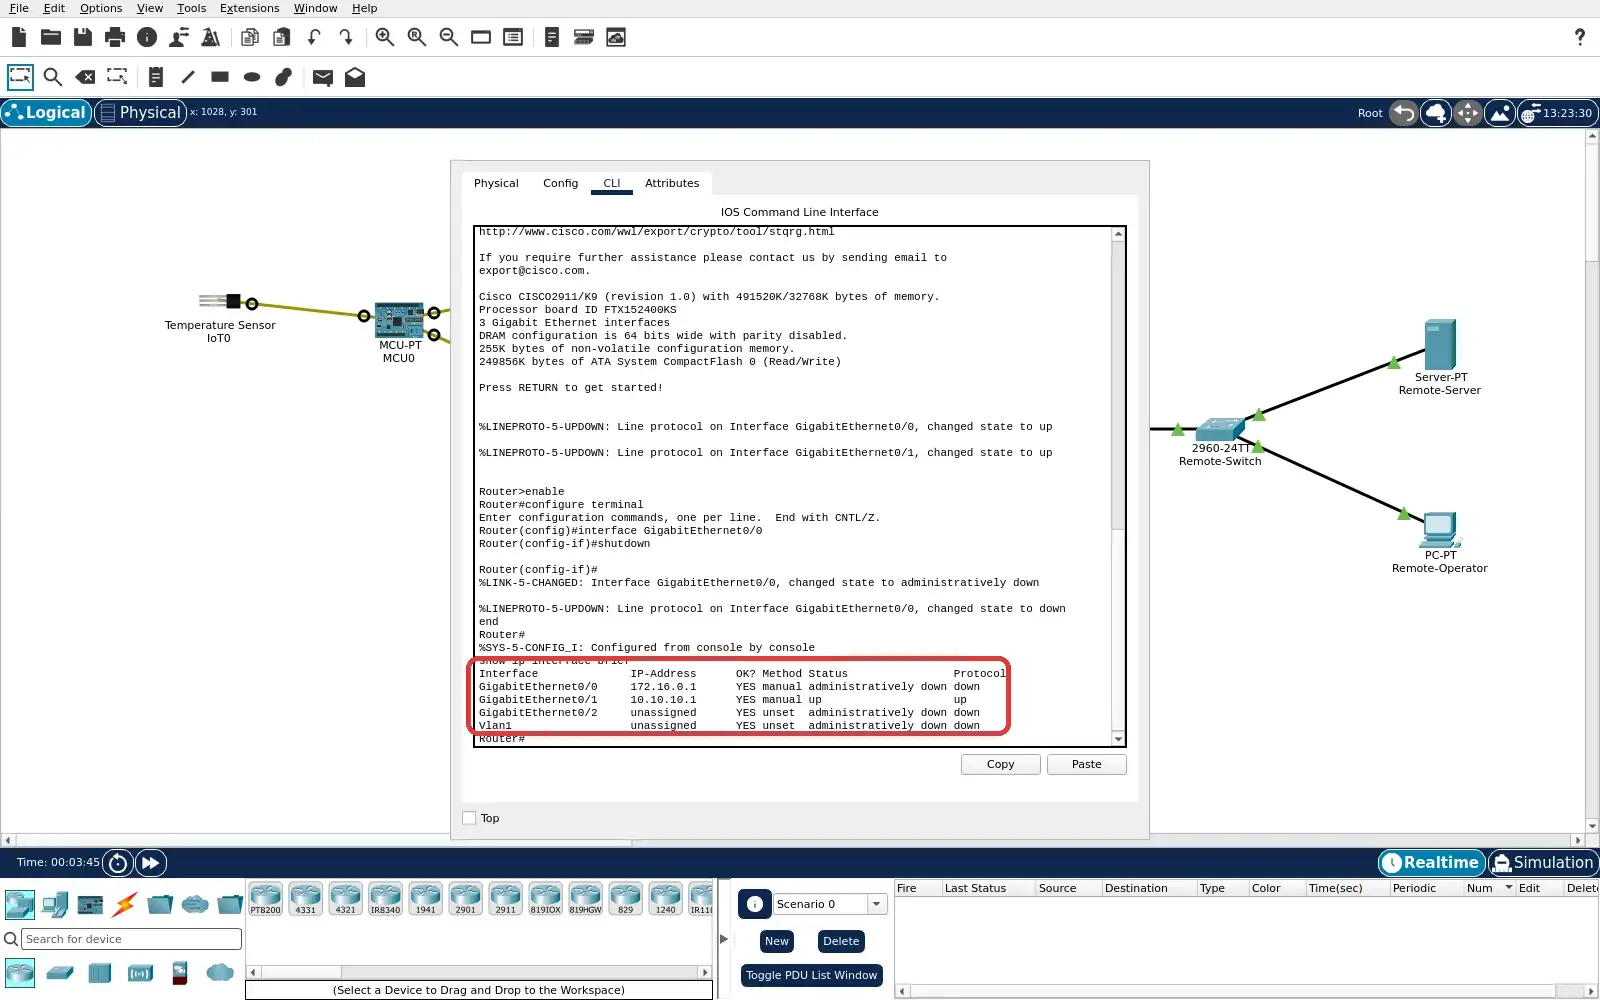
Step 6 · Cisco Packet Tracer; numbered callout added to a real capture. Enlarge screenshot (new tab) Step 7
- Do
- Keep GigabitEthernet0/0 down. In the Environments dialog, set Main Wiring Closet Current Time to midnight. Wait for the wired sensor reading to fall below 1 °C. Read MCU0 Serial Outputs and inspect the local fan and LED.
- You will see
- MCU0 reports raw=514 C=0.5 fan=Off. The saved program is still running in Programming. The Serial Outputs pane continues to update. The input is below the 1 °C threshold.
- Why it matters
- The local actuator still follows the sensor and code. The router fault has not disabled the MCU loop. The sensor's slow response is visible in PT. This is local continuity, not a measured failover time.
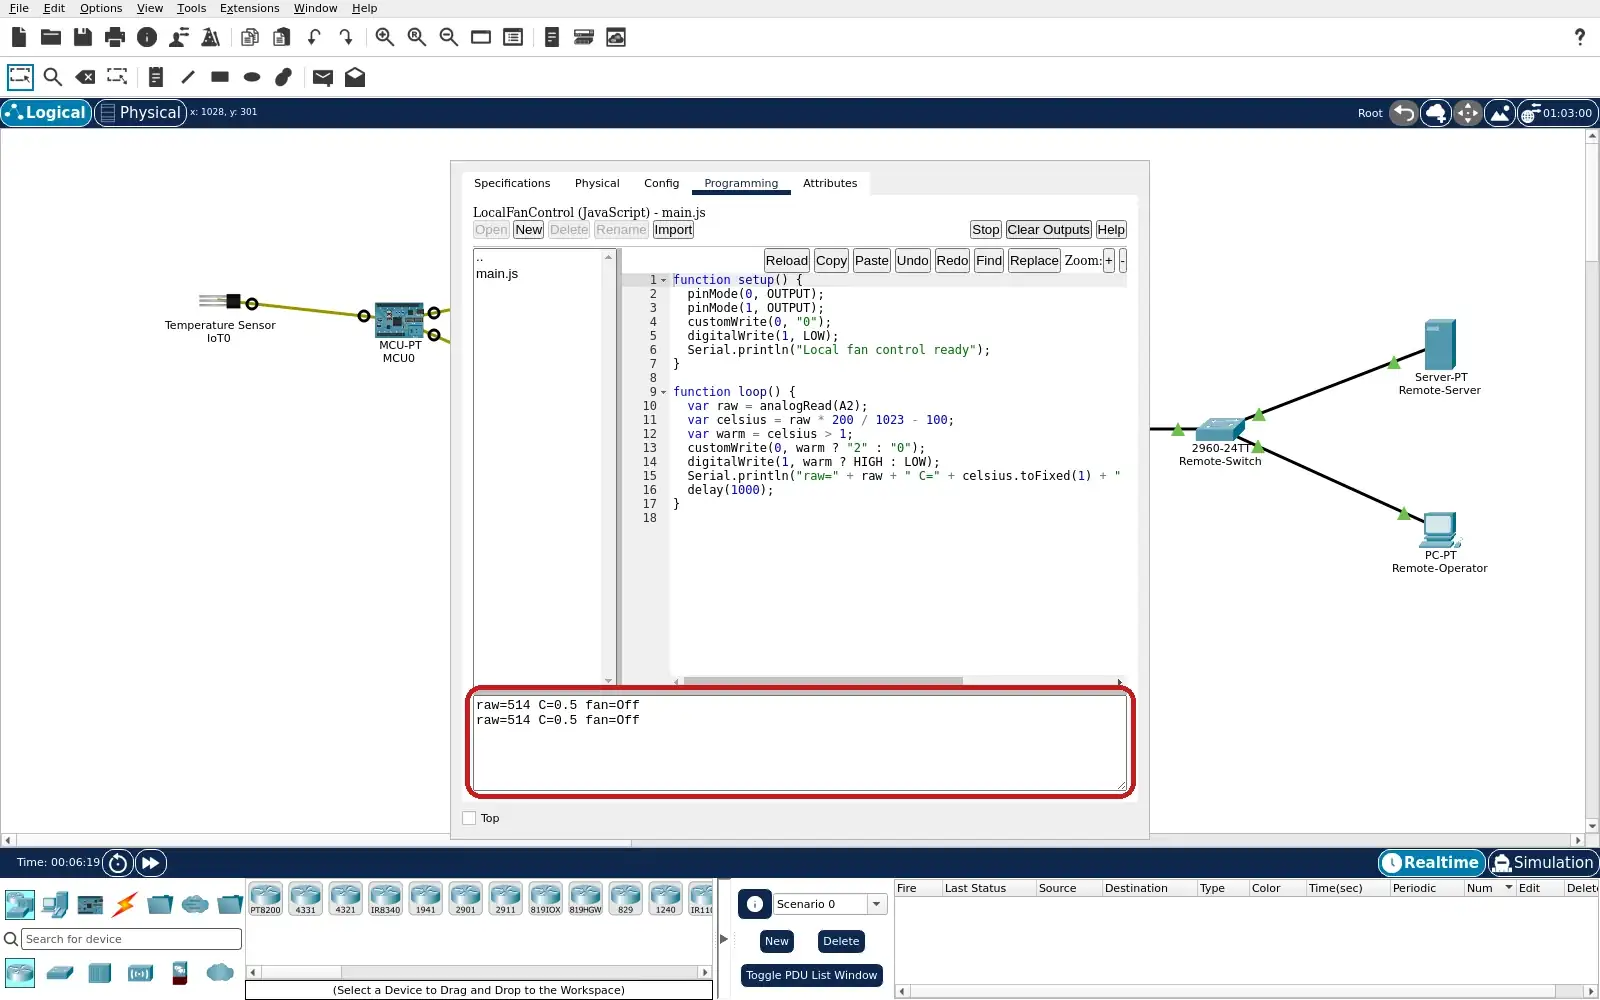
Step 7 · Cisco Packet Tracer; numbered callout added to a real capture. Enlarge screenshot (new tab) Step 8
- Do
- Close the MCU window without restoring the router. Inspect the local fan and LED on the Logical canvas. Look at the site-to-router cable markers. Compare them with the remote-side router link.
- You will see
- The local fan has no motion marks. The LED is dark after the cool input. The site-to-router markers remain red. The router-to-remote-switch markers remain green.
- Why it matters
- This gives a physical view of the local Off output. It also shows the network fault still present. The two outcomes occur on different paths. The local controller does not require the uplink to change output.
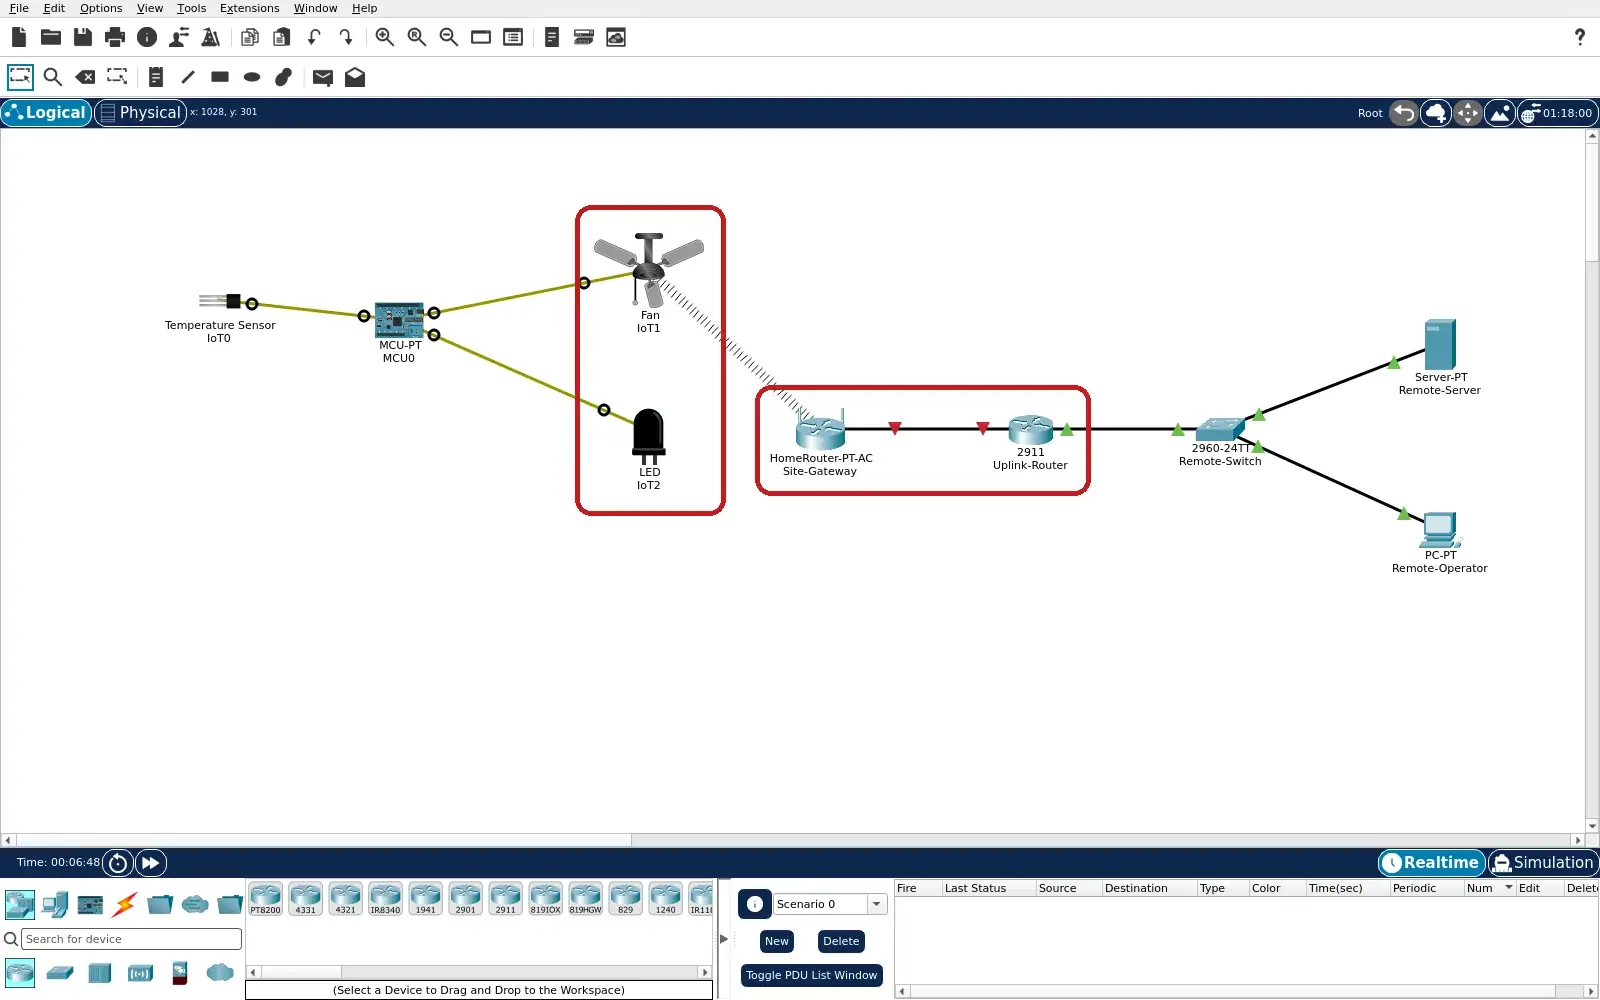
Step 8 · Cisco Packet Tracer; numbered callout added to a real capture. Enlarge screenshot (new tab) Step 9
- Do
- On Remote-Operator, inspect the already open Devices list. Expand IoT1 while the router uplink is still down. Read the online marker and message in the row. Do not infer a current fan value from an offline device.
- You will see
- The registered IoT1 row remains listed. Its online dot is red. The expanded row says Device is offline. No current High or Off selection is supplied there.
- Why it matters
- The server can report loss of the device path. The operator has no fresh remote fan value during this fault. Local control can continue without remote observation. A disconnected device must not be treated as a live reading.
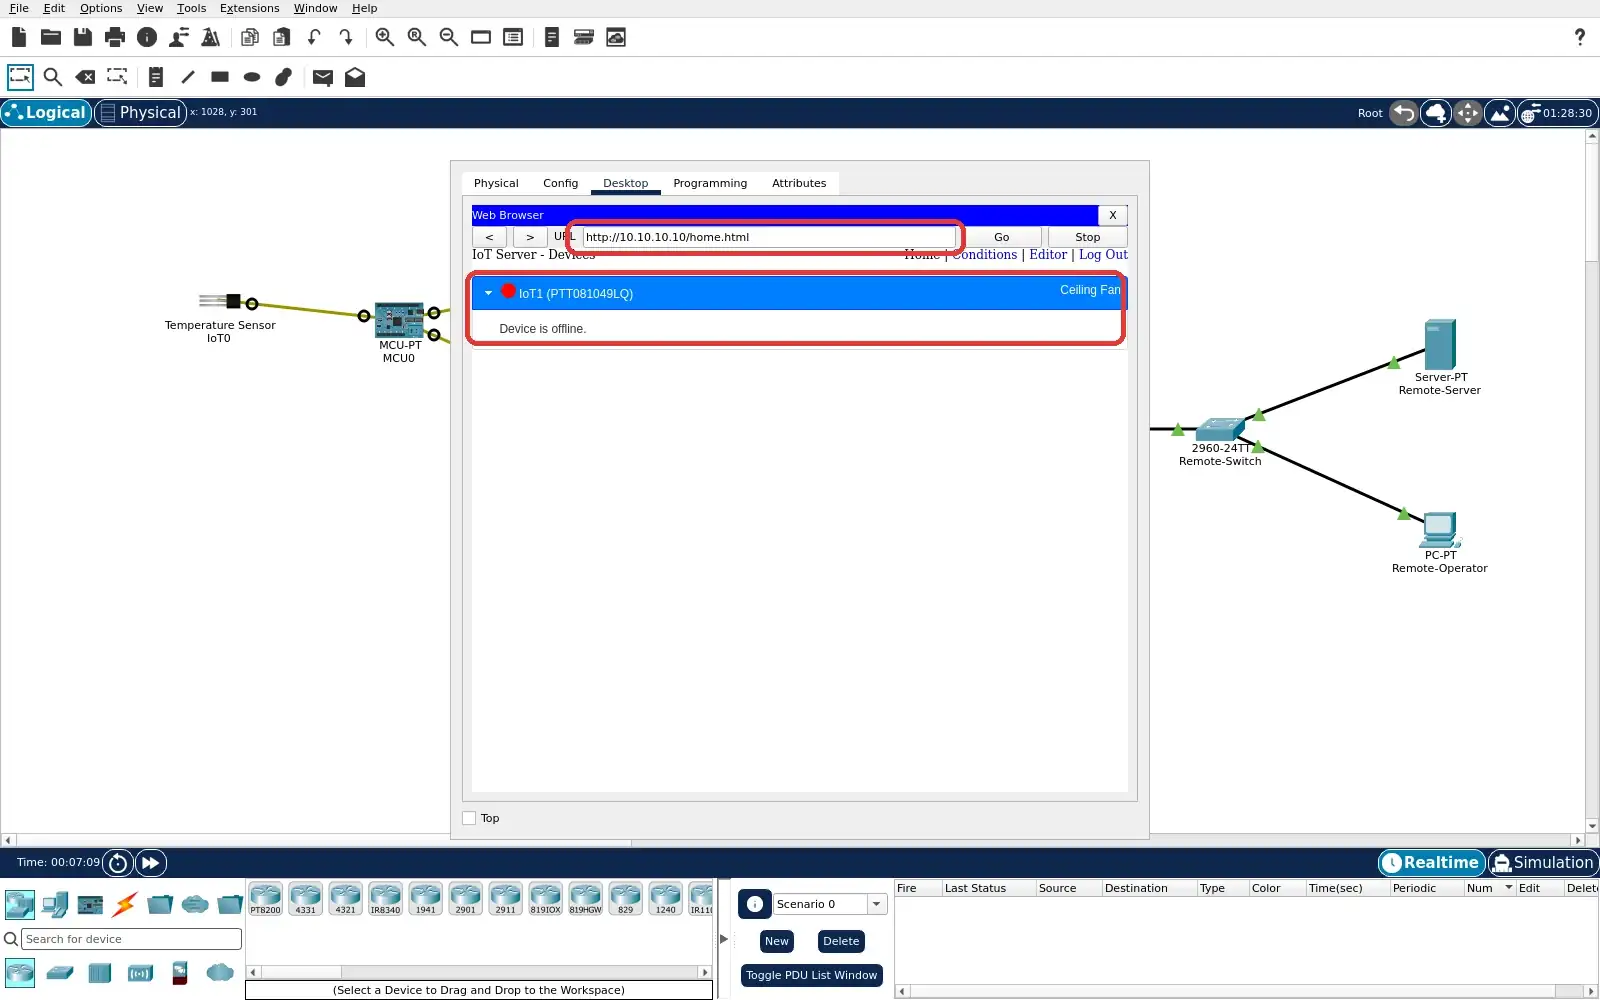
Step 9 · Cisco Packet Tracer; numbered callout added to a real capture. Enlarge screenshot (new tab) Step 10
- Do
- On Uplink-Router CLI tab, apply no shutdown to GigabitEthernet0/0. Wait for the site-to-router cable markers to turn green. Reload or reopen the operator browser and sign in again. Expand IoT1 and compare its Status with the local Off state.
- You will see
- The router uplink is restored to up/up. The site-to-router markers are green again. IoT1 returns with a green online dot. The Off Status button is selected in blue.
- Why it matters
- The remote service receives the current fan state again. Recovery is observed rather than assumed from one link light. The local MCU did not need a new rule. This simulator result does not prove a production cloud SLA.
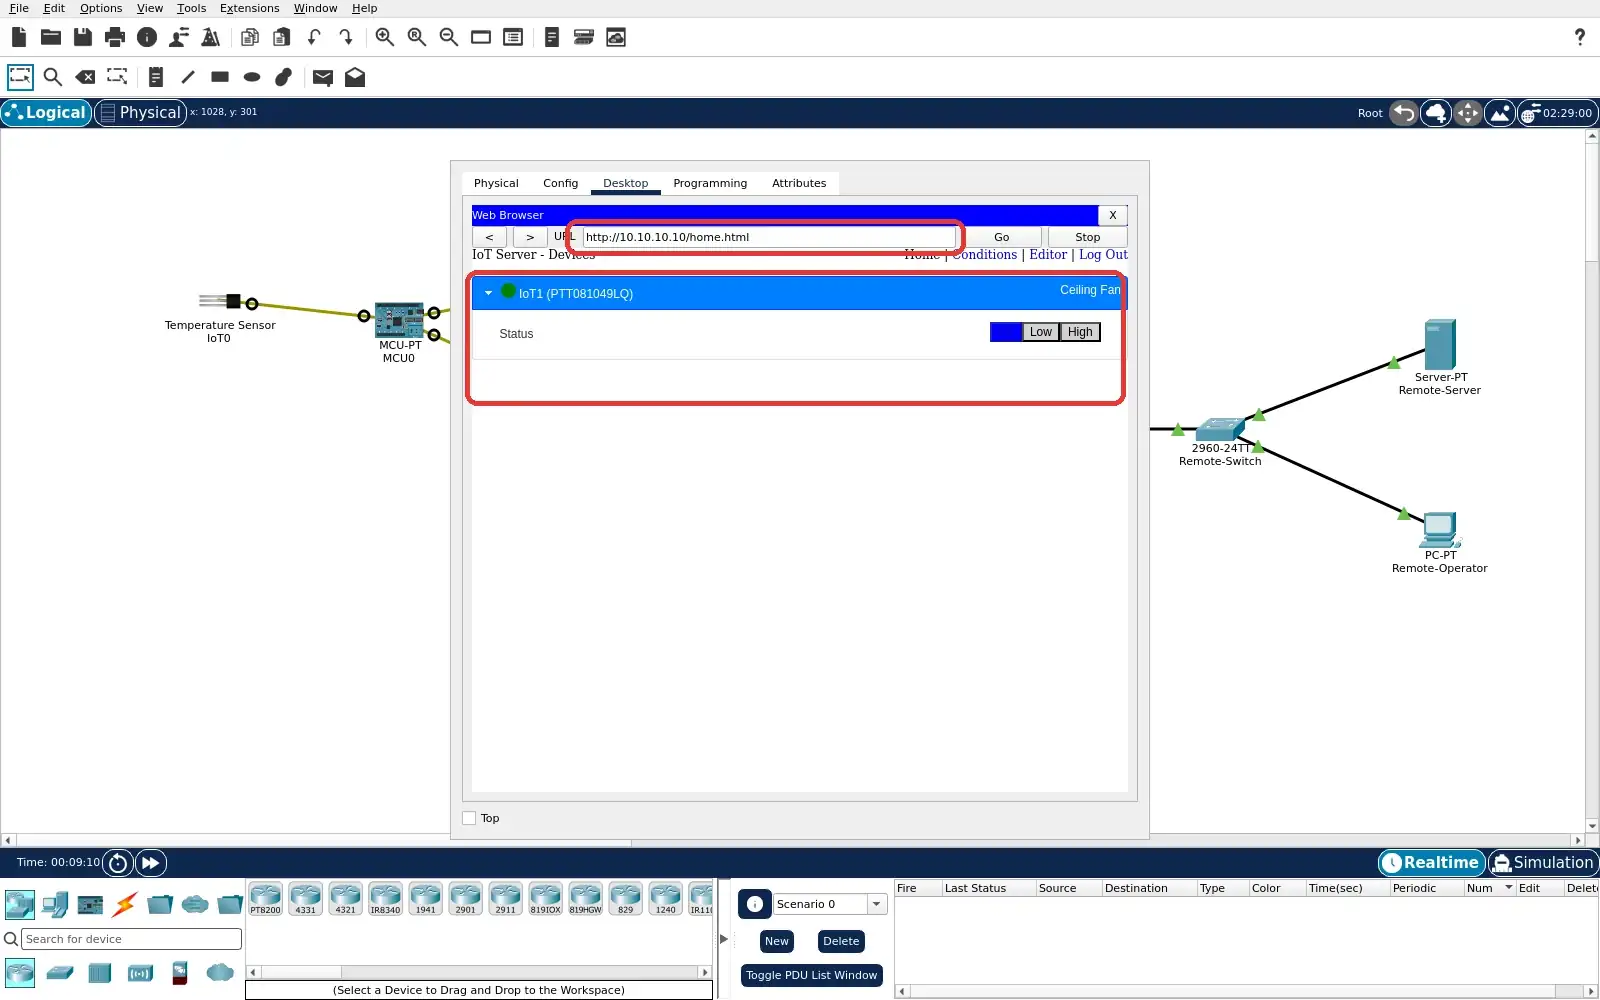
Step 10 · Cisco Packet Tracer; numbered callout added to a real capture. Enlarge screenshot (new tab)
Chapter checks
These questions refer to the chapter’s examples. Use the return links to review their answers.
What should a defensible placement record capture for a new field workload?
Return to the chapter’s knowledge checkA team says, "This is a smart factory, so everything should run at the edge." What is the best review response?
Return to the chapter’s knowledge check
Return to Edge-Fog Use Cases: Placement Patterns · Browse Labs