HTTP Polling Request Count
Compare HTTP message paths for one synthetic reading by measuring how a five-second polling interval changes browser requests and bytes.

The Application Protocols guide asks learners to compare two message paths for the same reading and different team needs. On iotclass.org a service worker in this lab folder plays the server; nothing leaves your browser.
Predict the reading, then compare it with the measurement.
Browser (Chromium DevTools)
Phone browserCompare HTTP message paths for one synthetic reading by measuring how a five-second polling interval changes browser requests and bytes.
Open the browser lab, then inspect the real Network, Console, or Accessibility panel in DevTools.
Open the phone lab (new tab)Steps
Step 1
- Do
- In the Network panel, clear prior rows and press One request on the page.
- You will see
- Input: One same-origin GET. Observed page: Requests: 1; Response-body bytes: 67; Last server time: 2026-10-09T19:11:02.498Z. Observed DevTools: One telemetry row has HTTP 200; 67 B resources. Interpretation: One fetch produced one request row.
- Why it matters
- Evidence: Step 1 screenshot shows the real Chromium page and DevTools panel. Mechanism: The visible Network row is generated by the scoped service worker. Boundary: The 67 B count covers response body, not headers. Next check: Run a bounded fast polling window.
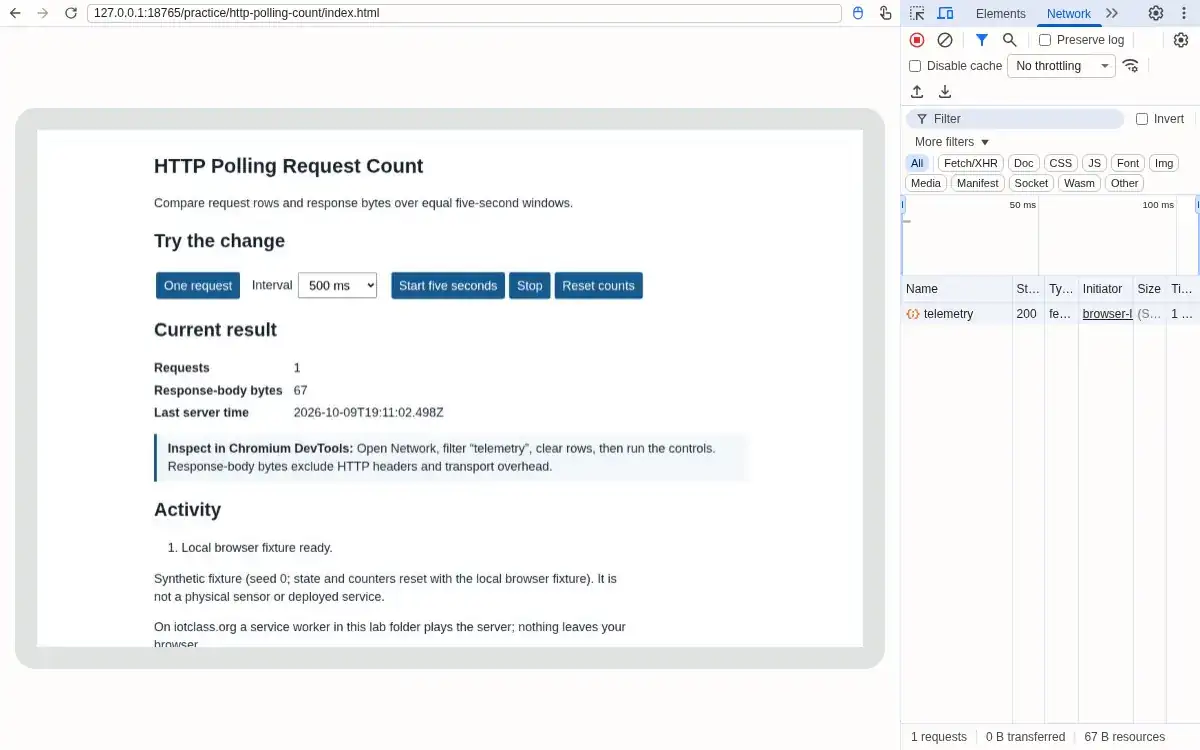
Step 1 · Browser (Chromium DevTools); numbered callout added to a real capture. Enlarge screenshot (new tab) Step 2
- Do
- In the interval field choose 500 ms, then press Start five seconds and watch Network.
- You will see
- Input: Five seconds at 500 ms. Observed page: Requests: 11; Response-body bytes: 738; Last server time: 2026-10-09T19:11:07.850Z. Observed DevTools: 11 telemetry rows show (ServiceWorker); the page counts 738 B of response bodies. Interpretation: The faster interval repeated the same fetch eleven times.
- Why it matters
- Evidence: Step 2 screenshot shows the real Chromium page and DevTools panel. Mechanism: The loop issues a GET immediately and then every 500 ms. Boundary: This count varies with scheduling and page activity. Next check: Stop and verify the count stays fixed.
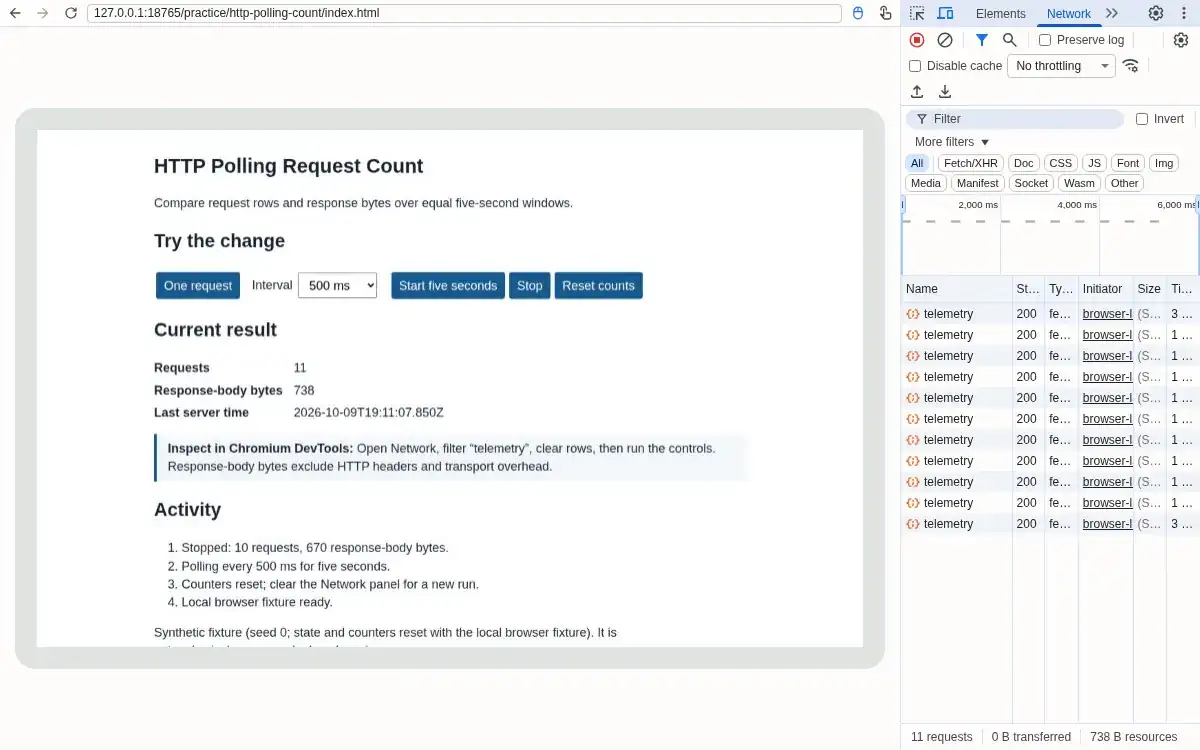
Step 2 · Browser (Chromium DevTools); numbered callout added to a real capture. Enlarge screenshot (new tab) Step 3
- Do
- In the controls panel press Stop and recheck the Network row count.
- You will see
- Input: Stopped after the 500 ms window. Observed page: Requests: 11; Response-body bytes: 738; Last server time: 2026-10-09T19:11:07.850Z. Observed DevTools: The table remains at 11 requests. Interpretation: No further request appeared after stop.
- Why it matters
- Evidence: Step 3 screenshot shows the real Chromium page and DevTools panel. Mechanism: Clearing the timer ends scheduled fetches. Boundary: An in-flight response can finish after the timer is cleared. Next check: Try a longer interval for the same window.
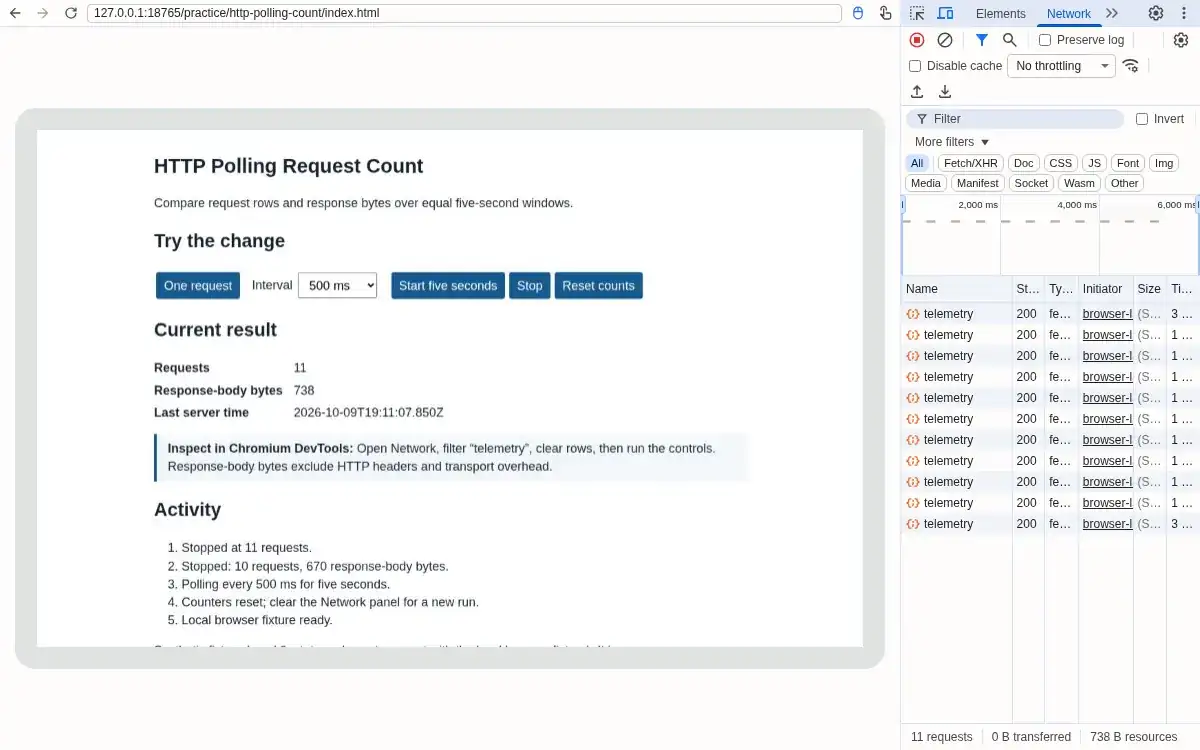
Step 3 · Browser (Chromium DevTools); numbered callout added to a real capture. Enlarge screenshot (new tab) Step 4
- Do
- In the interval field choose 2000 ms, clear Network, and start another five seconds.
- You will see
- Input: Five seconds at 2000 ms. Observed page: Requests: 3; Response-body bytes: 202; Last server time: 2026-10-09T19:11:12.809Z. Observed DevTools: 3 telemetry rows show (ServiceWorker); the page counts 202 B of response bodies. Interpretation: The longer interval produced three requests.
- Why it matters
- Evidence: Step 4 screenshot shows the real Chromium page and DevTools panel. Mechanism: An immediate fetch plus two scheduled fetches fit the window. Boundary: These are browser timings, not device power measurements. Next check: Compare the two request and byte ledgers.
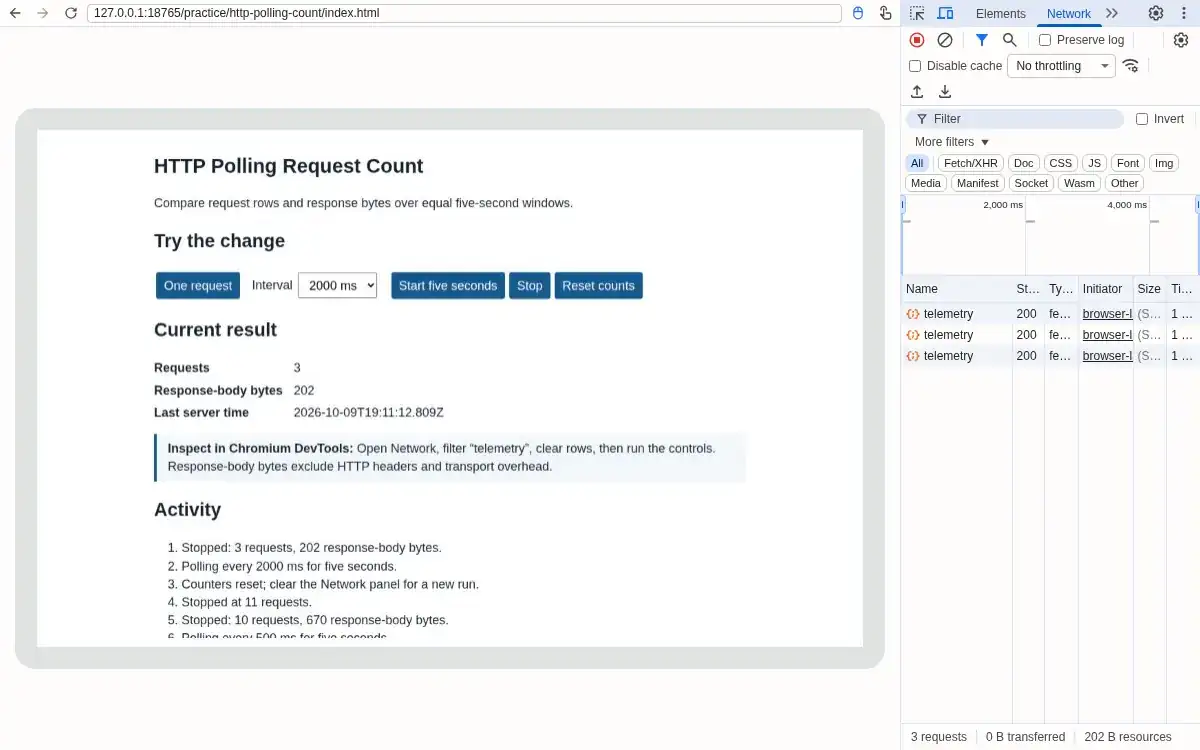
Step 4 · Browser (Chromium DevTools); numbered callout added to a real capture. Enlarge screenshot (new tab) Step 5
- Do
- In the Network panel compare the two five-second runs and the page byte counter.
- You will see
- Input: Compared 500 ms with 2000 ms. Observed page: Requests: 3; Response-body bytes: 202; Last server time: 2026-10-09T19:11:12.809Z. Observed DevTools: Earlier: 11 requests / 738 B body; now: 3 requests / 202 B body. Interpretation: The slower loop made eight fewer requests in this run.
- Why it matters
- Evidence: Step 5 screenshot shows the real Chromium page and DevTools panel. Mechanism: The same endpoint and observation window isolate interval choice. Boundary: DevTools transferred bytes reflect worker handling; the page counts response bodies. Next check: Preserve the controls and Network table together.
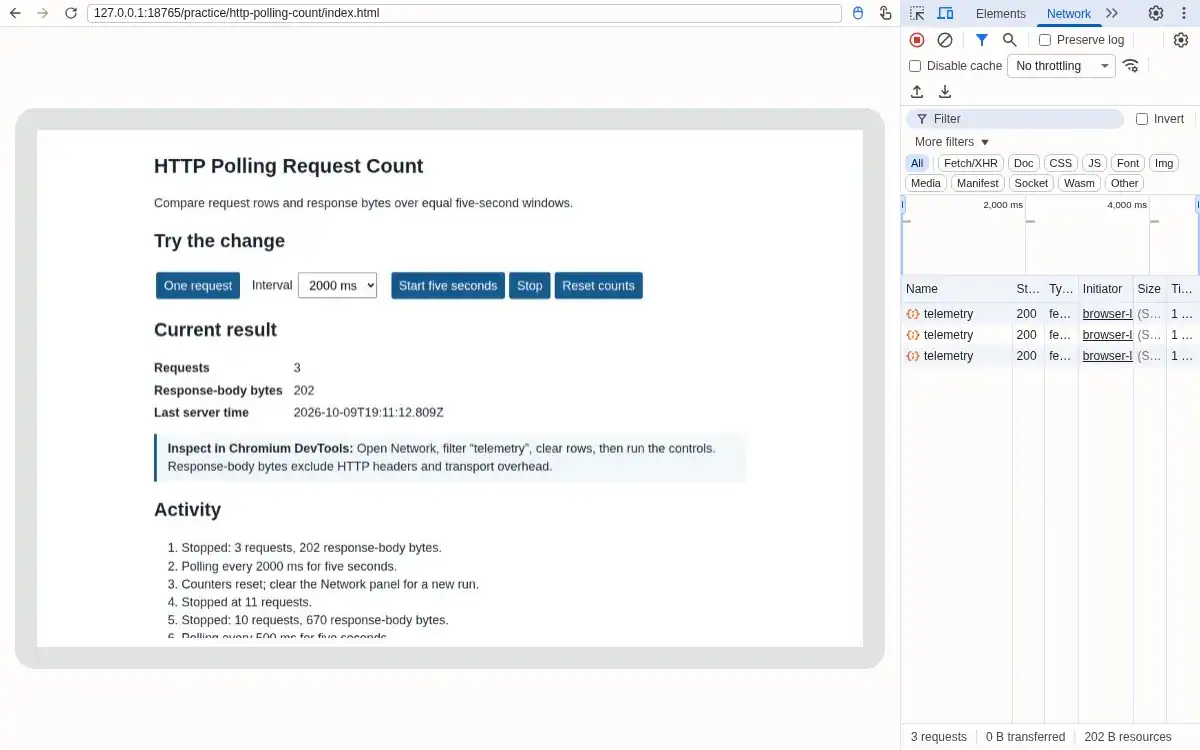
Step 5 · Browser (Chromium DevTools); numbered callout added to a real capture. Enlarge screenshot (new tab) Step 6
- Do
- In the Network panel capture the interval control, rows, and byte totals together.
- You will see
- Input: Captured the 2000 ms interval and its three rows. Observed page: Requests: 3; Response-body bytes: 202; Last server time: 2026-10-09T19:11:12.809Z. Observed DevTools: 3 requests; service-worker rows; 202 B response bodies. Interpretation: The screenshot ties control setting to observed cost.
- Why it matters
- Evidence: Step 6 screenshot shows the real Chromium page and DevTools panel. Mechanism: The real DevTools table and page are visible in one browser window. Boundary: No battery drain was directly measured. Next check: Use request count as a transport-design input.
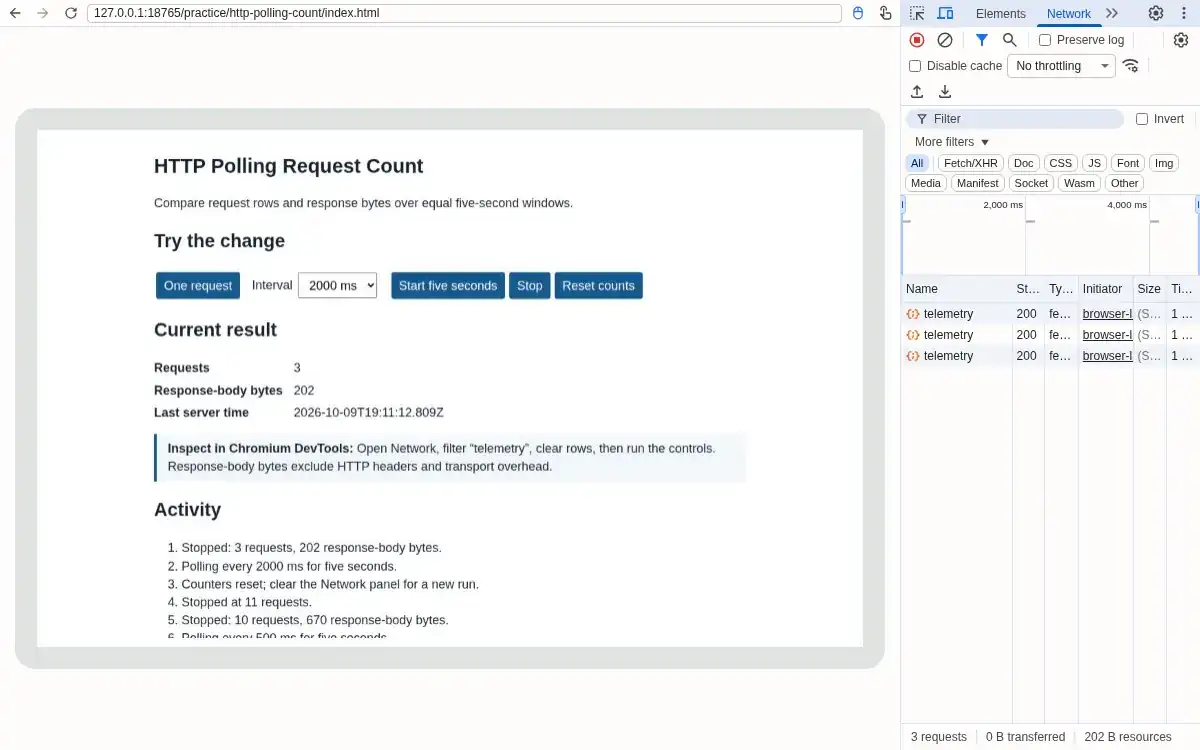
Step 6 · Browser (Chromium DevTools); numbered callout added to a real capture. Enlarge screenshot (new tab)
Chapter checks
These questions refer to the chapter’s examples. Use the return links to review their answers.
Per this chapter's Common Pitfalls, what's wrong with opening a new HTTP connection for each sensor's POST request in a loop, even under HTTP/2?
Return to the chapter’s knowledge checkAn IoT cloud API receives a sensor reading where the device's API key has expired. The server correctly identifies the problem. Which HTTP status code should it return, and why?
Return to the chapter’s knowledge check
Return to HTTP Pitfalls: Connections, Payloads, and Chunking · Browse Labs