One of three capstone project briefs in this series – along with Capstone Project 2: Smart Agriculture System and Capstone Project 3: Fleet Tracking System. This part opens with the shared capstone approach – turning a project idea into a reviewable claim, protecting a thin sensor-to-decision slice, and treating interfaces as evidence – which applies to all three briefs, then works through the Smart Environment Monitor brief itself.
Capstone projects turn the course material into working IoT systems. A strong project starts with requirements, acceptance criteria, and a realistic bill of materials before hardware is purchased. The main risk is integration: sensors, firmware, networking, storage, security, dashboards, and power assumptions may work separately but fail when combined.
Choose a project scope that fits the time, budget, team size, and experience level.
Freeze must-have requirements early so the project can reach a polished demo.
Treat power, connectivity, security, and data storage as design constraints from day one.
Reserve meaningful time for end-to-end integration testing.
Document architecture, wiring, code, tests, trade-offs, and known limitations.
Phoebe’s Field Notes: The mAh Math in This Chapter’s Own Budget Assumes a Perfect Battery
Phoebe’s Why
This chapter’s power budget is already careful – it sums active, sleep, and sensor current into \(I_{avg}=0.92\) mA and divides 3000 mAh by it to get 136 days, 19x past the 7-day target. That division is charge accounting, and it is correct as far as it goes: milliamp-hours really do add and divide that way. What it cannot see is voltage. Two AA cells in series are not a fixed 3.0 V tap; alkaline cells have real internal resistance that climbs sharply as they empty, and the same 160 mA Wi-Fi transmit current this chapter names can sag the terminal voltage far more at the end of the pack’s life than at the start – exactly when the “19x margin” headline suggests there is nothing left to worry about.
The Derivation
Energy from charge and pack voltage:
\[E = \frac{Q_0}{1000}\times V_{nom}\]
Terminal voltage under load, pack internal resistance \(R_{int,pack}\):
\[V_{term}=V_{oc}-I\,R_{int,pack}\]
Charge remaining after self-discharge over service time \(t\) at rate \(r\):
\[Q(t)=Q_0(1-r)^{t}\]
A capacitive sensing element’s own RC settling time, distinct from firmware-level active windows:
\[\tau = R\,C\]
Worked Numbers: This Chapter’s Own 2xAA Environment Monitor
Nameplate energy (this chapter’s own 2xAA, 3000 mAh, \(V_{nom}=3.0\) V for two 1.5 V cells in series): \(E=3000/1000\times3.0=9.00\) Wh.
Voltage sag on this chapter’s own 160 mA Wi-Fi TX current: catalog-typical alkaline \(R_{int}\approx0.20\,\Omega\)/cell fresh (pack \(=0.40\,\Omega\)) gives only 64.0 mV sag – negligible. Catalog-typical end-of-life \(R_{int}\approx1.50\,\Omega\)/cell (pack \(=3.00\,\Omega\)) gives 0.480 V sag, and end-of-life alkaline open-circuit voltage sits near 0.95 V/cell (1.90 V pack), so terminal voltage during that same 160 mA burst falls to \(1.90-0.48=1.42\) V – below what most 3.3 V-rail regulators can hold up, a brownout the naive “136 days remaining” coulomb count cannot see coming.
Self-discharge is the good news here: alkaline cells self-discharge at only about 2.5%/year (unlike a LiPo’s roughly 2%/month), so over this chapter’s own 136-day run the loss is \(136/365\times2.5\%=0.932\%\) – genuinely negligible, the opposite finding from a LiPo-powered design.
Where the sensor’s own current line item comes from: a capacitive-type environmental sensor’s active window exists partly to let its internal oscillator settle; a catalog-typical sensing capacitance (\(C\approx100\) pF) through a catalog-typical loop resistance (\(R\approx2\) k\(\Omega\)) gives \(\tau=RC=200\) ns, so \(5\tau=1.00\,\mu\)s – the raw capacitive transduction settles almost a million times faster than this chapter’s stated 200 ms active window, meaning that 200 ms line item is mostly paying for bus wake-up and firmware overhead, not the sensor physics itself.
2.3 Start With One Useful Decision
Before choosing sensors or cloud services, name the decision the finished project should improve. A room monitor might help someone decide when to ventilate. An irrigation prototype might help a grower decide when a zone needs water. A fleet tracker might help an operator decide whether a vehicle is inside a safe route. If that decision is not clear, every feature feels equally important and the project becomes hard to finish.
Then build the smallest path that can prove the decision: sensing, firmware, network hop, storage, dashboard, and one failure response. The first strong demo is not the one with the most parts. It is the one where a reviewer can follow the evidence from the physical event to the screen and understand what would happen if power, connectivity, calibration, or credentials failed.
Use the briefs below as starting shapes for that proof. Keep the parts that support the decision, adapt the parts that do not fit your budget or hardware, and record the trade-off so the final report reads like engineering evidence rather than a shopping list.
2.4 Learning Objectives
After completing a capstone project, you will be able to:
Architect a complete IoT system from requirements gathering through deployment and validation.
Integrate sensors, actuators, firmware, cloud services, and dashboards across the full stack.
Apply security practices at device, network, application, and data layers.
Analyse sensor data and build visualisations that support actionable decisions.
Produce professional documentation including architecture diagrams, BOMs, wiring notes, and test reports.
Optimise designs within real constraints such as power budget, component cost, connectivity range, and schedule.
2.5 How To Use These Project Briefs
Use each project as a structured brief, not as a rigid recipe. Keep the must-have requirements, adapt the hardware to what is available, and document any trade-offs you make.
Chapter Roadmap
Use the chapter as a capstone planning checklist:
First turn each project idea into a reviewable claim with artifacts, acceptance criteria, and a thin sensor-to-decision slice.
Then compare three project families: environment monitoring, smart agriculture, and fleet tracking.
Next follow the requirements, hardware, architecture, milestone, power, security, and data-storage evidence in each brief.
Finally package the report, source code, video, hardware documentation, and presentation trade-offs so the demo is reproducible.
Checkpoints recap the release decisions; quizzes, calculators, and the claim-to-evidence table provide the practice evidence.
2.6 Project Briefs Become Reviewable Claims
A capstone brief is useful only when it can be turned into a reviewable engineering claim. The three project families below are not shopping lists. They are worked examples of how to turn a problem domain into requirements, evidence, and a demo path. A smart environment monitor claims it can make indoor conditions visible. A smart agriculture system claims it can close the loop between soil evidence and watering. A fleet tracker claims it can preserve location evidence across power, cellular, and backend constraints.
Start by naming the user decision the system supports. Facility staff might decide when to ventilate a room. A grower might decide when a zone needs water. A fleet operator might decide whether a vehicle is inside a geofence or whether a route is stale. Once the decision is clear, each requirement needs a measured artifact: calibration note, payload sample, MQTT topic, database row, dashboard state, alert record, power measurement, security assumption, and demo script.
The briefs deliberately expose trade-offs. ESP32 and Raspberry Pi Pico W boards reduce cost but force careful firmware and power choices. BME280, SCD40, PMS5003, GPS modules, LoRa radios, and LTE-M or NB-IoT modems each change wiring, library maturity, current draw, and field risk. MQTT QoS 1, TLS, local buffering, InfluxDB, Supabase, Grafana, and OTA update decisions are project evidence, not decorative architecture terms.
Each project brief should be converted into artifacts that let a reviewer trace the claim from requirement to live behavior.
2.7 Keep The Thin Slice Alive
The practical route is to protect one thin vertical slice before expanding scope. For an environment monitor, that means one sensor reading, one firmware loop, one transport path, one stored row, one dashboard value, and one alert rule. For agriculture, it means one soil reading, one actuator decision, one safety interlock, and one watering record. For fleet tracking, it means one GPS fix, one cellular publish, one backend insert, one geofence calculation, and one visible route state.
Write the project ledger while building. Each row should include requirement ID, component choice, firmware or dashboard commit, test method, artifact path, result, decision, and retest trigger. A useful artifact might be a serial log, packet capture, MQTT broker trace, InfluxDB query, Supabase row, Grafana screenshot, current measurement, watchdog reset note, or wiring photo. Do not wait for the final report to organize this evidence. The report should summarize the ledger, not reconstruct it from memory.
Use the tables in each brief as starting constraints, then make the constraints local. A target such as “> 99% data transmission reliability” needs a run length, environment, retry policy, and definition of success. A battery-life estimate needs active, idle, sleep, sensor warm-up, radio transmit, reconnect, and failure-recovery states. A security claim needs device identity, credential storage, transport protection, authorization boundary, and recovery behavior after rotation or reset.
Plan the demo as an engineering test. Show the happy path, but also show stale data, reconnect, denied action, low battery, bad calibration, actuator lockout, or geofence boundary behavior when that failure mode matters. If a feature cannot be demonstrated, leave an artifact: test log, query, screenshot, captured packet, or short video. A reviewer should be able to tell which claims were measured, which claims were only designed, and which claims are outside scope.
2.8 Integration Evidence Has Interfaces
Under the hood, capstone projects fail at interfaces. Sensor accuracy can be real while units are wrong in the payload. Firmware can publish correctly while the broker topic violates the dashboard query. A database can store rows while timestamps use device-local time instead of UTC. An alert can fire during a demo while the stale-data path is undefined. A geofence can work in one map projection while the backend stores another coordinate assumption.
Treat every interface as a contract with evidence. Device-to-firmware contracts need pinout, bus speed, calibration, units, timing, error code, and warm-up behavior. Firmware-to-network contracts need topic naming, payload schema, QoS, retry behavior, local buffer limit, and duplicate handling. Network-to-cloud contracts need identity, authorization, TLS or DTLS posture where applicable, idempotency, schema version, and retention. Cloud-to-dashboard contracts need freshness labels, missing-data states, alert owner, and permission behavior.
Evidence also needs grain. A project can record one average latency, but reviewers need to know whether the latency was per packet, per batch, per geofence event, per watering cycle, or per dashboard refresh. Power evidence should separate sensor warm-up, MCU active state, radio transmit, radio receive, sleep, and fault recovery. Security evidence should separate authentication, authorization, encryption in transit, credential rotation, and operational recovery.
Fault injection makes those contracts visible. Unplug a sensor, restart the broker, send a duplicate message, deny a dashboard permission, force a GPS timeout, or run the actuator with an empty tank flag. The point is not to make the prototype production-grade; it is to prove the team knows where the interface can fail and what evidence shows the failure was handled honestly.
The deeper test is whether the project could be repeated by another team member after a change. A new sensor library, modem firmware, cellular plan, antenna placement, dashboard query, retention policy, or enclosure can invalidate earlier evidence. Record the retest trigger next to the evidence. A capstone then becomes more than a final demo: it becomes a maintainable engineering handoff that explains why the system worked and what would need to be checked before trusting it again.
2.9 How It Works: Turn a Project Brief Into Evidence
Name the claim. State the user, environment, decision, and measurable outcome before choosing extra features.
Protect the thin slice. Build one sensor-to-decision path that crosses hardware, firmware, network, storage, dashboard, and demo script.
Attach artifacts. Store the measurement, payload sample, query, screenshot, power note, and security assumption next to the requirement they support.
Test the boundary. Exercise reconnect, stale data, actuator lockout, low battery, denied permission, bad calibration, or geofence edge behavior when it can change the claim.
Package the handoff. Leave a reviewer with the claim, evidence path, result, remaining risk, and retest trigger.
Checkpoint: Capstone Evidence
You now know:
A project brief becomes stronger when every requirement has an artifact, owner, pass/fail test, and limit.
The thin slice must connect one sensor reading, one firmware loop, one network path, one stored row, one dashboard value, and one failure response.
The final report should summarize the ledger rather than reconstruct calibration notes, payload samples, queries, screenshots, power measurements, and security assumptions from memory.
2.10 Deep Dive: A Capstone Is an Integration Project
A capstone project is not a collection of separate labs. It is a complete path from requirement to measured behavior: sensor input, firmware timing, network delivery, storage, security, dashboard display, alert handling, power budget, enclosure, and documentation. The hard part is making those pieces agree under realistic conditions.
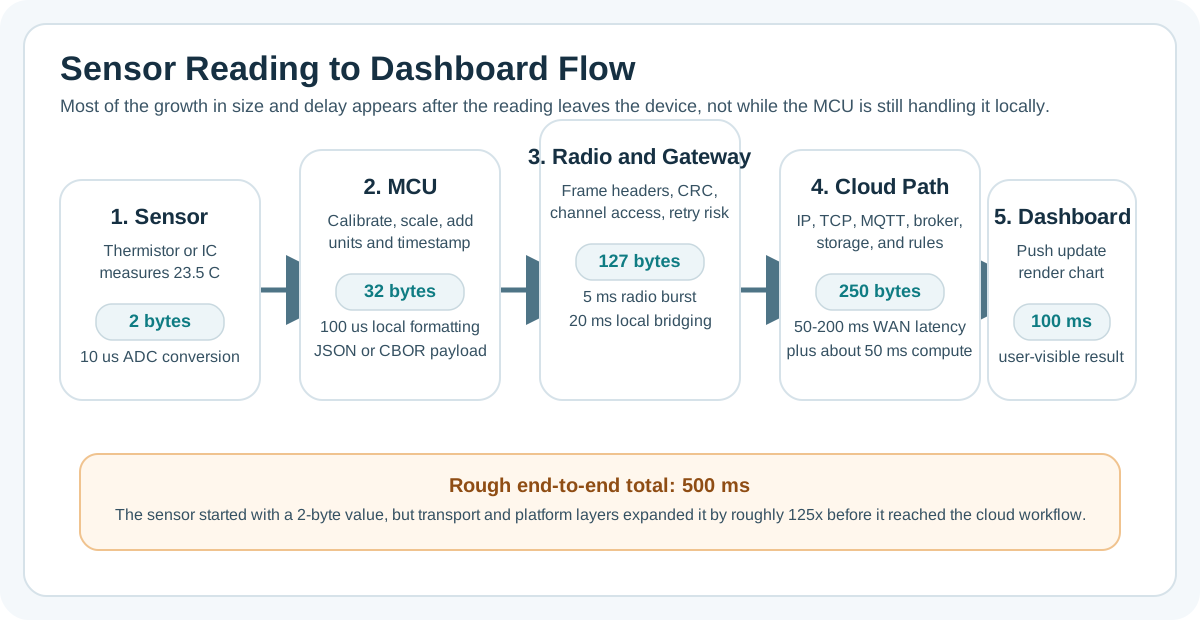
Figure 2.1: A capstone demo should prove the whole sensor-to-dashboard path, not only the device or the screen in isolation.
Start small enough to finish. A reliable sensor-to-dashboard path with clear acceptance criteria is stronger than an ambitious feature list that never reaches integration. The project brief should state what must work, what can be dropped, and what measurement proves the build is ready for demonstration. For example, “show a live CO2 reading on a Grafana panel within 60 seconds of measurement” is testable. “Build an air-quality platform” is not testable until it is decomposed into sensor choice, sampling interval, transport, storage, alerting, and display behavior.
The first useful milestone is a thin vertical slice: one real sensor, one firmware loop, one network path, one storage record, and one visible dashboard value. That slice exposes cross-layer assumptions early. A BME280 or SCD40 may read correctly on the bench, but the project is not integrated until the timestamp, MQTT topic, payload schema, database row, dashboard freshness label, and alert rule all agree. A tiny local reading becomes a larger, delayed, and failure-prone system event once headers, retries, brokers, storage, and browser rendering are included.
Boundary
What to Freeze or Prove
Scope
Freeze must-have behavior before buying hardware or writing most firmware.
Integration
Test sensor, firmware, network, cloud, dashboard, and alert behavior together before adding optional features.
Demo
Define what the audience will see, what data is real, and what limitations remain.
For each project, convert the brief into acceptance criteria that a team can run. A smart environment monitor might require SCD40 CO2 readings every 5 minutes, BME280 temperature and humidity on I2C, PMS5003 particulate readings over UART, MQTT publishing with QoS 1, InfluxDB or Supabase storage, Grafana or a web dashboard, and an alert within 60 seconds when CO2 exceeds the threshold.
Plan integration time as real work, not cleanup. Hardware may need pull-up resistors, level shifting, enclosure airflow, or sensor warm-up. Firmware may need watchdog recovery, nonvolatile configuration, timestamp handling, and OTA rollback. Network tests may reveal weak Wi-Fi, LoRaWAN duty-cycle limits, MQTT session behavior, TLS certificate problems, or duplicate messages. Dashboards may need missing-data handling and clear freshness labels.
Write each acceptance criterion as an observable run, not as a promise in the report. A useful record includes the requirement ID, firmware version or commit, hardware revision, sensor calibration note, payload sample, broker topic, database query, dashboard screenshot, measured latency, pass/fail result, and the decision that follows.
Artifact
Evidence It Should Carry
Thin vertical slice
One sensor, one device, one transport, one storage path, and one dashboard value.
Lead time, substitute, interface, power draw, enclosure impact, cost, and library maturity.
Final packet
Architecture diagram, BOM, wiring table, firmware commit, database schema, test log, power measurement, security assumptions, unresolved risks, and demo script.
Most capstone failures are cross-layer failures. A sensor may be accurate on the bench but stale in the dashboard because timestamps are wrong. A Wi-Fi node may publish in the lab but fail in the installed room because RSSI is weak. A battery estimate may look strong until sensor warm-up, regulator quiescent current, and retransmissions are included. A secure design may pass login testing but fail device recovery because credential rotation and factory reset were not planned.
Use the data path as the organizing model. At the device, verify sampling rate, calibration constants, units, monotonic timestamps, watchdog behavior, and error codes. At the radio or gateway, record RSSI or SNR, retry count, channel plan, duty-cycle limits, local buffer behavior, and whether duplicate packets are possible. At the broker and cloud service, record MQTT QoS, retained-message policy, device identity, topic authorization, schema version, idempotency key, retention window, and alert-rule owner. At the dashboard, distinguish missing data, stale data, out-of-range data, and values suppressed by permissions.
Keep a cut line. Mark optional features that can be removed without breaking the core demo, and protect the thin vertical slice until the final presentation works end to end.
2.11 Key Concepts
Requirements specification: A documented list of functional and non-functional requirements that must be validated before procurement or firmware development begins.
System architecture diagram: A visual representation of sensors, gateways, cloud services, dashboards, integration points, failure points, and security boundaries.
Bill of materials (BOM): A structured list of hardware components, quantities, and costs used for procurement and scope control.
Integration testing: End-to-end testing from sensor to dashboard, distinct from unit testing individual components.
Power budget: A calculation of current draw across active, sleep, sensor, and radio states compared against the battery or energy source.
Over-the-air (OTA) update: A mechanism for remotely updating firmware without physical access to every device.
Acceptance criteria: Specific measurable conditions a project must satisfy, such as delivery latency, battery life, alert timing, or data reliability.
Field validation: Testing under realistic environmental, RF, mechanical, and operational conditions rather than ideal bench conditions.
2.12 For Beginners: Capstone Projects
Capstone projects bring together everything you have learned to build a complete, working IoT system. Start with a small reliable version, then add complexity only when the core sensor-to-dashboard path works end to end.
2.13 Prerequisites
Before starting a capstone project, you should have completed:
Sensor Fundamentals and at least one sensor lab
Networking Fundamentals including MQTT or similar protocol
Cloud Computing basics or edge computing concepts
Security Fundamentals including device authentication
Basic programming skills (Python, C/C++, or JavaScript)
Knowledge Check: Project Planning Priorities
With the review model in place, the first brief keeps the system relatively contained: indoor sensing, Wi-Fi/MQTT delivery, cloud storage, and a dashboard that makes room conditions visible.
Design and build a comprehensive indoor environment monitoring system that tracks air quality, temperature, humidity, light levels, and noise. The system should provide real-time dashboards, historical analytics, and automated alerts when conditions exceed healthy thresholds.
2.14.2 Project Context
Indoor environment monitoring helps facility teams spot poor ventilation, comfort problems, and air-quality trends before they become persistent operational issues. Your system should turn raw sensor readings into clear dashboard signals and actionable alerts.
2.14.3 Requirements Specification
2.14.3.1 Functional Requirements
ID
Requirement
Priority
F1
Measure temperature (±0.5°C accuracy)
Must Have
F2
Measure relative humidity (±3% accuracy)
Must Have
F3
Measure CO2 levels (±50 ppm accuracy)
Must Have
F4
Measure particulate matter (PM2.5)
Should Have
F5
Measure ambient light (lux)
Should Have
F6
Measure noise level (dB)
Could Have
F7
Display real-time readings on local screen
Must Have
F8
Send data to cloud every 5 minutes
Must Have
F9
Send alerts when thresholds exceeded
Must Have
F10
Provide historical data visualization
Must Have
F11
Calculate and display air quality index
Should Have
F12
Support multiple sensor nodes
Could Have
2.14.3.2 Non-Functional Requirements
ID
Requirement
Target
NF1
Battery life (if portable)
> 7 days
NF2
Data transmission reliability
> 99%
NF3
Sensor reading latency
< 2 seconds
NF4
System uptime
> 99.5%
NF5
Data storage retention
1 year
NF6
Total hardware cost
< $100
2.14.4 Recommended Hardware
Component
Options
Est. Cost
Microcontroller
ESP32, Raspberry Pi Pico W
$5-15
Temperature/Humidity
DHT22, BME280, SHT31
$5-15
CO2 Sensor
MH-Z19B, SCD30, SCD40
$15-50
Particulate Sensor
PMS5003, SDS011
$15-30
Light Sensor
BH1750, TSL2561
$2-5
Sound Sensor
MAX4466, INMP441
$3-8
Display
0.96” OLED, 2.4” TFT
$5-15
Enclosure
3D printed or project box
$5-10
Putting Numbers to It
Meeting the 7-day battery life target requires careful power budgeting. ESP32 draws 160mA when WiFi transmits, 0.8mA in light sleep, and sensors add 20mA active (200ms/5min).
Battery life (2x AA = 3000mAh):\[\text{Hours} = \frac{3000mAh}{0.92mA} = 3261 \text{ hours} = 136 \text{ days}\]
This exceeds 7 days by 19x, providing margin for WiFi retries and display usage. If we sample every minute instead of every 5 minutes, average current rises to 4.6mA and estimated life drops to 27 days, still acceptable.
Show code
viewof tx_current = Inputs.range([50,300], {value:160,step:10,label:"WiFi TX Current (mA)"})viewof sleep_current = Inputs.range([0.1,5], {value:0.8,step:0.1,label:"Sleep Current (mA)"})viewof sensor_current = Inputs.range([5,50], {value:20,step:5,label:"Sensor Active Current (mA)"})viewof tx_duration = Inputs.range([0.1,2], {value:0.2,step:0.1,label:"TX Duration (seconds)"})viewof sample_interval = Inputs.range([60,600], {value:300,step:60,label:"Sample Interval (seconds)"})viewof battery_capacity = Inputs.range([1000,5000], {value:3000,step:500,label:"Battery Capacity (mAh)"})
environment/
  +-- {device_id}/
  |   +-- temperature
  |   +-- humidity
  |   +-- co2
  |   +-- pm25
  |   +-- light
  |   +-- status
  +-- alerts/
      +-- {device_id}
Knowledge Check: MQTT Topic Design
2.14.6.3 Week 5-6: Analytics, Alerts & Polish
Deliverables:
2.14.7 Evaluation Rubric
Criteria
Points
Excellent
Good
Needs Work
Hardware Assembly
20
Clean, reliable, documented
Working but messy
Intermittent issues
Sensor Accuracy
15
Within specs
Close to specs
Unreliable
Cloud Integration
20
Full pipeline, reliable
Basic connectivity
Data loss issues
Dashboard/Visualization
15
Professional, insightful
Functional
Basic
Alerts
10
Configurable, reliable
Working
Missing
Code Quality
10
Well-structured, commented
Readable
Spaghetti
Documentation
10
Complete, professional
Adequate
Minimal
Total
100
2.14.8 Extension Ideas
Add voice alerts via speaker
Implement machine learning for occupancy detection
Create mobile app for monitoring
Add multiple rooms with mesh networking
Integrate with building management systems
Checkpoint: Environment Monitor
You now know:
The must-have path measures temperature, humidity, CO2, local display state, cloud data every 5 minutes, alerts, and historical visualization.
The power target is more than 7 days if portable, while the worked battery estimate gives large margin from a 3000mAh pack when sampling every 5 minutes.
The review evidence should connect sensor accuracy, MQTT topic design, InfluxDB retention/downsampling, dashboard state, and alert behavior.

 Checkpoint: Capstone Evidence